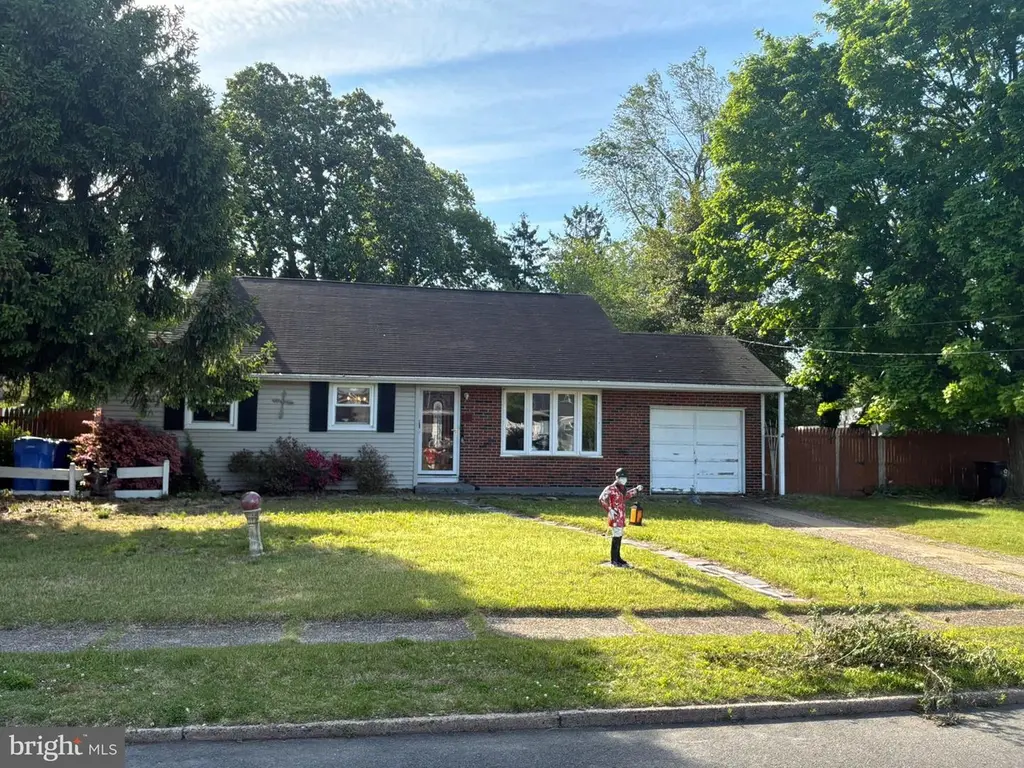
812 Colby Ave · Philadelphia, PA
Flood risk 1/10 · Minimal
- FEMA flood zone
- X (unshaded)
- Chance of flooding over 30 yrs
- 0.0%
- Est. flood insurance / yr
- $507 – $1,088
Fire risk 1/10 · Minimal
- Est. fire insurance / yr
- $526 – $976
Heat risk 7/10 · Major
- Hot days now (above 104°F)
- 7 days/yr
- Hot days in 30 yrs
- 15 days/yr
Wind risk 6/10 · Moderate
- Chance of severe wind over 30 yrs
- 36.0%
Air-quality risk 4/10 · Minor
- Unhealthy air days now
- 5 days/yr
- Unhealthy air days in 30 yrs
- 7 days/yr
Risk factors via First Street. Map © Google.
Why this score? — see what drove the D grade
The composite is a weighted blend of 9 inputs, each scored 0–100. Each bar is that input's sub-score; the figure is the points it added to the 100-point composite (weight × sub-score).
- ARV discount +15.0/15.0
- Cash flow +9.4/30.0
- 1% rule +4.0/10.0
- Livability +3.9/5.0
- Schools +3.4/10.0
- DSCR +2.7/10.0
- Rent growth +2.5/5.0
- Condition / age +2.5/5.0
- Appreciation +0.0/10.0
$279,900
🖨 Deal sheet (PDF) 📄 Offer letter ✓ Due diligence
Listing remarks
812 Colby Ave in Delran offers a great opportunity for investors or buyers looking to add their personal touch. This split-level home features 3 bedrooms and 1.5 baths with a classic brick front and vinyl siding exterior. Inside, you’ll find hardwood floors and a functional layout with plenty of potential. The property also includes a screened-in porch, fenced backyard, and storage shed, providing additional outdoor living and storage space. Conveniently located near shopping, dining, and major roadways. Property is being sold strictly as-is. Buyer responsible for any inspections, certifications, and township requirements. Great investment opportunity with solid potential!
Key facts
- 2 parking spots
- Built 1958
- Listed 10 days
Property features AI
Finance
- HOA & community: Ground rent paid annually
Exterior
- Parking: Concrete driveway with 2 spaces; Total of 2 garage/parking spaces
- Utilities: Public water; Public sewer; Electric cooling fuel; Natural gas heating and hot water
- Home design: Detached single-family home; Pitched shingle roof; Crawl space foundation; Ownership: Fee simple; Year built: estimated
- Construction: Frame construction; Replacement windows
- Exterior features: Exterior lighting; Sidewalks; Street lights; Front, side and rear yard; Wood fencing, fully fenced; Patio(s); Screened porch; Porches with brick; Shed
Interior
- Kitchen: Built-in microwave; Dishwasher; Gas range/oven; Refrigerator
- Bedrooms: Three bedrooms on the upper level
- Flooring: Hardwood floors
- Bathrooms: One full bathroom (upper level); One half bathroom (lower level)
- Heating & cooling: Forced air heating (natural gas); Central air conditioning; Ceiling fans; Natural gas hot water
- Interior features: Attic; Tub with shower; Ceiling fans; Combination dining and living area; Wood floors; Drywall walls and ceilings
- Laundry & utility: Washer and dryer; Laundry on lower floor
Neighborhood map
What this means for you Summary
Snapshot
- This is a 3-bed/1.5-bath single-family listed at $280k.
Deal economics
- At list price, monthly cash flow is $-197 ($-2k/yr) — negative.
- To cash-flow at today's rent, offer at most $245k (12.5% below list).
- To meet the 1% rule (rent ≥ 1% of price), the offer needs to be $253k (9.8% below list).
- Recommended offer: $245k (12.5% below list) — sets the bar for cash-flow.
- Cap rate 5.4% vs local median 3.5% in Philadelphia — top-decile yield for the area; either an underpriced asset or a hidden risk that comps aren't pricing in. Stress-test before assuming the spread holds.
Location & tenants
- Location reads 77/100 on livability (#348 in PA, #3,054 nationally) — a middle-class / working-renter tenant base. Strengths: amenities A+, commute A+, cost of living A+; Watch: employment C-, crime F.
- Delran Township School District (suburban): math 22% / reading 49% proficiency, ranked #251 of 472 in NJ (top 53%) — families likely to look elsewhere, expect single-tenant / working-renter base with shorter leases; only 17% free/reduced lunch — higher-income household profile.
- Zoned schools: Millbridge Elementary School (653 students, 26% FRL); Delran Middle School (math 25% / reading 53%, grade F, #207 of 431 statewide, top 48%, 710 students, 24% FRL); Delran High School (math 23% / reading 57%, grade F, #187 of 399 statewide, top 48%, 912 students, 21% FRL).
- Market conditions: 7 comparable units currently listed for rent nearby; rentals leasing fast (median 12d on market — plan ~1-2 weeks tenant-placement turnaround); solid renter incomes; 2,161 units permitted in Burlington County in 2024 (988 in 5+ unit buildings).
- This rent runs 32% of the median local income ($94k/yr) — at the standard rent-burdened threshold; future hikes will face affordability resistance.
Forward outlook
- Local home prices are declining (-3.0%/yr); year-one equity from $2k of loan paydown is wiped out by about $8k of value loss. Plan a longer hold.
- Burlington County population projected to shrink 5% by 2050 — rents likely to lag national; underwrite the cash flow, not the appreciation.
Negotiation context
- Only 10 days on market — expect competitive offers; lowballing is unlikely to land.
Risks & watch-outs
- Watch-outs: property tax is 2.6% of price; built in 1958 — expect roof / HVAC / electrical / plumbing capex.
- Climate carrying-cost: major wind risk, 36% chance of damaging wind over 30y; extreme-heat days projected 7→15/yr by 2055 (HVAC capex compounding) — expect insurance premiums to compound above CPI over the hold.
Questions for the listing agent
- What do current leases actually rent for vs. the listed asking? Can we see a recent rent roll and the last 12 months of T-12 income?
- Built in 1958 — when were the roof, HVAC, electrical panel, plumbing, and water heater last replaced?
- Property tax is high relative to price — has the assessment been appealed recently, and will the sale trigger a re-assessment?
- Is there a deadline driving the sale (1031 exchange, divorce, estate, relocation)? That informs how much negotiation room exists.
- Schools are D-rated, which usually means shorter tenancies and higher turnover. Who's the typical renter profile here, and what's been the actual vacancy rate?
- Crime grade is F in this area — have there been break-ins, vandalism, or insurance claims at this property in the last 3 years? What carrier currently insures it and at what premium?
- The area grade is low — what's the realistic commute time and amenity access for the typical tenant pool here? Any planned neighborhood developments (good or bad) we should know about?
- What's the average days-on-market for RENTAL listings here right now (not sales)? A rising rental-DOM trend means longer vacancies and softer asking-rent achievability than the comps imply.
- What's the recent tenant-quality profile in this submarket — average credit score on applications, eviction rate, late-payment / NSF rate, and stable-employment percentage? A property-management company in the area should have these aggregated.
- How much new for-sale + rental construction is in the pipeline within 1–3 miles? Heavy new supply typically softens prices + rents 12–24 months out; constrained supply supports both.
Investment metrics
- 1% rule
- 0.90% ✗
- Cap rate
- 5.45%
- Cash-on-cash
- -3.02%
- DSCR
- 0.87
- GRM
- 9.2
CMA / ARV
- ARV (median comp)
- $389,279
- List price
- $279,900
- Delta
- -28.10%
- Verdict
- UNDERPRICED
- Comps
- 20 within 1.0 mi
Show comp detail 12 sales within ~0.75 mi
| Address | Dist | Beds/Ba | Sqft | Sold | Price | $/sf | Match |
|---|---|---|---|---|---|---|---|
| 812 Colby Ave | 0.00mi | 3/1.5 | 1,516 (0%) | 1mo | $289,000 | $191 | 100 |
| 830 Drexel Ave | 0.16mi | 3/2.0 | 1,516 (0%) | 2mo | $429,000 | $283 | 89 |
| 811 Fordham St | 0.17mi | 3/1.5 | 1,516 (0%) | 7mo | $367,500 | $242 | 87 |
| 740 Baylor Ave | 0.15mi | 3/1.5 | 1,516 (0%) | 8mo | $390,000 | $257 | 86 |
| 809 Colby Ave | 0.05mi | 3/1.5 | 1,556 (+3%) | 9mo | $386,500 | $248 | 86 |
| 328 Ithaca Ave | 0.45mi | 3/2.0 | 1,516 (0%) | 8mo | $399,900 | $264 | 71 |
| 517 8th St | 0.34mi | 3/1.5 | 1,612 (+6%) | 10mo | $390,000 | $242 | 65 |
| 602 Rancocas Ave | 0.34mi | 3/2.0 | 1,398 (-8%) | 10mo | $373,000 | $267 | 61 |
| 804 S Fairview St S | 0.68mi | 3/1.5 | 1,592 (+5%) | 2mo | $375,000 | $236 | 59 |
| 412 Lippincott Ave | 0.51mi | 3/1.5 | 1,365 (-10%) | 2mo | $340,000 | $249 | 58 |
| 404 Greenwood Ave | 0.49mi | 4/1.5 (+1) | 1,316 (-13%) | 5mo | $360,000 | $274 | 46 |
| 315 Rancocas Ave | 0.61mi | 4/2.0 (+1) | 1,315 (-13%) | 2mo | $290,000 | $221 | 40 |
Match score weights: distance 35% · size 25% · config 20% · recency 20%. Top-matched comps best support the ARV.
Projected returns pro-forma
-3.0% appreciation · 3.0% rent growth · sell at horizon
- IRR
- -21.2%
- Equity multiple
- 0.26×
- Total profit
- $-57,734
- Equity at exit
- $41,734
- IRR
- -14.6%
- Equity multiple
- 0.16×
- Total profit
- $-65,666
- Equity at exit
- $24,201
Cash invested: $78,372 (down + closing). Projections, not guarantees.
Monthly cashflow live
- Estimated rent
- $2,525 high interval (Pro) →
- Mortgage (P&I)
- −$1,468
- Tax from tax record
- −$608 /mo · $7,293/yr
- Insurance
- −$117
- HOA
- −$0
- Vacancy / Maint / Mgmt
- −$530
- Net cashflow
- $-197
Break-even live
Sensitivity live
| Price | -10% $-39 | -5% $-118 | +0% $-197 | +5% $-277 | +10% $-356 |
|---|---|---|---|---|---|
| Rent | -10% $-397 | -5% $-297 | +0% $-197 | +5% $-98 | +10% $2 |
| Rate | -1.0pp $-56 | -0.5pp $-126 | base $-197 | +0.5pp $-270 | +1.0pp $-344 |
UW: 25.0% down · 7.5% · 30yr · 1.5% tax · 5.0% vac · 8.0% maint · 8.0% mgmt
Financing live
Cash to close
- Down payment
- $69,975
- Closing costs
- $8,397
- Reserves months
- —
- Total cash needed
- —
Loan-product check · same deal, 3 products live
Conventional
25% down · 7.5% · 30yr
- Down + closing
- —
- Monthly P&I
- —
- Monthly cashflow
- —
- DSCR
- —
- Eligible?
- —
Personal DTI + credit; lowest rate.
DSCR
20% down · 8.5% · 30yr
- Down + closing
- —
- Monthly P&I
- —
- Monthly cashflow
- —
- DSCR
- —
- Eligible?
- —
No personal income docs; deal must DSCR.
Hard money
10% down · 12.0% · 12mo
- Down + closing
- —
- Monthly P&I
- —
- Monthly cashflow
- —
- DSCR
- —
- Eligible?
- —
Short-term bridge; refi at stabilization.
Rent comps 7 comps
| Address | Beds | Baths | Sqft | Rent | $/sqft | DOM | Units | Dist |
|---|---|---|---|---|---|---|---|---|
| 1901 Underwood Blvd Delran, NJ | 1.0–2.0 | 1.0–2.0 | 942 | $2,450 | $2.60 | 0d | 1 | 0.44mi |
| 3001 Route 130 Delran, NJ | 1.0–2.0 | 1.0–2.5 | 1152 | $2,400 | $2.08 | 6d | 1 | 0.60mi |
| 136 Webster St Riverside, NJ | 4.0 | 1.0 | 1280 | $2,700 | $2.11 | 21d | 1 | 1.04mi |
| 424 Kossuth St Riverside, NJ | 3.0 | 1.0 | 1175 | $2,250 | $1.91 | 45d | 1 | 1.13mi |
| 319 Taylor St Riverside, NJ | 3.0 | 1.0 | 1722 | $2,600 | $1.51 | 12d | 1 | 1.20mi |
| 13 Polk St Riverside, NJ | 2.0 | 2.0 | 1080 | $2,000 | $1.85 | 23d | 1 | 1.28mi |
| 2211 New Albany Rd Cinnaminson, NJ | 4.0 | 2.5 | 2130 | $3,600 | $1.69 | 5d | 1 | 1.48mi |
Listing history 4 events
-
2026-05-18$279,900 Active 687-char remark
-
2026-05-15historical $279,900 687-char remark
-
1993-06-12soldstatus $117,000
-
1983-02-01soldstatus $56,000
ⓘ Source: listings_history table (triggers on properties + properties_extension) + one-shot
backfill from property_details.listing_events for pre-trigger history.
Tax reassessment forecast PA · Partial reset (capped growth)
- Current annual tax
- $7,293 · $608/mo
- Projected year-2 tax
- $7,293 · $608/mo
- Expected delta
- $0/yr ($0/mo · 0.0%)
ⓘ Screening estimate from a state-policy table — verify with the county assessor before closing.
Climate risk First Street
- Flood 1/10 Low FEMA zone X (unshaded) · 0% chance over 30 yrs
- Wildfire 1/10 Low
- Heat 7/10 Severe 7 d/yr ≥104°F today · 15 d/yr by 30 yrs out
- Wind 6/10 Major 36% chance of damaging wind over 30 yrs
- Air quality 4/10 Moderate 5 unhealthy d/yr today · 7 by 30 yrs out
Nearby sold comps map
Loading sold comps map…
Walkable amenities ~0.75 mi
Loading nearby amenities…
Taxation est. · year 1
- Rental income
- $30,300
- − Mortgage interest
- −$15,679
- − Property taxes
- −$7,293
- − Insurance
- −$1,400
- − Repairs & maintenance
- −$2,424
- − Management
- −$2,424
- − Depreciation
- −$8,143
- Taxable loss
- −$7,062
- Est. tax savings @ 24.0%
- +$1,695
- After-tax cash flow
- $-674/yr
For passive investors: Depreciation is non-cash, so a rental often shows a tax loss while cash-flowing — sheltering income. Rental losses are passive: they offset passive income freely, and up to $25,000/yr can offset ordinary (W-2) income if you actively participate and your MAGI is under $100k (phasing out to $0 by $150k); unused losses carry forward. On sale, claimed depreciation is recaptured at up to 25%, and gains may owe capital-gains tax (a 1031 exchange can defer both). Figures are a year-1 estimate at your 24.0% rate — not tax advice; consult a CPA.
Schools (NCES district)
- District
- Delran Township School District
- NCES district ID
- 3403780
- Math proficiency
- 22% ▼ -16.00%
- Reading proficiency
- 49% ▼ -2.00%
- Median HH income
- $83,417
- Composite
- 33.85/100
- National rank
- #5354
- State rank
- #251 of 472 in NJ
Livability — Philadelphia
- Score
- 77/100
- State rank
- #348
- US rank
- #3054
Category grades
Schools grade is shown separately in the Schools card above.
Census & demographics
- County
- Burlington County
- City population
- 1,559,001
- Metro
- Philadelphia-Camden-Wilmington, PA-NJ-DE-MD
- Population (ZIP)
- 30,615
- Household income
- $94,407
- Rent vs Own
- Severe rent burden
- 1103.0
Population outlook (Burlington County) Hauer SSP2
- Today (2025)
- 453,425 people
- By 2030
- 452,359 · -0.2%
- By 2040
- 445,033 · -1.9%
- By 2050
- 431,760 · -4.8%
- By 2075
- 406,277 · -10.4%
- By 2100
- 364,732 · -19.6%
Race, ethnicity, and origin ACS 2023
- Neighborhood character
- Predominantly White (70%)
- Race & ethnicity
- White 70% Black 10% Hispanic / Latino 9% Two or more races 9% Asian 3%
- Hispanic origin (detail)
- Puerto Rican 3%
- Common ancestry
- Romanian 8% Estonian 3% Russian 2%
- Foreign-born
- 13% · Canada, China
- Languages at home
- 82% English-only · Other Indo-European 8% Spanish 6% Other Asian/Pacific 2%
Political lean MEDSL · Burlington
- 2024 margin
- D (+16.6) · D 57.6% · R 41.0% · Other 1.3%
- 2008→2024 swing
- -2.0pp toward R · 2008: 18.6pp · 2024: 16.6pp
- All cycles
- 2024: D+16.6 2020: D+19.5 2016: D+14.8 2012: D+18.7 2008: D+18.6
Not yet ingested
- Civics
- —
Market trends
- HPI YoY
- ▼ -396.76%
- Current HPI
- 281.8091
- Rent YoY
- —
- Metro
- Philadelphia-Camden-Wilmington, PA-NJ-DE-MD
- State GDP YoY
- ▲ 1.68%
- F500 in state
- 34
Industry mix (Fortune 500 HQ in PA)
| Industry | F500 HQs | Revenue |
|---|---|---|
| Healthcare | 2 | $309B |
|
||
| Insurance | 2 | $27B |
|
||
| Telecommunications / Media | 1 | $124B |
|
||
| Industrial Distribution | 1 | $22B |
|
||
| Financial Services | 1 | $20B |
|
||
| Chemicals / Materials | 1 | $18B |
|
||
Price history
+416.1% since first listed6 events — show timeline
- 2026-06-04 Sold (MLS) $289,000 BRIGHT MLS
- 2026-05-27 Pending — BRIGHT MLS
- 2026-05-18 Listed $279,900 BRIGHT MLS
- 2026-05-15 Coming Soon $279,900 BRIGHT MLS
- 1993-06-12 Sold (Public Records) $117,000 Public Records
- 1983-02-01 Sold (Public Records) $56,000 Public Records
Property tax history
+1.6%/yrLatest (2025): $7,293 · +0.7% YoY. Source: county tax records.
Cash-flow waterfall
monthlySold comps — $/sqft
last 12 mo · ≤1 miLoading sold comps…