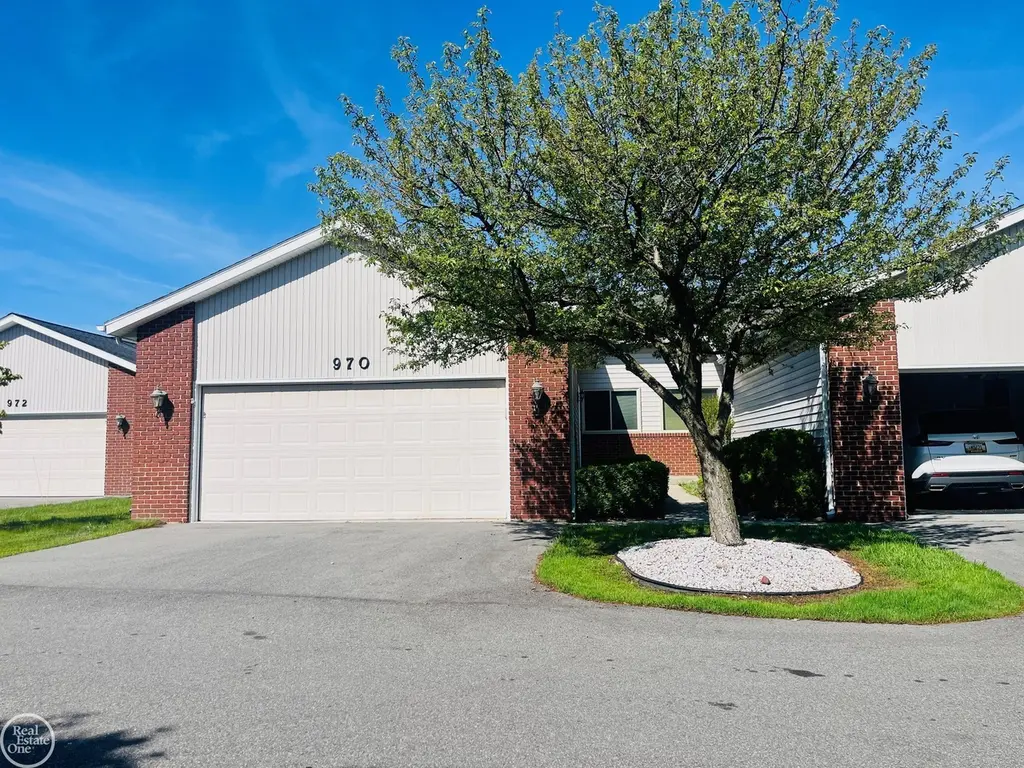
970 St Joseph Ln · Marysville, MI
Flood risk 4/10 · Minor
- FEMA flood zone
- X (unshaded)
- Chance of flooding over 30 yrs
- 0.23%
- Est. flood insurance / yr
- $507 – $1,088
Fire risk 1/10 · Minimal
- Est. fire insurance / yr
- $784 – $1,456
Heat risk 3/10 · Minor
- Hot days now (above 99°F)
- 7 days/yr
- Hot days in 30 yrs
- 14 days/yr
Wind risk 1/10 · Minimal
- Chance of severe wind over 30 yrs
- —
Air-quality risk 3/10 · Minor
- Unhealthy air days now
- 2 days/yr
- Unhealthy air days in 30 yrs
- 3 days/yr
Risk factors via First Street. Map © Google.
Why this score? — see what drove the F grade
The composite is a weighted blend of 9 inputs, each scored 0–100. Each bar is that input's sub-score; the figure is the points it added to the 100-point composite (weight × sub-score).
- ARV discount +7.5/15.0
- Cash flow +4.5/30.0
- Schools +4.2/10.0
- Livability +3.9/5.0
- Rent growth +2.5/5.0
- Condition / age +2.5/5.0
- 1% rule +1.0/10.0
- DSCR +0.0/10.0
- Appreciation +0.0/10.0
$239,900
🖨 Deal sheet (PDF) 📄 Offer letter ✓ Due diligence
Listing remarks
* * OPEN HOUSE on Sunday, 5-31-26, from 3pm - 4:30pm * * Welcome home to 970 St Joseph, this unit is located in the highly desirable Marysville Manor and is priced to sell! This is an estate sale and the unit will require some TLC including paint and flooring. Open concept throughout offering 1380 sq feet, 2 bedrooms and 2 full baths on the main floor including laundry. The primary bedroom has an en-suite bath and a nice walk-in closest. Downstairs you will an unfinished basement with huge potential, perfect for large gatherings or storage. Priced to sell, you will not be disappointed!
Key facts
- $180 HOA
- 2 garage spots
- Built 1994
Property features AI
Finance
- Other: Pets allowed (contact for restrictions); Zoned residential
- HOA & community: Marysville Manor Condominium Association; Monthly association fee of $180; Association contact available
Exterior
- Parking: Attached garage with 2 parking spaces
- Utilities: Public water; Public sanitary sewer; Natural gas service; Electric service (standard)
- Home design: Condominium; One-story structure; Built in 1994
- Construction: Poured foundation; Basement
- Exterior features: Brick and vinyl siding exterior; Pond on the property; Road frontage
Interior
- Kitchen: Kitchen on the main level (9 x 16)
- Bedrooms: Two bedrooms on the main level — primary 13 x 14, second 11 x 13
- Flooring: Finished living space below grade noted
- Bathrooms: Two full bathrooms, both on the main level
- Heating & cooling: Forced air heating; Central A/C; Natural gas heat/fuel; Gas water heater
- Interior features: Primary bedroom has an attached full bathroom; Main-level living areas
- Laundry & utility: Basement present (poured foundation)
Neighborhood map
What this means for you Summary
Snapshot
- This is a 2-bed/2.0-bath condo listed at $240k.
Deal economics
- At list price, monthly cash flow is $-614 ($-7k/yr) — negative.
- To cash-flow at today's rent, offer at most $131k (45.2% below list).
- To meet the 1% rule (rent ≥ 1% of price), the offer needs to be $143k (40.2% below list).
- Recommended offer: $131k (45.2% below list) — sets the bar for cash-flow.
- Cap rate 3.2% vs local median 4.6% in Marysville — below-typical yield; the buyer is paying a premium for something (appreciation thesis, condition, location) that the cap rate doesn't capture.
Location & tenants
- Location reads 78/100 on livability (#114 in MI, #2,700 nationally) — a middle-class / working-renter tenant base. Strengths: crime A+, cost of living A+, housing A+; Watch: amenities C-, employment D+, health & safety D.
- Marysville Public Schools (suburban): math 42% / reading 53% proficiency, ranked #115 of 540 in MI (top 21%) — families likely to look elsewhere, expect single-tenant / working-renter base with shorter leases.
- Zoned schools: Marysville Middle School (math 37% / reading 46%, grade F, #192 of 493 statewide, top 39%, 616 students, 35% FRL); Marysville High School (math 42% / reading 67%, grade C-, #109 of 713 statewide, top 17%, 769 students, 30% FRL).
- Market conditions: 85 active listings in the ZIP; 232 units permitted in St. Clair County in 2024 (0 in 5+ unit buildings).
Forward outlook
- Local home prices are declining (-3.0%/yr); year-one equity from $2k of loan paydown is wiped out by about $7k of value loss. Plan a longer hold.
- St. Clair County population projected at -20% by 2050 — secular population decline; favor cash flow + early exit over multi-decade hold.
Negotiation context
- It's been on market 21 days — a 2% lower offer ($236k) is reasonable based on typical stale-listing flexibility.
- 4 sale attempts since 25y ago; this cycle's ask is 63% above the opening price — seller raised mid-cycle; expect resistance to lowballs.
- Current owner paid $145k; list at $240k implies a 66% gain — meaningful room to come down on a strong offer.
Questions for the listing agent
- What do current leases actually rent for vs. the listed asking? Can we see a recent rent roll and the last 12 months of T-12 income?
- What does the HOA fee cover, when was the last increase, and are there any pending special assessments or reserve-fund shortfalls?
- Any open or pending special assessments — roof, HVAC, plumbing, elevator, façade? What's the per-unit balance and payoff schedule, and is the seller paying it off at close or rolling it to the buyer?
- Is there a deadline driving the sale (1031 exchange, divorce, estate, relocation)? That informs how much negotiation room exists.
- Schools are B-rated — typically a magnet for longer-tenancy family renters. What's the average tenant stay here, and is there a school-zone premium baked into asking?
- The area grade is low — what's the realistic commute time and amenity access for the typical tenant pool here? Any planned neighborhood developments (good or bad) we should know about?
- What's the average days-on-market for RENTAL listings here right now (not sales)? A rising rental-DOM trend means longer vacancies and softer asking-rent achievability than the comps imply.
- What's the recent tenant-quality profile in this submarket — average credit score on applications, eviction rate, late-payment / NSF rate, and stable-employment percentage? A property-management company in the area should have these aggregated.
- How much new apartment / multifamily construction is in the pipeline within 1–3 miles? Heavy new supply (>2% of stock underway) typically softens rents 12–24 months out; light construction supports rent growth.
Investment metrics
- 1% rule
- 0.60% ✗
- Cap rate
- 3.22%
- Cash-on-cash
- -10.97%
- DSCR
- 0.51
- GRM
- 13.9
CMA / ARV
No comps found within radius.
Projected returns pro-forma
-3.0% appreciation · 3.0% rent growth · sell at horizon
- IRR
- -36.2%
- Equity multiple
- -0.16×
- Total profit
- $-77,896
- Equity at exit
- $35,770
- IRR
- -49.8%
- Equity multiple
- -0.75×
- Total profit
- $-117,865
- Equity at exit
- $20,742
Cash invested: $67,172 (down + closing). Projections, not guarantees.
Landlord ↔ Tenant lean methodology
- Overall (STATE)
- 62 Landlord-Friendly
- State Michigan
- 62 Landlord-Friendly · EVEN
- County
- — inherits STATE
- City
- — inherits STATE
ZIP-level market 48040
- Home prices YoY
- -34.4%
- Active inventory
- 85
- Price-to-rent
- 13.9×
Monthly cashflow live
- Estimated rent
- $1,435 medium interval (Pro) →
- Mortgage (P&I)
- −$1,258
- Tax from tax record
- −$209 /mo · $2,512/yr
- Insurance
- −$100
- HOA
- −$180
- Vacancy / Maint / Mgmt
- −$301
- Net cashflow
- $-614
Break-even live
Sensitivity live
| Price | -10% $-478 | -5% $-546 | +0% $-614 | +5% $-682 | +10% $-750 |
|---|---|---|---|---|---|
| Rent | -10% $-727 | -5% $-671 | +0% $-614 | +5% $-557 | +10% $-501 |
| Rate | -1.0pp $-493 | -0.5pp $-553 | base $-614 | +0.5pp $-676 | +1.0pp $-739 |
UW: 25.0% down · 7.5% · 30yr · 1.5% tax · 5.0% vac · 8.0% maint · 8.0% mgmt
Financing live
Cash to close
- Down payment
- $59,975
- Closing costs
- $7,197
- Reserves months
- —
- Total cash needed
- —
Loan-product check · same deal, 3 products live
Conventional
25% down · 7.5% · 30yr
- Down + closing
- —
- Monthly P&I
- —
- Monthly cashflow
- —
- DSCR
- —
- Eligible?
- —
Personal DTI + credit; lowest rate.
DSCR
20% down · 8.5% · 30yr
- Down + closing
- —
- Monthly P&I
- —
- Monthly cashflow
- —
- DSCR
- —
- Eligible?
- —
No personal income docs; deal must DSCR.
Hard money
10% down · 12.0% · 12mo
- Down + closing
- —
- Monthly P&I
- —
- Monthly cashflow
- —
- DSCR
- —
- Eligible?
- —
Short-term bridge; refi at stabilization.
HOA detail condo
- Monthly dues
- $180 · $2,160/yr
- Assessments
- None detected in remarks — confirm with the listing agent.
Listing history 25 events
-
2026-06-21days on market $239,900 Active 21 DOM
-
2026-06-18days on market $239,900 Active 18 DOM
-
2026-06-17days on market $239,900 Active 17 DOM
-
2026-06-16days on market $239,900 Active 16 DOM
-
2026-06-15days on market $239,900 Active 15 DOM
-
2026-06-13days on market $239,900 Active 13 DOM
-
2026-06-09days on market $239,900 Active 9 DOM
-
2026-06-08days on market $239,900 Active 8 DOM
-
2026-06-07days on market $239,900 Active 7 DOM
-
2026-06-04days on market $239,900 Active 4 DOM
-
2026-06-03days on market $239,900 Active 3 DOM
-
2026-06-02days on market $239,900 Active 2 DOM
-
2026-05-31$239,900 Active 1 DOM
-
2026-05-31statusdays on market $239,900 Active 1 DOM
-
2026-05-28historical $239,900
-
2002-10-01soldstatus $144,900
-
2002-10-01soldstatus $144,900
-
2002-08-17historical
-
2002-02-17$146,900
-
2002-02-17$146,900
-
2002-02-08soldstatus $151,000
-
2002-02-08soldstatus $151,000
-
2002-01-03historical
-
2002-01-03$151,900
-
2001-09-09$151,900
ⓘ Source: listings_history table (triggers on properties + properties_extension) + one-shot
backfill from property_details.listing_events for pre-trigger history.
Tax reassessment forecast MI · Partial reset (capped growth)
- Current annual tax
- $2,512 · $209/mo
- Projected year-2 tax
- $3,103 · $259/mo
- Expected delta
- +$591/yr (+$49/mo · 23.5%)
ⓘ Screening estimate from a state-policy table — verify with the county assessor before closing.
Climate risk First Street
- Flood 4/10 Moderate FEMA zone X (unshaded) · 23% chance over 30 yrs
- Wildfire 1/10 Low
- Heat 3/10 Moderate 7 d/yr ≥99°F today · 14 d/yr by 30 yrs out
- Wind 1/10 Low
- Air quality 3/10 Moderate 2 unhealthy d/yr today · 3 by 30 yrs out
Nearby sold comps map
Loading sold comps map…
Walkable amenities ~0.75 mi
Loading nearby amenities…
Taxation est. · year 1
- Rental income
- $17,218
- − Mortgage interest
- −$13,438
- − Property taxes
- −$2,512
- − Insurance
- −$1,200
- − Repairs & maintenance
- −$1,377
- − Management
- −$1,377
- − HOA
- −$2,160
- − Depreciation
- −$6,979
- Taxable loss
- −$11,826
- Est. tax savings @ 24.0%
- +$2,838
- After-tax cash flow
- $-4,528/yr
For passive investors: Depreciation is non-cash, so a rental often shows a tax loss while cash-flowing — sheltering income. Rental losses are passive: they offset passive income freely, and up to $25,000/yr can offset ordinary (W-2) income if you actively participate and your MAGI is under $100k (phasing out to $0 by $150k); unused losses carry forward. On sale, claimed depreciation is recaptured at up to 25%, and gains may owe capital-gains tax (a 1031 exchange can defer both). Figures are a year-1 estimate at your 24.0% rate — not tax advice; consult a CPA.
Schools (NCES district)
- District
- Marysville Public Schools
- NCES district ID
- 2623040
- Math proficiency
- 42% ▼ -14.00%
- Reading proficiency
- 53% ▼ -12.00%
- Median HH income
- $58,817
- Composite
- 41.51/100
- National rank
- #3454
- State rank
- #115 of 540 in MI
Livability — Marysville
- Score
- 78/100
- State rank
- #114
- US rank
- #2700
Category grades
Schools grade is shown separately in the Schools card above.
Census & demographics
- Census place
- Marysville, MI
- City population
- 9,942
- Population (ZIP)
- 9,942
Population outlook (St. Clair County) Hauer SSP2
- Today (2025)
- 154,587 people
- By 2030
- 150,031 · -2.9%
- By 2040
- 138,177 · -10.6%
- By 2050
- 124,390 · -19.5%
- By 2075
- 95,825 · -38.0%
- By 2100
- 68,672 · -55.6%
Race, ethnicity, and origin ACS 2023
- Neighborhood character
- Predominantly White (93%)
- Race & ethnicity
- White 93% Two or more races 3% Hispanic / Latino 1% Asian 1% Black 1%
- Common ancestry
- Romanian 11% Iranian 6% Lithuanian 5%
- Foreign-born
- 2% · Canada, Philippines
- Languages at home
- 98% English-only · Other Asian/Pacific 1%
Political lean MEDSL · St. Clair
- 2024 margin
- Solid R (+34.6) · D 32.0% · R 66.6% · Other 1.4%
- 2008→2024 swing
- -37.3pp toward R · 2008: 2.6pp · 2024: -34.6pp
- All cycles
- 2024: R+34.6 2020: R+30.2 2016: R+31.4 2012: R+7.1 2008: D+2.6
Not yet ingested
- Civics
- —
Market trends
- HPI YoY
- ▼ -98.64%
- Current HPI
- 188.3932
- Rent YoY
- —
- Metro
- —
- State GDP YoY
- ▲ 1.37%
- F500 in state
- 28
Industry mix (Fortune 500 HQ in MI)
| Industry | F500 HQs | Revenue |
|---|---|---|
| Automotive Parts | 3 | $48B |
|
||
| Automotive | 2 | $372B |
|
||
| Chemicals | 1 | $45B |
|
||
| Automotive Retail | 1 | $29B |
|
||
| Healthcare / Medical Devices | 1 | $23B |
|
||
| Automotive Technology | 1 | $20B |
|
||
Price history
+57.9% since first listed11 events — show timeline
- 2026-05-28 Coming Soon $239,900 MiRealSource-MiMLS
- 2002-10-01 Sold (MLS) $144,900 MiRealSource-MiMLS
- 2002-10-01 Sold (MLS) $144,900 REALCOMP
- 2002-08-17 Listing Removed — MiRealSource-MiMLS
- 2002-02-17 Listed $146,900 MiRealSource-MiMLS
- 2002-02-17 Listed $146,900 REALCOMP
- 2002-02-08 Sold (MLS) $151,000 REALCOMP
- 2002-02-08 Sold (MLS) $151,000 MiRealSource-MiMLS
- 2002-01-03 Listed $151,900 MiRealSource-MiMLS
- 2002-01-03 Listing Removed — MiRealSource-MiMLS
- 2001-09-09 Listed $151,900 REALCOMP
Property tax history
+3.0%/yrLatest (2025): $2,512 · +4.2% YoY. Source: county tax records.
Cash-flow waterfall
monthlySold comps — $/sqft
last 12 mo · ≤1 miLoading sold comps…