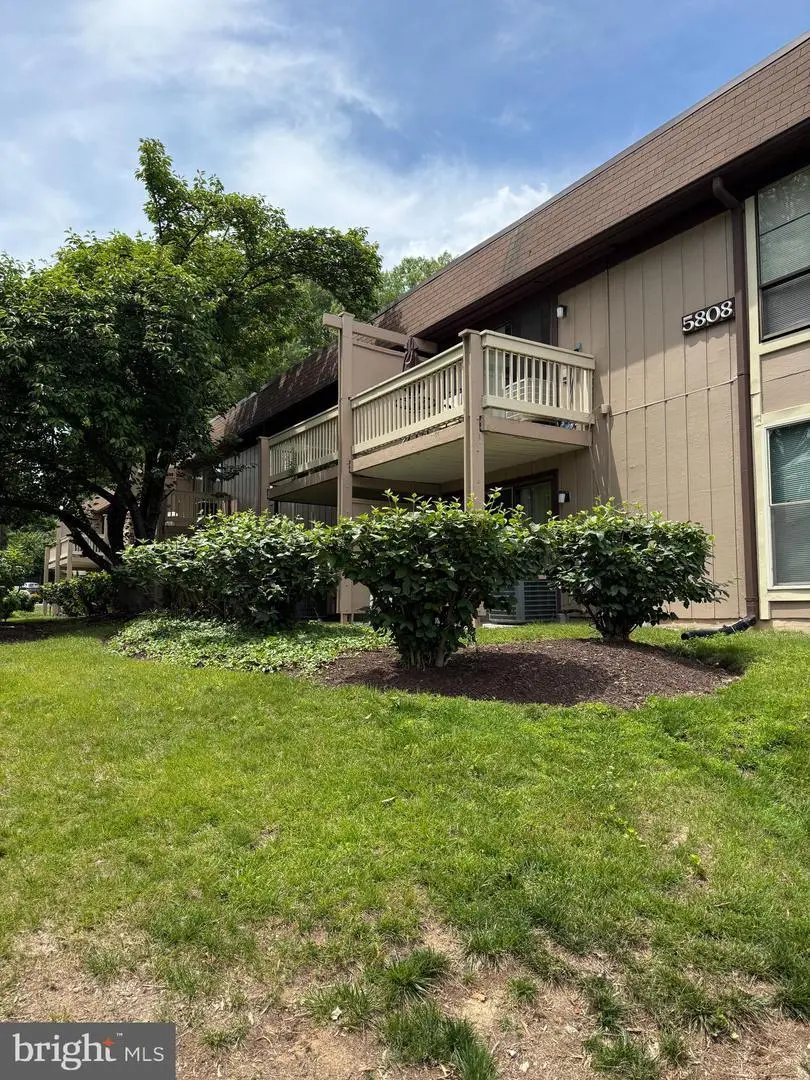
5808 Royal Ridge Dr Unit J · West Springfield, VA
Flood risk 1/10 · Minimal
- FEMA flood zone
- X (unshaded)
- Chance of flooding over 30 yrs
- 0.0%
- Est. flood insurance / yr
- $507 – $1,088
Fire risk 3/10 · Minor
- Est. fire insurance / yr
- $666 – $1,236
Heat risk 7/10 · Major
- Hot days now (above 104°F)
- 7 days/yr
- Hot days in 30 yrs
- 16 days/yr
Wind risk 4/10 · Minor
- Chance of severe wind over 30 yrs
- 16.0%
Air-quality risk 3/10 · Minor
- Unhealthy air days now
- 2 days/yr
- Unhealthy air days in 30 yrs
- 3 days/yr
Risk factors via First Street. Map © Google.
Why this score? — see what drove the C grade
The composite is a weighted blend of 9 inputs, each scored 0–100. Each bar is that input's sub-score; the figure is the points it added to the 100-point composite (weight × sub-score).
- Cash flow +19.8/30.0
- ARV discount +7.5/15.0
- 1% rule +7.0/10.0
- DSCR +6.3/10.0
- Schools +6.3/10.0
- Livability +3.8/5.0
- Rent growth +3.0/5.0
- Condition / age +2.5/5.0
- Appreciation +0.0/10.0
$175,000
🖨 Deal sheet 📄 Offer letter ✓ Due diligence
Listing remarks MLS
GREAT VALUE AT THE REDUCED PRICE OF $198,900!!! VERY NICE 1 BR, 1 BA CONDO IN TIVOLI. 2ND FLOOR UNIT. FRESH PAINT. NEWER CARPETS AND APPLIANCES. STACKABLE WASHER/DRYER IN UNIT CONVEYS. PLENTY OF PARKING. Spend the summer enjoying tennis courts, pool and club house. Close to shopping, VRE, Accotink Lake and Park! PUBLIC OPEN HOUSE JUNE 10 1-4PM
Key facts
- Community pool
- Private balcony
- Tennis courts
Tags
Property features AI
Finance
- HOA & community: Monthly condo fee of $257; Condo fee covers common area maintenance, exterior building maintenance, and reserve funds; Community amenities include outdoor pool, recreational center, tot lots/playground, tennis courts, and common grounds
Exterior
- Parking: Unassigned parking; Other parking type
- Utilities: Public water; Public sewer; Electric power
- Home design: Condominium unit in a garden-style building (1–4 stories); Unit/Flat; Entry on the 2nd floor
- Construction: Combination construction materials; TIVOLI CONDO building; Above grade and below grade structures; Pets allowed on a case-by-case basis
- Exterior features: No tidal or waterfront; Common grounds
Interior
- Kitchen: Dishwasher; Garbage disposal; Refrigerator; Stove
- Bedrooms: One bedroom on the main level
- Flooring: Carpet
- Bathrooms: One full bathroom on the main level
- Heating & cooling: Forced air heating (electric); Central air conditioning (electric); Electric hot water
- Interior features: Washer and dryer in unit or hookups available; Dishwasher; Garbage disposal; Refrigerator; Stove
- Laundry & utility: Washer and dryer in unit or hookups available
Neighborhood map
What this means for you Summary
Snapshot
- This is a 1-bed/1.0-bath condo listed at $175k.
Deal economics
- At list price, monthly cash flow is $207 ($2k/yr) — positive.
- The deal already cash-flows at list — no discount required.
- Meets the 1% rule at list price ($2k rent vs $175k).
- Cap rate 7.7% vs local median 3.0% in West Springfield — top-decile yield for the area; either an underpriced asset or a hidden risk that comps aren't pricing in. Stress-test before assuming the spread holds.
Location & tenants
- Location reads 75/100 on livability (#125 in VA, #4,050 nationally) — a middle-class / working-renter tenant base. Strengths: crime A+, employment A+, housing A+; Watch: health & safety C-, amenities D-, commute F.
- Fairfax County Public School District (suburban): math 61% / reading 73% proficiency, ranked #13 of 131 in VA (top 10%) — acceptable for families but not a draw, mixed tenant base, ~2y average lease.
- Zoned schools: West Springfield High (math 76% / reading 77%, grade A-, #99 of 319 statewide, top 31%, 2,663 students, 17% FRL) — zoned schools at 17% FRL track the district average.
- Market conditions: Rents rising (+1.9%/yr); 92 active listings in the ZIP; 2 comparable units currently listed for rent nearby; high-income renter base; 2,861 units permitted in Fairfax County in 2024 (1,829 in 5+ unit buildings).
- This rent is only 15% of the median local income ($166k/yr) — well below the 30% rent-burden line; pricing power to push rent on renewal without tenant pushback.
Forward outlook
- Local home prices are declining (-3.0%/yr); year-one equity from $1k of loan paydown is wiped out by about $5k of value loss. Plan a longer hold.
- Fairfax County population projected at +13% by 2050 — modest demand growth; plan on rents tracking national, not racing it.
Negotiation context
- Only 8 days on market — expect competitive offers; lowballing is unlikely to land.
- 4 sale attempts since 23y ago with the ask held roughly flat each time — persistent listings suggest the price (not the market) is what's stuck; bring a comps-based counter.
Risks & watch-outs
- Climate carrying-cost: extreme-heat days projected 7→16/yr by 2055 (HVAC capex compounding) — expect insurance premiums to compound above CPI over the hold.
Questions for the listing agent
- Built in 1974 — when were the roof, HVAC, electrical panel, plumbing, and water heater last replaced?
- What does the HOA fee cover, when was the last increase, and are there any pending special assessments or reserve-fund shortfalls?
- Any open or pending special assessments — roof, HVAC, plumbing, elevator, façade? What's the per-unit balance and payoff schedule, and is the seller paying it off at close or rolling it to the buyer?
- Is there a deadline driving the sale (1031 exchange, divorce, estate, relocation)? That informs how much negotiation room exists.
- Schools are A-rated — typically a magnet for longer-tenancy family renters. What's the average tenant stay here, and is there a school-zone premium baked into asking?
- What's the average days-on-market for RENTAL listings here right now (not sales)? A rising rental-DOM trend means longer vacancies and softer asking-rent achievability than the comps imply.
- What's the recent tenant-quality profile in this submarket — average credit score on applications, eviction rate, late-payment / NSF rate, and stable-employment percentage? A property-management company in the area should have these aggregated.
- How much new apartment / multifamily construction is in the pipeline within 1–3 miles? Heavy new supply (>2% of stock underway) typically softens rents 12–24 months out; light construction supports rent growth.
Investment metrics
- 1% rule
- 1.20% ✓
- Cap rate
- 7.71%
- Cash-on-cash
- 5.08%
- DSCR
- 1.23
- GRM
- 6.9
CMA / ARV
No comps found within radius.
Projected returns pro-forma
-3.0% appreciation · 1.87% rent growth · sell at horizon
- IRR
- -9.8%
- Equity multiple
- 0.65×
- Total profit
- $-17,330
- Equity at exit
- $26,093
- IRR
- -2.2%
- Equity multiple
- 0.86×
- Total profit
- $-6,822
- Equity at exit
- $15,131
Cash invested: $49,000 (down + closing). Projections, not guarantees.
Landlord ↔ Tenant lean methodology
- Overall (STATE)
- 55 Moderately Landlord-Leaning
- State Virginia
- 55 Moderately Landlord-Leaning · D+2
- County
- — inherits STATE
- City
- — inherits STATE
ZIP-level market 22152
- Rents YoY
- 1.9%
- Active inventory
- 92
- Price-to-rent
- 6.9×
Monthly cashflow live
- Estimated rent
- $2,101 medium interval (Pro) →
- Mortgage (P&I)
- −$918
- Tax from tax record
- −$204 /mo · $2,454/yr
- Insurance
- −$73
- HOA
- −$257
- Vacancy / Maint / Mgmt
- −$441
- Net cashflow
- $207
Break-even live
UW: 25.0% down · 7.5% · 30yr · 1.5% tax · 5.0% vac · 8.0% maint · 8.0% mgmt
Financing live
Cash to close
- Down payment
- $43,750
- Closing costs
- $5,250
- Reserves months
- —
- Total cash needed
- —
Loan-product check · same deal, 3 products live
Conventional
25% down · 7.5% · 30yr
- Down + closing
- —
- Monthly P&I
- —
- Monthly cashflow
- —
- DSCR
- —
- Eligible?
- —
Personal DTI + credit; lowest rate.
DSCR
20% down · 8.5% · 30yr
- Down + closing
- —
- Monthly P&I
- —
- Monthly cashflow
- —
- DSCR
- —
- Eligible?
- —
No personal income docs; deal must DSCR.
Hard money
10% down · 12.0% · 12mo
- Down + closing
- —
- Monthly P&I
- —
- Monthly cashflow
- —
- DSCR
- —
- Eligible?
- —
Short-term bridge; refi at stabilization.
Rent comps 2 comps
| Address | Beds | Baths | Sqft | Rent | $/sqft | DOM | Units | Dist |
|---|---|---|---|---|---|---|---|---|
| 5903 Kingsford Rd Springfield, VA | 1.0 | 1.0 | 676 | $1,750 | $2.59 | 18d | 1 | 0.44mi |
| 8525 Burling Wood Dr Springfield, VA | 1.0–3.0 | 1.0–2.0 | 967 | $1,905 | $1.97 | 1d | 16 | 1.16mi |
HOA detail condo
- Monthly dues
- $257 · $3,084/yr
- Likely covers
- pool
- Assessments
- None detected in remarks — confirm with the listing agent.
Listing history 6 events
-
2026-06-13statusdays on market $175,000 Pending 8 DOM
-
2026-06-09days on market $175,000 Active 6 DOM
-
2026-06-08days on market $175,000 Active 5 DOM
-
2026-06-07days on market $175,000 Active 4 DOM
-
2026-06-04remarks 699-char remark
-
2026-06-04$175,000 Active 1 DOM
ⓘ Source: listings_history table (triggers on properties + properties_extension) + one-shot
backfill from property_details.listing_events for pre-trigger history.
Tax reassessment forecast VA · Resets to sale price
- Current annual tax
- $2,454 · $204/mo
- Projected year-2 tax
- $2,454 · $204/mo
- Expected delta
- $0/yr ($0/mo · 0.0%)
ⓘ Screening estimate from a state-policy table — verify with the county assessor before closing.
Climate risk First Street
- Flood 1/10 Low FEMA zone X (unshaded) · 0% chance over 30 yrs
- Wildfire 3/10 Moderate
- Heat 7/10 Severe 7 d/yr ≥104°F today · 16 d/yr by 30 yrs out
- Wind 4/10 Moderate 16% chance of damaging wind over 30 yrs
- Air quality 3/10 Moderate 2 unhealthy d/yr today · 3 by 30 yrs out
Nearby sold comps map
Loading sold comps map…
Walkable amenities ~0.75 mi
Loading nearby amenities…
Taxation est. · year 1
- Rental income
- $25,208
- − Mortgage interest
- −$9,803
- − Property taxes
- −$2,454
- − Insurance
- −$875
- − Repairs & maintenance
- −$2,017
- − Management
- −$2,017
- − HOA
- −$3,084
- − Depreciation
- −$5,091
- Taxable loss
- −$132
- Est. tax savings @ 24.0%
- +$32
- After-tax cash flow
- $2,520/yr
For passive investors: Depreciation is non-cash, so a rental often shows a tax loss while cash-flowing — sheltering income. Rental losses are passive: they offset passive income freely, and up to $25,000/yr can offset ordinary (W-2) income if you actively participate and your MAGI is under $100k (phasing out to $0 by $150k); unused losses carry forward. On sale, claimed depreciation is recaptured at up to 25%, and gains may owe capital-gains tax (a 1031 exchange can defer both). Figures are a year-1 estimate at your 24.0% rate — not tax advice; consult a CPA.
Schools (NCES district)
- District
- Fairfax County Public School District
- NCES district ID
- 5101260
- Math proficiency
- 61% ▼ -24.00%
- Reading proficiency
- 73% ▼ -8.00%
- Median HH income
- $110,238
- Composite
- 62.59/100
- National rank
- #679
- State rank
- #13 of 131 in VA
Livability — West Springfield
- Score
- 75/100
- State rank
- #125
- US rank
- #4050
Category grades
Schools grade is shown separately in the Schools card above.
Census & demographics
- Census place
- West Springfield, VA
- County
- Fairfax County · 1,104,456 people
- City population
- 29,066
- Metro
- Washington-Arlington-Alexandria, DC-VA-MD-WV
- Population (ZIP)
- 28,814
- Household income
- $165,906
- Rent vs Own
- Severe rent burden
- 263.0
Population outlook (Fairfax County) Hauer SSP2
- Today (2025)
- 1,237,259 people
- By 2030
- 1,277,758 · +3.3%
- By 2040
- 1,346,508 · +8.8%
- By 2050
- 1,397,919 · +13.0%
- By 2075
- 1,493,100 · +20.7%
- By 2100
- 1,465,712 · +18.5%
Race, ethnicity, and origin ACS 2023
- Neighborhood character
- Diverse neighborhood (Simpson 0.70)
- Race & ethnicity
- White 48% Hispanic / Latino 19% Asian 16% Two or more races 13% Black 11%
- Hispanic origin (detail)
- Mexican 3% Puerto Rican 2%
- Common ancestry
- Romanian 3% Italian 2% Lithuanian 1%
- Foreign-born
- 27% · Canada, South Korea, Jamaica
- Languages at home
- 61% English-only · Spanish 16% Other Indo-European 7% Korean 3%
Political lean MEDSL · Fairfax
- 2024 margin
- Solid D (+35.0) · D 66.1% · R 31.1% · Other 2.8%
- 2008→2024 swing
- +13.8pp toward D · 2008: 21.2pp · 2024: 35.0pp
- All cycles
- 2024: D+35.0 2020: D+41.9 2016: D+36.2 2012: D+19.8 2008: D+21.2
Not yet ingested
- Civics
- —
Market trends
- HPI YoY
- ▼ -340.12%
- Current HPI
- 355.9566
- Rent YoY
- ▲ 1.87%
- Metro
- Washington-Arlington-Alexandria, DC-VA-MD-WV
- State GDP YoY
- ▲ 2.40%
- F500 in state
- 50
Industry mix (Fortune 500 HQ in VA)
| Industry | F500 HQs | Revenue |
|---|---|---|
| Aerospace / Defense | 4 | $236B |
|
||
| Technology / Defense | 3 | $32B |
|
||
| Financial Services | 2 | $176B |
|
||
| Utilities | 2 | $27B |
|
||
| Insurance | 2 | $25B |
|
||
| Technology | 2 | $15B |
|
||
Price history
+204.3% since first listed15 events — show timeline
- 2026-06-03 Listed $175,000 BRIGHT MLS
- 2025-11-26 Listing Removed — BRIGHT MLS
- 2025-11-20 Coming Soon — BRIGHT MLS
- 2007-08-20 Sold (Public Records) $194,000 Public Records
- 2007-08-17 Sold (MLS) $194,000 MRIS
- 2007-07-17 Delisted — MRIS
- 2007-04-24 Listed $198,900 MRIS
- 2007-01-01 Delisted — MRIS
- 2006-10-20 Listed — MRIS
- 2003-12-08 Sold (Public Records) $113,000 Public Records
- 2003-09-22 Sold (Public Records) $100,000 Public Records
- 2003-09-16 Sold (MLS) $100,000 MRIS
- 2003-09-08 Delisted — MRIS
- 2003-09-05 Listed $100,000 MRIS
- 1991-06-28 Sold (Public Records) $57,500 Public Records
Property tax history
+2.7%/yrLatest (2025): $2,454 · +6.8% YoY. Source: county tax records.
Cash-flow waterfall
monthlySold comps — $/sqft
last 12 mo · ≤1 miLoading sold comps…