 Multi-family
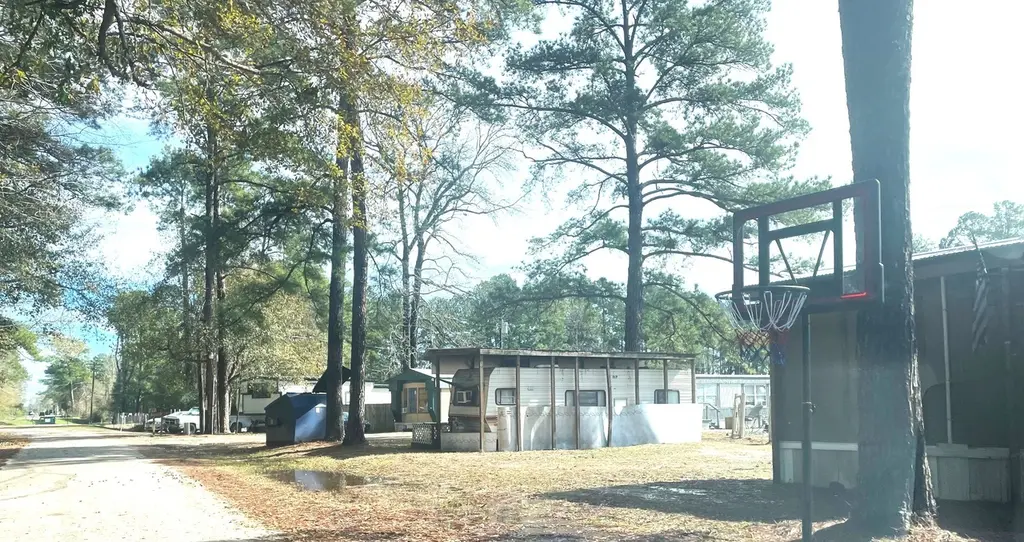
31 County Road 386 Off Fm 1725 · Cleveland, TX
Flood risk No data
- FEMA flood zone
- —
- Chance of flooding over 30 yrs
- —
- Est. flood insurance / yr
- —
Fire risk No data
- Est. fire insurance / yr
- —
Heat risk No data
- Hot days now (above threshold)
- —
- Hot days in 30 yrs
- —
Wind risk No data
- Chance of severe wind over 30 yrs
- —
Air-quality risk No data
- Unhealthy air days now
- —
- Unhealthy air days in 30 yrs
- —
Risk factors via First Street. Map © Google.
Why this score? — see what drove the B- grade
The composite is a weighted blend of 9 inputs, each scored 0–100. Each bar is that input's sub-score; the figure is the points it added to the 100-point composite (weight × sub-score).
- Cash flow +30.0/30.0
- DSCR +10.0/10.0
- 1% rule +9.0/10.0
- ARV discount +7.5/15.0
- Rent growth +3.5/5.0
- Livability +3.1/5.0
- Condition / age +2.2/5.0
- Schools +2.1/10.0
- Appreciation +0.0/10.0
$1,295,000
🖨 Deal sheet 📄 Offer letter ✓ Due diligence
Multi-family units
County records classify this as Multi-Family (2-4 Unit). Listing-text estimate: 1 unit. estimate disagrees with records
Listing remarks MLS
14 Units, Trailer, RV Home Park in Cleveland, Texas. 2.96 Acre Park with Pond presents an exceptional investment opportunity. Property has a recently improved Water Well and an Aerobic Septic System that cleans itself. This property is not in a flood zone. Property aims to expand its revenue streams beyond traditional accommodation by adding more rental spaces. This is a great Location of FM 1725, 30 minutes from Casinos, close to Lake Livingston and easy access to Hwy 59 - I-69!
Key facts
- 2.96 acre lot
- Built 1970
- Listed 861 days
Neighborhood map
What this means for you Summary
Snapshot
- This is a 3-bed/2.0-bath multifamily listed at $1.29M. Condition is rated fair.
Deal economics
- At list price, monthly cash flow is $5k ($64k/yr) — positive.
- The deal already cash-flows at list — no discount required.
- Meets the 1% rule at list price ($18k rent vs $1.29M).
- Recommended offer: $1.14M (12.0% below list) — sets the bar for market timing.
- Cap rate 11.3% vs local median 4.7% in Cleveland — top-decile yield for the area; either an underpriced asset or a hidden risk that comps aren't pricing in. Stress-test before assuming the spread holds.
Location & tenants
- Location reads 61/100 on livability (#1,013 in TX) — a middle-class / working-renter tenant base. Strengths: cost of living A+, housing A+; Watch: schools F, crime D-, amenities F.
- Cleveland ISD (town): math 24% / reading 25% proficiency, ranked #723 of 826 in TX (top 88%) — low school quality limits family demand, transient renter base, plan for 1-2y turnover; 71% free/reduced lunch — lower-income household profile, screen leases tightly.
- Market conditions: Rents rising fast (+4.0%/yr); 1574 active listings in the ZIP; 1,321 units permitted in Liberty County in 2024 (0 in 5+ unit buildings).
- At $18,103/mo this rent would consume 349% of the median local household income ($62k/yr) (locally 437% of renters already pay >50% of income on rent) — very limited rent-growth headroom before tenants either downsize or default.
Forward outlook
- Local home prices are declining (-3.0%/yr); year-one equity from $9k of loan paydown is wiped out by about $39k of value loss. Plan a longer hold.
- Liberty County population projected at +24% by 2050 — long-run rental-demand tailwind backs the buy-and-hold thesis.
- At projected returns (-3.0% appreciation + 4.0% rent growth), your $363k cash investment doubles in ~7 years — after that, you're playing with house money.
Negotiation context
- It's been on market 861 days — a 12% lower offer ($1.14M) is reasonable based on typical stale-listing flexibility.
- 2 sale attempts since 2y ago with the ask held roughly flat each time — persistent listings suggest the price (not the market) is what's stuck; bring a comps-based counter.
Questions for the listing agent
- It's been on market 861 days. Have you received any prior offers? Is the seller open to a 12% concession, seller financing, or rate buy-down credit?
- Have any recent inspections been done? Can we get a copy of the seller's disclosures and any deferred-maintenance estimates?
- Built in 1970 — when were the roof, HVAC, electrical panel, plumbing, and water heater last replaced?
- Why hasn't it sold? Are there any deal-killer items the seller is aware of (foundation, flood, title, zoning, code violations)?
- Is there a deadline driving the sale (1031 exchange, divorce, estate, relocation)? That informs how much negotiation room exists.
- Schools are F-rated, which usually means shorter tenancies and higher turnover. Who's the typical renter profile here, and what's been the actual vacancy rate?
- Crime grade is D in this area — have there been break-ins, vandalism, or insurance claims at this property in the last 3 years? What carrier currently insures it and at what premium?
- What's the average days-on-market for RENTAL listings here right now (not sales)? A rising rental-DOM trend means longer vacancies and softer asking-rent achievability than the comps imply.
- What's the recent tenant-quality profile in this submarket — average credit score on applications, eviction rate, late-payment / NSF rate, and stable-employment percentage? A property-management company in the area should have these aggregated.
- How much new apartment / multifamily construction is in the pipeline within 1–3 miles? Heavy new supply (>2% of stock underway) typically softens rents 12–24 months out; light construction supports rent growth.
Investment metrics
- 1% rule
- 1.40% ✓
- Cap rate
- 11.25%
- Cash-on-cash
- 17.71%
- DSCR
- 1.79
- GRM
- 6.0
CMA / ARV
No comps found within radius.
Projected returns pro-forma
-3.0% appreciation · 4.0% rent growth · sell at horizon
- IRR
- 10.3%
- Equity multiple
- 1.41×
- Total profit
- $149,689
- Equity at exit
- $193,089
- IRR
- 20.2%
- Equity multiple
- 2.79×
- Total profit
- $647,413
- Equity at exit
- $111,968
Cash invested: $362,600 (down + closing). Projections, not guarantees.
Landlord ↔ Tenant lean methodology
- Overall (STATE)
- 87 Strongly Landlord-Friendly
- State Texas
- 87 Strongly Landlord-Friendly · R+5
- County
- — inherits STATE
- City
- — inherits STATE
ZIP-level market 77327
- Home prices YoY
- -5.2%
- Rents YoY
- 4.0%
- Active inventory
- 1574
- Price-to-rent
- 83.5×
Monthly cashflow live
- Estimated rent
- $18,103 medium interval (Pro) →
- Mortgage (P&I)
- −$6,791
- Tax est. 1.5%
- −$1,619 /mo · $19,425/yr
- Insurance
- −$540
- HOA
- −$0
- Vacancy / Maint / Mgmt
- −$3,802
- Net cashflow
- $5,352
Break-even live
14-unit breakdown (identical units grouped — click to expand)
| Units | Beds | Baths | Est. rent |
|---|---|---|---|
| 14× units | 2 | 2 | $18,102 |
| #1 | 2 | 2 | $1,293 |
| #2 | 2 | 2 | $1,293 |
| #3 | 2 | 2 | $1,293 |
| #4 | 2 | 2 | $1,293 |
| #5 | 2 | 2 | $1,293 |
| #6 | 2 | 2 | $1,293 |
| #7 | 2 | 2 | $1,293 |
| #8 | 2 | 2 | $1,293 |
| #9 | 2 | 2 | $1,293 |
| #10 | 2 | 2 | $1,293 |
| #11 | 2 | 2 | $1,293 |
| #12 | 2 | 2 | $1,293 |
| #13 | 2 | 2 | $1,293 |
| #14 | 2 | 2 | $1,293 |
| Total (14 units) | $18,103 | ||
UW: 25.0% down · 7.5% · 30yr · 1.5% tax · 5.0% vac · 8.0% maint · 8.0% mgmt
Financing live
Cash to close
- Down payment
- $323,750
- Closing costs
- $38,850
- Reserves months
- —
- Total cash needed
- —
Loan-product check · same deal, 3 products live
Conventional
25% down · 7.5% · 30yr
- Down + closing
- —
- Monthly P&I
- —
- Monthly cashflow
- —
- DSCR
- —
- Eligible?
- —
Personal DTI + credit; lowest rate.
DSCR
20% down · 8.5% · 30yr
- Down + closing
- —
- Monthly P&I
- —
- Monthly cashflow
- —
- DSCR
- —
- Eligible?
- —
No personal income docs; deal must DSCR.
Hard money
10% down · 12.0% · 12mo
- Down + closing
- —
- Monthly P&I
- —
- Monthly cashflow
- —
- DSCR
- —
- Eligible?
- —
Short-term bridge; refi at stabilization.
Listing history 16 events
-
2026-06-18days on market $1,295,000 Active 861 DOM
-
2026-06-17days on market $1,295,000 Active 860 DOM
-
2026-06-16days on market $1,295,000 Active 859 DOM
-
2026-06-15days on market $1,295,000 Active 858 DOM
-
2026-06-13days on market $1,295,000 Active 856 DOM
-
2026-06-09days on market $1,295,000 Active 852 DOM
-
2026-06-08days on market $1,295,000 Active 851 DOM
-
2026-06-07days on market $1,295,000 Active 850 DOM
-
2026-06-04days on market $1,295,000 Active 847 DOM
-
2026-06-03days on market $1,295,000 Active 846 DOM
-
2026-06-02days on market $1,295,000 Active 845 DOM
-
2026-06-01days on market $1,295,000 Active 844 DOM
-
2026-05-31days on market $1,295,000 Active 843 DOM
-
2024-06-15status Active 486-char remark
Show marketing remark (486 chars)
14 Units, Trailer, RV Home Park in Cleveland, Texas. 2.96 Acre Park with Pond presents an exceptional investment opportunity. Property has a recently improved Water Well and an Aerobic Septic System that cleans itself. This property is not in a flood zone. Property aims to expand its revenue streams beyond traditional accommodation by adding more rental spaces. This is a great Location of FM 1725, 30 minutes from Casinos, close to Lake Livingston and easy access to Hwy 59 - I-69!
-
2024-05-24historical 486-char remark
Show marketing remark (486 chars)
14 Units, Trailer, RV Home Park in Cleveland, Texas. 2.96 Acre Park with Pond presents an exceptional investment opportunity. Property has a recently improved Water Well and an Aerobic Septic System that cleans itself. This property is not in a flood zone. Property aims to expand its revenue streams beyond traditional accommodation by adding more rental spaces. This is a great Location of FM 1725, 30 minutes from Casinos, close to Lake Livingston and easy access to Hwy 59 - I-69!
-
2024-01-17$1,295,000 Active 486-char remark
Show marketing remark (486 chars)
14 Units, Trailer, RV Home Park in Cleveland, Texas. 2.96 Acre Park with Pond presents an exceptional investment opportunity. Property has a recently improved Water Well and an Aerobic Septic System that cleans itself. This property is not in a flood zone. Property aims to expand its revenue streams beyond traditional accommodation by adding more rental spaces. This is a great Location of FM 1725, 30 minutes from Casinos, close to Lake Livingston and easy access to Hwy 59 - I-69!
ⓘ Source: listings_history table (triggers on properties + properties_extension) + one-shot
backfill from property_details.listing_events for pre-trigger history.
Nearby sold comps map
Loading sold comps map…
Walkable amenities ~0.75 mi
Loading nearby amenities…
Taxation est. · year 1
- Rental income
- $217,236
- − Mortgage interest
- −$72,540
- − Property taxes
- −$19,425
- − Insurance
- −$6,475
- − Repairs & maintenance
- −$17,379
- − Management
- −$17,379
- − Depreciation
- −$37,673
- Taxable income
- $46,365
- Est. tax owed @ 24.0%
- −$11,128
- After-tax cash flow
- $53,095/yr
For passive investors: Depreciation is non-cash, so a rental often shows a tax loss while cash-flowing — sheltering income. Rental losses are passive: they offset passive income freely, and up to $25,000/yr can offset ordinary (W-2) income if you actively participate and your MAGI is under $100k (phasing out to $0 by $150k); unused losses carry forward. On sale, claimed depreciation is recaptured at up to 25%, and gains may owe capital-gains tax (a 1031 exchange can defer both). Figures are a year-1 estimate at your 24.0% rate — not tax advice; consult a CPA.
Condition & rehab AI · 7 photos
This multi-family property requires moderate renovations to improve its condition and increase its value. Repairs to the roof, flooring, and HVAC are necessary, along with painting and landscaping improvements.
Repairs flagged
- Major roof — Signs of potential leaks
- Major flooring — Worn and possibly unsafe
- Major HVAC/mechanicals — No recent maintenance
Value-add opportunities
- Both paint interior walls — Fresh paint enhances curb appeal and interior aesthetics
- Both replace flooring — New flooring improves safety and adds value
- Both service HVAC — A functional HVAC system ensures comfort and energy efficiency
Renovation cost estimate screening
| Repair item | Severity | Est. cost |
|---|---|---|
| roof · Signs of potential leaks | Major | $15,000–50,000 |
| flooring · Worn and possibly unsafe | Major | $15,000–50,000 |
| HVAC/mechanicals · No recent maintenance | Major | $15,000–50,000 |
| Total estimated repair cost · 3 items | $45,000–150,000 |
Value-add ROI direction
- Both paint interior walls — Fresh paint enhances curb appeal and interior aesthetics ↑
- Both replace flooring — New flooring improves safety and adds value ↑
- Both service HVAC — A functional HVAC system ensures comfort and energy efficiency ↑
ⓘ Cost ranges are severity-bucket heuristics (US national rule-of-thumb). Get contractor quotes + a written scope before underwriting a rehab budget.
Schools (NCES district)
- District
- Cleveland ISD
- NCES district ID
- 4814370
- Math proficiency
- 24% ▼ -13.00%
- Reading proficiency
- 25% ▼ -4.00%
- Median HH income
- $39,173
- Composite
- 20.61/100
- National rank
- #8549
- State rank
- #723 of 826 in TX
Livability — Cleveland
- Score
- 61/100
- State rank
- #1013
- US rank
- #17943
Category grades
Schools grade is shown separately in the Schools card above.
Census & demographics
- County
- Liberty County · 82,189 people
- City population
- 17,208
- Metro
- Houston-The Woodlands-Sugar Land, TX
- Population (ZIP)
- 42,685
- Household income
- $62,219
- Rent vs Own
- Severe rent burden
- 437.0
Population outlook (Liberty County) Hauer SSP2
- Today (2025)
- 87,956 people
- By 2030
- 92,161 · +4.8%
- By 2040
- 100,784 · +14.6%
- By 2050
- 109,471 · +24.5%
- By 2075
- 133,470 · +51.7%
- By 2100
- 147,372 · +67.6%
Race, ethnicity, and origin ACS 2023
- Neighborhood character
- Diverse neighborhood (Simpson 0.57)
- Race & ethnicity
- Hispanic / Latino 54% White 36% Two or more races 18% Black 8% Native American 2%
- Hispanic origin (detail)
- Mexican 42%
- Common ancestry
- Lithuanian 2% Serbian 1% Slovak 0%
- Foreign-born
- 22% · Canada
- Languages at home
- 51% English-only · Spanish 48%
Political lean MEDSL · Liberty
- 2024 margin
- Solid R (+61.6) · D 19.0% · R 80.6%
- 2008→2024 swing
- -17.9pp toward R · 2008: -43.7pp · 2024: -61.6pp
- All cycles
- 2024: R+61.6 2020: R+59.7 2016: R+58.0 2012: R+53.3 2008: R+43.7
Not yet ingested
- Civics
- —
Market trends
- HPI YoY
- ▼ -12.39%
- Current HPI
- 224.9222
- Rent YoY
- ▲ 4.00%
- Metro
- Houston-The Woodlands-Sugar Land, TX
- State GDP YoY
- ▲ 3.95%
- F500 in state
- 110
Industry mix (Fortune 500 HQ in TX)
| Industry | F500 HQs | Revenue |
|---|---|---|
| Energy | 16 | $1,198B |
|
||
| Technology | 5 | $198B |
|
||
| Engineering / Construction | 4 | $72B |
|
||
| Energy Services | 3 | $60B |
|
||
| Utilities | 3 | $41B |
|
||
| Healthcare | 2 | $330B |
|
||
Price history
3 events — show timeline
- 2024-06-15 Relisted — HARMLS
- 2024-05-24 Listing Removed — HARMLS
- 2024-01-17 Listed $1,295,000 HARMLS
Cash-flow waterfall
monthlySold comps — $/sqft
last 12 mo · ≤1 miLoading sold comps…