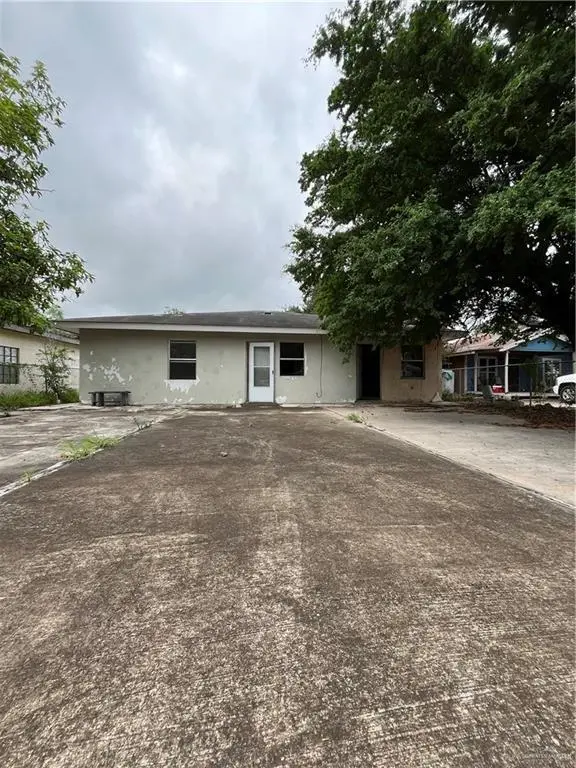
2322 E La Pointe Ave · Alton, TX
Flood risk 1/10 · Minimal
- FEMA flood zone
- —
- Chance of flooding over 30 yrs
- 0.0%
- Est. flood insurance / yr
- —
Fire risk 6/10 · Moderate
- Est. fire insurance / yr
- $1,222 – $2,270
Heat risk 9/10 · Severe
- Hot days now (above 111°F)
- 7 days/yr
- Hot days in 30 yrs
- 22 days/yr
Wind risk 8/10 · Major
- Chance of severe wind over 30 yrs
- 99.0%
Air-quality risk 2/10 · Minimal
- Unhealthy air days now
- 0 days/yr
- Unhealthy air days in 30 yrs
- 1 days/yr
Risk factors via First Street. Map © Google.
Why this score? — see what drove the B grade
The composite is a weighted blend of 9 inputs, each scored 0–100. Each bar is that input's sub-score; the figure is the points it added to the 100-point composite (weight × sub-score).
- Cash flow +27.2/30.0
- Appreciation +10.0/10.0
- DSCR +9.5/10.0
- 1% rule +8.7/10.0
- ARV discount +7.5/15.0
- Rent growth +3.1/5.0
- Livability +2.9/5.0
- Condition / age +2.5/5.0
- Schools +1.7/10.0
$115,000
🖨 Deal sheet 📄 Offer letter ✓ Due diligence
Listing remarks
Great FIXER UPPER! Great location! Just south of 107 off of Stewart Rd, you can make it your own. Property has a lot of potential and it is sitting on 0.30 of an acre * * * . This home features 3 bedrooms and 1 bath. Attached is a mother in law, roommate or guest suite with 2 bedrooms and 1 full bath and it's own laundry room, also has a living space and a kitchenette. * * * THIS PROPERTY might qualify for a 203k rehab loan * * * Schedule your showings!
Key facts
- Mother in law suite
- 0.30 of an acre
- Own laundry room
Tags
Property features AI
Finance
- HOA & community: No homeowners association
Exterior
- Parking: No garage
- Utilities: City sewer
- Home design: Single-family property (stucco exterior); Composition shingle roof
- Construction: Stucco construction; Slab foundation; Composition shingle roof
- Exterior features: Chain link fencing; Patio; Paved road access; Curbs
Interior
- Kitchen: Electric water heater; No conveying appliances
- Flooring: Concrete
- Bathrooms: 2 full bathrooms
- Heating & cooling: Central heating (electric); Central air conditioning (electric)
- Interior features: Entrance foyer; Tile countertops; Other interior features; No window coverings; Has maid quarters
- Laundry & utility: Laundry room
Neighborhood map
What this means for you Summary
Snapshot
- This is a 3-bed/1.0-bath single-family listed at $115k.
Deal economics
- At list price, monthly cash flow is $330 ($4k/yr) — positive.
- The deal already cash-flows at list — no discount required.
- Meets the 1% rule at list price ($2k rent vs $115k).
- Recommended offer: $112k (3.0% below list) — sets the bar for market timing.
- Cap rate 9.7% vs local median 2.6% in Alton — top-decile yield for the area; either an underpriced asset or a hidden risk that comps aren't pricing in. Stress-test before assuming the spread holds.
Location & tenants
- Location reads 58/100 on livability (#1,230 in TX) — a working-class tenant base; expect higher turnover. Strengths: cost of living A+, housing A; Watch: crime F, amenities F, commute F.
- Mission CISD (urban): math 15% / reading 28% proficiency, ranked #775 of 826 in TX (top 94%) — low school quality limits family demand, transient renter base, plan for 1-2y turnover; 78% free/reduced lunch — lower-income household profile, screen leases tightly.
- Zoned schools: Hurla M Midkiff El (math 12% / reading 17%, grade F, #4,048 of 4,322 statewide, top 95%, 666 students, 81% FRL); Rafael A Cantu J H (math 16% / reading 26%, grade F, #1,387 of 1,662 statewide, top 85%, 594 students, 91% FRL); Veterans Memorial H S (math 19% / reading 44%, grade F, #1,073 of 1,632 statewide, top 66%, 1,932 students, 81% FRL).
- Market conditions: Rents rising (+2.5%/yr); 623 active listings in the ZIP; 1 comparable units currently listed for rent nearby; 7,378 units permitted in Hidalgo County in 2024 (641 in 5+ unit buildings).
Forward outlook
- In year one you build about $12k of equity ($795 loan paydown + $12k appreciation (10.0% local appreciation)).
- Hidalgo County population projected at +28% by 2050 — long-run rental-demand tailwind backs the buy-and-hold thesis.
- At projected returns (10.0% appreciation + 2.5% rent growth), your $32k cash investment doubles in ~2 years — after that, you're playing with house money.
- By year 3, paydown + projected appreciation supports a ~$31k cash-out refi (75% LTV) — recoverable capital for the next deal without selling this one.
Negotiation context
- It's been on market 32 days — a 3% lower offer ($112k) is reasonable based on typical stale-listing flexibility.
- 6 sale attempts since 3y ago with the ask held roughly flat each time — persistent listings suggest the price (not the market) is what's stuck; bring a comps-based counter.
Risks & watch-outs
- Watch-outs: property tax is 2.7% of price.
- Climate carrying-cost: severe wind risk, 99% chance of damaging wind over 30y; major wildfire risk; extreme-heat days projected 7→22/yr by 2055 (HVAC capex compounding) — expect insurance premiums to compound above CPI over the hold.
Questions for the listing agent
- It's been on market 32 days. Have you received any prior offers? Is the seller open to a 3% concession, seller financing, or rate buy-down credit?
- Property tax is high relative to price — has the assessment been appealed recently, and will the sale trigger a re-assessment?
- Is there a deadline driving the sale (1031 exchange, divorce, estate, relocation)? That informs how much negotiation room exists.
- Schools are F-rated, which usually means shorter tenancies and higher turnover. Who's the typical renter profile here, and what's been the actual vacancy rate?
- Crime grade is F in this area — have there been break-ins, vandalism, or insurance claims at this property in the last 3 years? What carrier currently insures it and at what premium?
- What's the average days-on-market for RENTAL listings here right now (not sales)? A rising rental-DOM trend means longer vacancies and softer asking-rent achievability than the comps imply.
- What's the recent tenant-quality profile in this submarket — average credit score on applications, eviction rate, late-payment / NSF rate, and stable-employment percentage? A property-management company in the area should have these aggregated.
- How much new for-sale + rental construction is in the pipeline within 1–3 miles? Heavy new supply typically softens prices + rents 12–24 months out; constrained supply supports both.
Investment metrics
- 1% rule
- 1.37% ✓
- Cap rate
- 9.74%
- Cash-on-cash
- 12.29%
- DSCR
- 1.55
- GRM
- 6.1
CMA / ARV
- ARV (on-the-fly)
- $312,143
- Comps found
- 10
Show comp detail 10 sales within ~0.75 mi
| Address | Dist | Beds/Ba | Sqft | Sold | Price | $/sf | Match |
|---|---|---|---|---|---|---|---|
| 2107 E La Pointe Ave | 0.15mi | 4/2.0 (+1) | 1,699 (-8%) | 1mo | $265,000 | $156 | 70 |
| 1416 N Rockport St | 0.35mi | 3/2.0 | 1,620 (-12%) | 0mo | $289,000 | $178 | 59 |
| 806 N Bluebonnet St | 0.37mi | 3/2.0 | 1,785 (-3%) | 18mo | $255,000 | $143 | 58 |
| 9610 N 71st Ln | 0.67mi | 4/2.5 (+1) | 1,880 (+2%) | 1mo | $349,000 | $186 | 54 |
| 3003 Truman Ave | 0.52mi | 4/2.5 (+1) | 1,945 (+5%) | 5mo | $369,900 | $190 | 52 |
| 3101 E Harding Ave | 0.40mi | 3/2.0 | 1,742 (-6%) | 23mo | $249,000 | $143 | 49 |
| 1502 N Rockport St | 0.37mi | 3/2.0 | 1,620 (-12%) | 12mo | $295,000 | $182 | 48 |
| 3114 E Harding Ave | 0.44mi | 3/2.0 | 1,707 (-8%) | 19mo | $264,000 | $155 | 47 |
| 1506 N Rockport St | 0.39mi | 3/2.5 | 1,592 (-14%) | 9mo | $269,000 | $169 | 46 |
| 3106 E Truman Ave | 0.55mi | 3/2.0 | 1,650 (-11%) | 9mo | $243,000 | $147 | 45 |
Match score weights: distance 35% · size 25% · config 20% · recency 20%. Top-matched comps best support the ARV.
Projected returns pro-forma
10.0% appreciation · 2.45% rent growth · sell at horizon
- IRR
- 33.1%
- Equity multiple
- 3.57×
- Total profit
- $82,872
- Equity at exit
- $103,601
- IRR
- 28.3%
- Equity multiple
- 8.02×
- Total profit
- $225,996
- Equity at exit
- $223,420
Cash invested: $32,200 (down + closing). Projections, not guarantees.
Landlord ↔ Tenant lean methodology
- Overall (STATE)
- 87 Strongly Landlord-Friendly
- State Texas
- 87 Strongly Landlord-Friendly · R+5
- County
- — inherits STATE
- City
- — inherits STATE
ZIP-level market 78573
- Home prices YoY
- 8.0%
- Rents YoY
- 2.5%
- Active inventory
- 623
- Price-to-rent
- 6.1×
Monthly cashflow live
- Estimated rent
- $1,574 medium interval (Pro) →
- Mortgage (P&I)
- −$603
- Tax from tax record
- −$263 /mo · $3,154/yr
- Insurance
- −$48
- HOA
- −$0
- Vacancy / Maint / Mgmt
- −$331
- Net cashflow
- $330
Break-even live
UW: 25.0% down · 7.5% · 30yr · 1.5% tax · 5.0% vac · 8.0% maint · 8.0% mgmt
Financing live
Cash to close
- Down payment
- $28,750
- Closing costs
- $3,450
- Reserves months
- —
- Total cash needed
- —
Loan-product check · same deal, 3 products live
Conventional
25% down · 7.5% · 30yr
- Down + closing
- —
- Monthly P&I
- —
- Monthly cashflow
- —
- DSCR
- —
- Eligible?
- —
Personal DTI + credit; lowest rate.
DSCR
20% down · 8.5% · 30yr
- Down + closing
- —
- Monthly P&I
- —
- Monthly cashflow
- —
- DSCR
- —
- Eligible?
- —
No personal income docs; deal must DSCR.
Hard money
10% down · 12.0% · 12mo
- Down + closing
- —
- Monthly P&I
- —
- Monthly cashflow
- —
- DSCR
- —
- Eligible?
- —
Short-term bridge; refi at stabilization.
Rent comps 1 comps
| Address | Beds | Baths | Sqft | Rent | $/sqft | DOM | Units | Dist |
|---|---|---|---|---|---|---|---|---|
| 5508 Cornell Ave Mission, TX | 3.0 | 2.5 | 1900 | $2,600 | $1.37 | 14d | 1 | 1.46mi |
Listing history 23 events
-
2026-06-18days on market $115,000 Active 32 DOM
-
2026-06-17days on market $115,000 Active 31 DOM
-
2026-06-16days on market $115,000 Active 30 DOM
-
2026-06-15days on market $115,000 Active 29 DOM
-
2026-06-14days on market $115,000 Active 27 DOM
-
2026-06-10days on market $115,000 Active 24 DOM
-
2026-06-09days on market $115,000 Active 23 DOM
-
2026-06-08days on market $115,000 Active 22 DOM
-
2026-06-07days on market $115,000 Active 21 DOM
-
2026-06-03days on market $115,000 Active 17 DOM
-
2026-06-02days on market $115,000 Active 16 DOM
-
2026-06-01days on market $115,000 Active 15 DOM
-
2026-05-31days on market $115,000 Active 14 DOM
-
2026-05-31days on market $115,000 Active 13 DOM
-
2026-05-17$115,000 Active
-
2025-12-18$120,000 Active
-
2025-05-11$125,000 Active
-
2024-11-04price $125,000
-
2024-08-13price $130,000
-
2024-05-01$135,000 Active
-
2023-11-27$135,000 Active
-
2023-05-30price $135,000
-
2023-03-02$140,000 Active
ⓘ Source: listings_history table (triggers on properties + properties_extension) + one-shot
backfill from property_details.listing_events for pre-trigger history.
Tax reassessment forecast TX · Resets to sale price
- Current annual tax
- $3,154 · $263/mo
- Projected year-2 tax
- $3,154 · $263/mo
- Expected delta
- $0/yr ($0/mo · 0.0%)
ⓘ Screening estimate from a state-policy table — verify with the county assessor before closing.
Climate risk First Street
- Flood 1/10 Low 0% chance over 30 yrs
- Wildfire 6/10 Major
- Heat 9/10 Extreme 7 d/yr ≥111°F today · 22 d/yr by 30 yrs out
- Wind 8/10 Severe 99% chance of damaging wind over 30 yrs
- Air quality 2/10 Low 0 unhealthy d/yr today · 1 by 30 yrs out
Nearby sold comps map
Loading sold comps map…
Walkable amenities ~0.75 mi
Loading nearby amenities…
Taxation est. · year 1
- Rental income
- $18,892
- − Mortgage interest
- −$6,442
- − Property taxes
- −$3,154
- − Insurance
- −$575
- − Repairs & maintenance
- −$1,511
- − Management
- −$1,511
- − Depreciation
- −$3,345
- Taxable income
- $2,353
- Est. tax owed @ 24.0%
- −$565
- After-tax cash flow
- $3,394/yr
For passive investors: Depreciation is non-cash, so a rental often shows a tax loss while cash-flowing — sheltering income. Rental losses are passive: they offset passive income freely, and up to $25,000/yr can offset ordinary (W-2) income if you actively participate and your MAGI is under $100k (phasing out to $0 by $150k); unused losses carry forward. On sale, claimed depreciation is recaptured at up to 25%, and gains may owe capital-gains tax (a 1031 exchange can defer both). Figures are a year-1 estimate at your 24.0% rate — not tax advice; consult a CPA.
Schools (NCES district)
- District
- Mission CISD
- NCES district ID
- 4831040
- Math proficiency
- 15% ▼ -35.00%
- Reading proficiency
- 28% ▼ -15.00%
- Median HH income
- $32,855
- Composite
- 17.47/100
- National rank
- #9061
- State rank
- #775 of 826 in TX
Livability — Alton
- Score
- 58/100
- State rank
- #1230
- US rank
- #21479
Category grades
Schools grade is shown separately in the Schools card above.
Census & demographics
- Census place
- Alton, TX
- County
- Hidalgo County · 623,128 people
- City population
- 44,809
- Metro
- McAllen-Edinburg-Mission, TX
- Population (ZIP)
- 44,809
- Household income
- $55,000
- Rent vs Own
- Severe rent burden
- 855.0
Population outlook (Hidalgo County) Hauer SSP2
- Today (2025)
- 955,232 people
- By 2030
- 1,009,774 · +5.7%
- By 2040
- 1,120,332 · +17.3%
- By 2050
- 1,225,036 · +28.2%
- By 2075
- 1,439,189 · +50.7%
- By 2100
- 1,533,429 · +60.5%
Race, ethnicity, and origin ACS 2023
- Neighborhood character
- Predominantly Hispanic (96%)
- Race & ethnicity
- Hispanic / Latino 96% Two or more races 63% White 3%
- Hispanic origin (detail)
- Mexican 94%
- Foreign-born
- 28% · Canada
- Languages at home
- 12% English-only · Spanish 88%
Political lean MEDSL · Hidalgo
- 2024 margin
- Toss-up / Even · D 48.1% · R 51.0%
- 2008→2024 swing
- -41.6pp toward R · 2008: 38.7pp · 2024: -2.9pp
- All cycles
- 2024: R+2.9 2020: D+17.1 2016: D+40.5 2012: D+41.8 2008: D+38.7
Not yet ingested
- Civics
- —
Market trends
- HPI YoY
- ▲ 17.95%
- Current HPI
- 242.0711
- Rent YoY
- ▲ 2.45%
- Metro
- McAllen-Edinburg-Mission, TX
- State GDP YoY
- ▲ 3.95%
- F500 in state
- 110
Industry mix (Fortune 500 HQ in TX)
| Industry | F500 HQs | Revenue |
|---|---|---|
| Energy | 16 | $1,198B |
|
||
| Technology | 5 | $198B |
|
||
| Engineering / Construction | 4 | $72B |
|
||
| Energy Services | 3 | $60B |
|
||
| Utilities | 3 | $41B |
|
||
| Healthcare | 2 | $330B |
|
||
Price history
-17.9% since first listed9 events — show timeline
- 2026-05-17 Listed $115,000 MCALLENMLS
- 2025-12-18 Listed $120,000 MCALLENMLS
- 2025-05-11 Listed $125,000 MCALLENMLS
- 2024-11-04 Price Changed $125,000 MCALLENMLS
- 2024-08-13 Price Changed $130,000 MCALLENMLS
- 2024-05-01 Listed $135,000 MCALLENMLS
- 2023-11-27 Listed $135,000 MCALLENMLS
- 2023-05-30 Price Changed $135,000 MCALLENMLS
- 2023-03-02 Listed $140,000 MCALLENMLS
Property tax history
+4.7%/yrLatest (2025): $3,154 · +10.3% YoY. Source: county tax records.
Cash-flow waterfall
monthlySold comps — $/sqft
last 12 mo · ≤1 miLoading sold comps…