 🏷️ Likely Rental
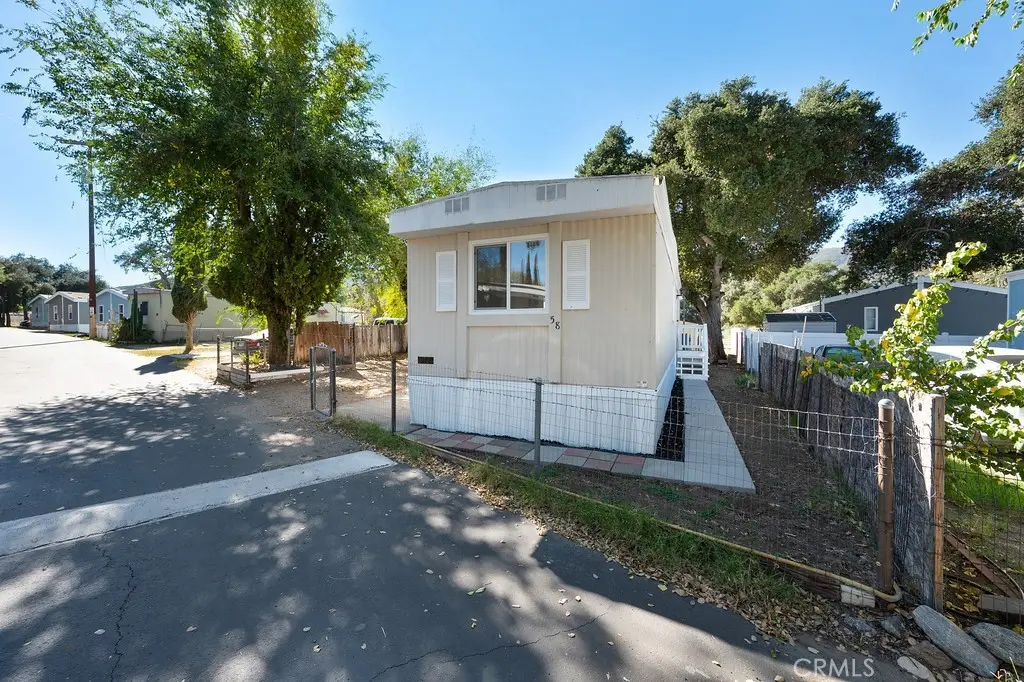
26455 Paradise Valley Rd #58 · Aguanga, CA
Flood risk 6/10 · Moderate
- FEMA flood zone
- D
- Chance of flooding over 30 yrs
- 0.7%
- Est. flood insurance / yr
- $544 – $1,084
Fire risk 10/10 · Severe
- Est. fire insurance / yr
- $659 – $1,223
Heat risk 5/10 · Moderate
- Hot days now (above 96°F)
- 8 days/yr
- Hot days in 30 yrs
- 23 days/yr
Wind risk 1/10 · Minimal
- Chance of severe wind over 30 yrs
- —
Air-quality risk 6/10 · Moderate
- Unhealthy air days now
- 10 days/yr
- Unhealthy air days in 30 yrs
- 12 days/yr
Risk factors via First Street. Map © Google.
Why this score? — see what drove the A grade
The composite is a weighted blend of 9 inputs, each scored 0–100. Each bar is that input's sub-score; the figure is the points it added to the 100-point composite (weight × sub-score).
- Cash flow +30.0/30.0
- ARV discount +15.0/15.0
- 1% rule +10.0/10.0
- DSCR +10.0/10.0
- Appreciation +10.0/10.0
- Condition / age +4.0/5.0
- Rent growth +2.5/5.0
- Schools +2.2/10.0
- Livability +1.5/5.0
$32,950
🖨 Deal sheet 📄 Offer letter ✓ Due diligence
Listing remarks MLS
Beautifully updated 1978 Fleetwood Manufactured Home featuring 1 bedroom and 1 bathroom with modern fixtures throughout. The kitchen includes updated kitchen appliances. Located in the Quiet Oaks community with affordable space rent of $695 per month. A great opportunity to enjoy an updated home in a well-established, convenient community.
Key facts
- Quiet oaks community
- Built 1978
- Listed 212 days
Tags
Neighborhood map
What this means for you Summary
Snapshot
- This is a 1-bed/1.0-bath manufactured listed at $33k. Condition is rated good.
Deal economics
- At list price, monthly cash flow is $585 ($7k/yr) — positive.
- The deal already cash-flows at list — no discount required.
- Meets the 1% rule at list price ($1k rent vs $33k).
- Recommended offer: $29k (12.0% below list) — sets the bar for market timing.
- Cap rate 27.6% vs local median 2.1% in Aguanga — top-decile yield for the area; either an underpriced asset or a hidden risk that comps aren't pricing in. Stress-test before assuming the spread holds.
Location & tenants
- Location reads 29/100 on livability (#1,472 in CA) — a limited-amenity area; tenant pool skews transient or value-seeking. Strengths: crime A; Watch: schools D, amenities F, commute F.
- Warner Unified (rural): math 15% / reading 30% proficiency, ranked #1,219 of 1,400 in CA (top 87%) — low school quality limits family demand, transient renter base, plan for 1-2y turnover; 68% free/reduced lunch — lower-income household profile, screen leases tightly.
- Market conditions: 60 active listings in the ZIP; 11,759 units permitted in San Diego County in 2024 (7,244 in 5+ unit buildings).
Forward outlook
- In year one you build about $4k of equity ($228 loan paydown + $3k appreciation (10.0% local appreciation)).
- San Diego County population projected at +20% by 2050 — long-run rental-demand tailwind backs the buy-and-hold thesis.
- At projected returns (10.0% appreciation + 3.0% rent growth), your $9k cash investment doubles in ~1 year — after that, you're playing with house money.
- By year 8, paydown + projected appreciation supports a ~$31k cash-out refi (75% LTV) — recoverable capital for the next deal without selling this one.
Negotiation context
- It's been on market 213 days — a 12% lower offer ($29k) is reasonable based on typical stale-listing flexibility.
Risks & watch-outs
- Climate carrying-cost: major flood risk; severe wildfire risk; extreme-heat days projected 8→23/yr by 2055 (HVAC capex compounding) — expect insurance premiums to compound above CPI over the hold.
Questions for the listing agent
- It's been on market 213 days. Have you received any prior offers? Is the seller open to a 12% concession, seller financing, or rate buy-down credit?
- Built in 1978 — when were the roof, HVAC, electrical panel, plumbing, and water heater last replaced?
- Why hasn't it sold? Are there any deal-killer items the seller is aware of (foundation, flood, title, zoning, code violations)?
- Is there a deadline driving the sale (1031 exchange, divorce, estate, relocation)? That informs how much negotiation room exists.
- Schools are D-rated, which usually means shorter tenancies and higher turnover. Who's the typical renter profile here, and what's been the actual vacancy rate?
- What's the average days-on-market for RENTAL listings here right now (not sales)? A rising rental-DOM trend means longer vacancies and softer asking-rent achievability than the comps imply.
- What's the recent tenant-quality profile in this submarket — average credit score on applications, eviction rate, late-payment / NSF rate, and stable-employment percentage? A property-management company in the area should have these aggregated.
- How much new for-sale + rental construction is in the pipeline within 1–3 miles? Heavy new supply typically softens prices + rents 12–24 months out; constrained supply supports both.
Investment metrics
- 1% rule
- 3.12% ✓
- Cap rate
- 27.61%
- Cash-on-cash
- 76.13%
- DSCR
- 4.39
- GRM
- 2.7
CMA / ARV
- ARV (median comp)
- $54,137
- List price
- $32,950
- Delta
- -39.14%
- Verdict
- UNDERPRICED
- Comps
- 3 within 1.0 mi
Projected returns pro-forma
10.0% appreciation · 3.0% rent growth · sell at horizon
- IRR
- 86.5%
- Equity multiple
- 6.99×
- Total profit
- $55,241
- Equity at exit
- $29,684
- IRR
- 81.0%
- Equity multiple
- 15.46×
- Total profit
- $133,390
- Equity at exit
- $64,015
Cash invested: $9,226 (down + closing). Projections, not guarantees.
Landlord ↔ Tenant lean methodology
- Overall (STATE)
- 18 Strongly Tenant-Friendly
- State California
- 18 Strongly Tenant-Friendly · D+13
- County
- — inherits STATE
- City
- — inherits STATE
ZIP-level market 92086
- Home prices YoY
- 9.4%
- Active inventory
- 60
- Price-to-rent
- 2.7×
Monthly cashflow live
- Estimated rent
- $1,029 medium interval (Pro) →
- Mortgage (P&I)
- −$173
- Tax est. 1.5%
- −$41 /mo · $494/yr
- Insurance
- −$14
- HOA
- −$0
- Vacancy / Maint / Mgmt
- −$216
- Net cashflow
- $585
Break-even live
UW: 25.0% down · 7.5% · 30yr · 1.5% tax · 5.0% vac · 8.0% maint · 8.0% mgmt
Financing live
Cash to close
- Down payment
- $8,238
- Closing costs
- $988
- Reserves months
- —
- Total cash needed
- —
Loan-product check · same deal, 3 products live
Conventional
25% down · 7.5% · 30yr
- Down + closing
- —
- Monthly P&I
- —
- Monthly cashflow
- —
- DSCR
- —
- Eligible?
- —
Personal DTI + credit; lowest rate.
DSCR
20% down · 8.5% · 30yr
- Down + closing
- —
- Monthly P&I
- —
- Monthly cashflow
- —
- DSCR
- —
- Eligible?
- —
No personal income docs; deal must DSCR.
Hard money
10% down · 12.0% · 12mo
- Down + closing
- —
- Monthly P&I
- —
- Monthly cashflow
- —
- DSCR
- —
- Eligible?
- —
Short-term bridge; refi at stabilization.
Listing history 19 events
-
2026-06-19days on market $32,950 Active 213 DOM
-
2026-06-18days on market $32,950 Active 212 DOM
-
2026-06-17days on market $32,950 Active 211 DOM
-
2026-06-16days on market $32,950 Active 210 DOM
-
2026-06-15days on market $32,950 Active 209 DOM
-
2026-06-14days on market $32,950 Active 207 DOM
-
2026-06-12days on market $32,950 Active 206 DOM
-
2026-06-09days on market $32,950 Active 203 DOM
-
2026-06-08days on market $32,950 Active 202 DOM
-
2026-06-07days on market $32,950 Active 201 DOM
-
2026-06-07days on market $32,950 Active 200 DOM
-
2026-06-04days on market $32,950 Active 197 DOM
-
2026-06-02days on market $32,950 Active 196 DOM
-
2026-06-01days on market $32,950 Active 195 DOM
-
2026-05-31days on market $32,950 Active 194 DOM
-
2026-05-31days on market $32,950 Active 193 DOM
-
2026-05-07price $34,950 341-char remark
Show marketing remark (341 chars)
Beautifully updated 1978 Fleetwood Manufactured Home featuring 1 bedroom and 1 bathroom with modern fixtures throughout. The kitchen includes updated kitchen appliances. Located in the Quiet Oaks community with affordable space rent of $695 per month. A great opportunity to enjoy an updated home in a well-established, convenient community.
-
2026-03-05price $39,950 341-char remark
Show marketing remark (341 chars)
Beautifully updated 1978 Fleetwood Manufactured Home featuring 1 bedroom and 1 bathroom with modern fixtures throughout. The kitchen includes updated kitchen appliances. Located in the Quiet Oaks community with affordable space rent of $695 per month. A great opportunity to enjoy an updated home in a well-established, convenient community.
-
2025-11-18$44,950 Active 341-char remark
Show marketing remark (341 chars)
Beautifully updated 1978 Fleetwood Manufactured Home featuring 1 bedroom and 1 bathroom with modern fixtures throughout. The kitchen includes updated kitchen appliances. Located in the Quiet Oaks community with affordable space rent of $695 per month. A great opportunity to enjoy an updated home in a well-established, convenient community.
ⓘ Source: listings_history table (triggers on properties + properties_extension) + one-shot
backfill from property_details.listing_events for pre-trigger history.
Climate risk First Street
- Flood 6/10 Major FEMA zone D · 70% chance over 30 yrs
- Wildfire 10/10 Extreme
- Heat 5/10 Major 8 d/yr ≥96°F today · 23 d/yr by 30 yrs out
- Wind 1/10 Low
- Air quality 6/10 Major 10 unhealthy d/yr today · 12 by 30 yrs out
Nearby sold comps map
Loading sold comps map…
Walkable amenities ~0.75 mi
Loading nearby amenities…
Taxation est. · year 1
- Rental income
- $12,350
- − Mortgage interest
- −$1,846
- − Property taxes
- −$494
- − Insurance
- −$165
- − Repairs & maintenance
- −$988
- − Management
- −$988
- − Depreciation
- −$959
- Taxable income
- $6,911
- Est. tax owed @ 24.0%
- −$1,659
- After-tax cash flow
- $5,365/yr
For passive investors: Depreciation is non-cash, so a rental often shows a tax loss while cash-flowing — sheltering income. Rental losses are passive: they offset passive income freely, and up to $25,000/yr can offset ordinary (W-2) income if you actively participate and your MAGI is under $100k (phasing out to $0 by $150k); unused losses carry forward. On sale, claimed depreciation is recaptured at up to 25%, and gains may owe capital-gains tax (a 1031 exchange can defer both). Figures are a year-1 estimate at your 24.0% rate — not tax advice; consult a CPA.
Condition & rehab AI · 12 photos
This updated 1978 Fleetwood manufactured home in Quiet Oaks offers a modern living space with good curb appeal and minimal maintenance needs.
Value-add opportunities
- Both Paint exterior — Fresh paint can enhance curb appeal and value
- Both Replace air conditioning unit — Modern unit improves comfort and energy efficiency
- Both Install smart home devices — Enhances convenience and marketability
Renovation cost estimate screening
Value-add ROI direction
- Both Paint exterior — Fresh paint can enhance curb appeal and value ↑
- Both Replace air conditioning unit — Modern unit improves comfort and energy efficiency ↑
- Both Install smart home devices — Enhances convenience and marketability ↑
ⓘ Cost ranges are severity-bucket heuristics (US national rule-of-thumb). Get contractor quotes + a written scope before underwriting a rehab budget.
Schools (NCES district)
- District
- Warner Unified
- NCES district ID
- 0600042
- Math proficiency
- 15% ▬ 0.00%
- Reading proficiency
- 30% ▲ 10.00%
- Median HH income
- $38,559
- Composite
- 22.01/100
- National rank
- #13538
- State rank
- #1219 of 1400 in CA
Livability — Aguanga
- Score
- 29/100
- State rank
- #1472
- US rank
- #27924
Category grades
Schools grade is shown separately in the Schools card above.
Census & demographics
- Population (ZIP)
- 1,410
Population outlook (San Diego County) Hauer SSP2
- Today (2025)
- 3,678,185 people
- By 2030
- 3,856,546 · +4.8%
- By 2040
- 4,171,407 · +13.4%
- By 2050
- 4,421,607 · +20.2%
- By 2075
- 4,831,599 · +31.4%
- By 2100
- 4,832,502 · +31.4%
Race, ethnicity, and origin ACS 2023
- Neighborhood character
- Diverse neighborhood (Simpson 0.56)
- Race & ethnicity
- White 61% Hispanic / Latino 26% Two or more races 17% Asian 5% Native American 5%
- Hispanic origin (detail)
- Mexican 20%
- Common ancestry
- Iranian 3% Italian 3% Lithuanian 1%
- Foreign-born
- 14% · Canada, South Korea
- Languages at home
- 85% English-only · Spanish 11% Korean 2% Tagalog/Filipino 1%
Political lean MEDSL · San Diego
- 2024 margin
- D (+16.8) · D 56.9% · R 40.1% · Other 2.9%
- 2008→2024 swing
- +6.6pp toward D · 2008: 10.2pp · 2024: 16.8pp
- All cycles
- 2024: D+16.8 2020: D+22.8 2016: D+17.8 2012: D+5.1 2008: D+10.2
Not yet ingested
- Civics
- —
Market trends
- HPI YoY
- ▲ 28.73%
- Current HPI
- 334.0631
- Rent YoY
- —
- Metro
- —
- State GDP YoY
- ▲ 3.21%
- F500 in state
- 116
Industry mix (Fortune 500 HQ in CA)
| Industry | F500 HQs | Revenue |
|---|---|---|
| Technology | 27 | $1,492B |
|
||
| Financial Services | 3 | $174B |
|
||
| Retail | 3 | $44B |
|
||
| Insurance | 3 | $26B |
|
||
| Media / Entertainment | 2 | $115B |
|
||
| Pharmaceuticals / Biotech | 2 | $62B |
|
||
Price history
-22.2% since first listed3 events — show timeline
- 2026-05-07 Price Changed $34,950 CRMLS
- 2026-03-05 Price Changed $39,950 CRMLS
- 2025-11-18 Listed $44,950 CRMLS
Cash-flow waterfall
monthlySold comps — $/sqft
last 12 mo · ≤1 miLoading sold comps…