 Multi-family
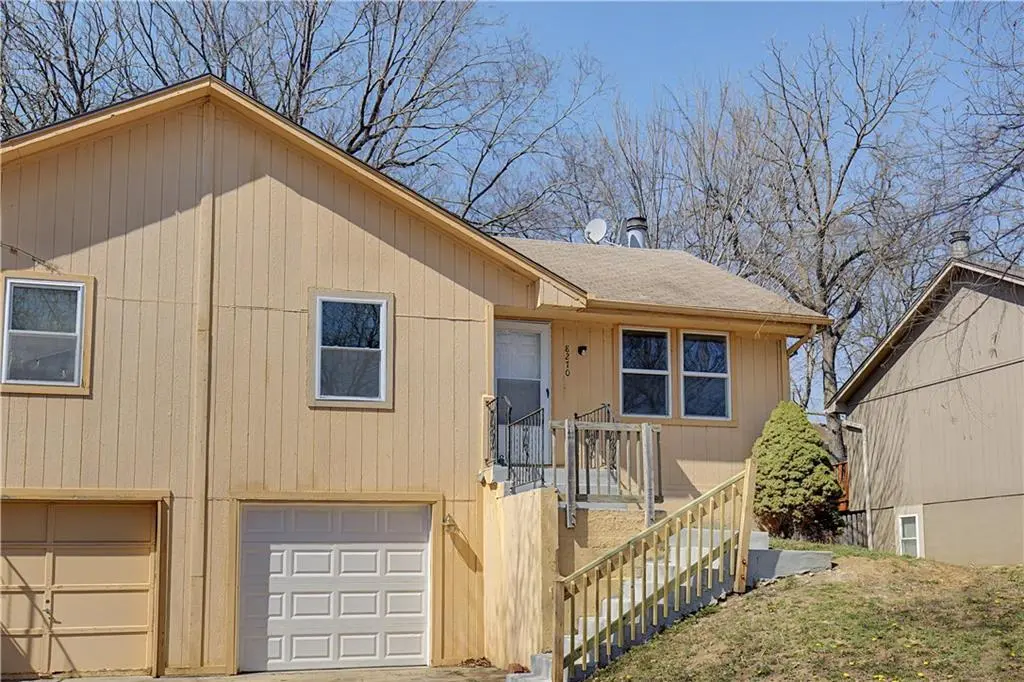
8270 Perry St · Overland Park, KS
Flood risk 1/10 · Minimal
- FEMA flood zone
- X (unshaded)
- Chance of flooding over 30 yrs
- 0.0%
- Est. flood insurance / yr
- $473 – $860
Fire risk 1/10 · Minimal
- Est. fire insurance / yr
- $1,154 – $2,142
Heat risk 4/10 · Minor
- Hot days now (above 107°F)
- 7 days/yr
- Hot days in 30 yrs
- 17 days/yr
Wind risk 2/10 · Minimal
- Chance of severe wind over 30 yrs
- —
Air-quality risk 2/10 · Minimal
- Unhealthy air days now
- 2 days/yr
- Unhealthy air days in 30 yrs
- 2 days/yr
Risk factors via First Street. Map © Google.
Why this score? — see what drove the B grade
The composite is a weighted blend of 9 inputs, each scored 0–100. Each bar is that input's sub-score; the figure is the points it added to the 100-point composite (weight × sub-score).
- Cash flow +30.0/30.0
- DSCR +10.0/10.0
- 1% rule +9.2/10.0
- ARV discount +7.5/15.0
- Livability +4.0/5.0
- Schools +3.8/10.0
- Rent growth +3.7/5.0
- Condition / age +2.5/5.0
- Appreciation +0.0/10.0
$240,000
🖨 Deal sheet 📄 Offer letter ✓ Due diligence
Multi-family units
County records classify this as Multi-Family (2-4 Unit). Listing-text estimate: 1 unit. estimate disagrees with records
Listing remarks
Stop searching and start packing! Discover the perfect blend of comfort and convenience in this newly updated 3-bedroom, 2-bath home, perfectly situated in the heart of Overland Park. The light-filled main level features fresh interior paint, new flooring, light fixtures and updated baths. Relax in the vaulted great room, anchored by a charming stone fireplace. The third bedroom is in the lower level plus a full bath and rec room. The home has a 1-car attached garage and no HOA fee. This home is just minutes from Downtown Overland Park, top-rated Shawnee Mission Schools, parks, shopping, and major highways. This prime property is ready for you to move in!
Key facts
- Garage
- Built 1980
- Listed 24 days
Neighborhood map
What this means for you Summary
Snapshot
- This is a 3-bed/2.0-bath multifamily listed at $240k.
Deal economics
- At list price, monthly cash flow is $1k ($14k/yr) — positive.
- The deal already cash-flows at list — no discount required.
- Meets the 1% rule at list price ($3k rent vs $240k).
- Recommended offer: $236k (1.5% below list) — sets the bar for market timing.
- Cap rate 12.1% vs local median 3.9% in Overland Park — top-decile yield for the area; either an underpriced asset or a hidden risk that comps aren't pricing in. Stress-test before assuming the spread holds.
Location & tenants
- Location reads 80/100 on livability (#16 in KS, #1,851 nationally) — a professional / high-income tenant draw. Strengths: employment A+, housing A+, crime B; Watch: health & safety C-, commute D+.
- Shawnee Mission Pub Schools (suburban): math 38% / reading 46% proficiency, ranked #22 of 169 in KS (top 13%) — families likely to look elsewhere, expect single-tenant / working-renter base with shorter leases.
- Zoned schools: Apache Elem (math 24% / reading 31%, grade F, #505 of 684 statewide, top 74%, 526 students, 72% FRL) — zoned schools average 72% FRL vs 29% district-wide (43 pts higher); higher-poverty schools than district average — tighter screening recommended.
- Zoned-school proficiency averages 28% at this address vs 42% district-wide (-14 pts) — the specific schools serving this property underperform the Shawnee Mission Pub Schools average; the district grade overstates school quality for this exact location.
- Market conditions: Rents rising fast (+4.8%/yr); 70 active listings in the ZIP; 28 comparable units currently listed for rent nearby; rentals leasing fast (median 11d on market — plan ~1-2 weeks tenant-placement turnaround); solid renter incomes; 2,969 units permitted in Johnson County in 2024 (1,066 in 5+ unit buildings).
- At $3,419/mo this rent would consume 54% of the median local household income ($76k/yr) (locally 935% of renters already pay >50% of income on rent) — very limited rent-growth headroom before tenants either downsize or default.
Forward outlook
- Local home prices are declining (-3.0%/yr); year-one equity from $2k of loan paydown is wiped out by about $7k of value loss. Plan a longer hold.
- Johnson County population projected at +27% by 2050 — long-run rental-demand tailwind backs the buy-and-hold thesis.
- At projected returns (-3.0% appreciation + 4.8% rent growth), your $67k cash investment doubles in ~6 years — after that, you're playing with house money.
Negotiation context
- It's been on market 24 days — a 2% lower offer ($236k) is reasonable based on typical stale-listing flexibility.
- 6 sale attempts since 19y ago with the ask held roughly flat each time — persistent listings suggest the price (not the market) is what's stuck; bring a comps-based counter.
Questions for the listing agent
- Is there a deadline driving the sale (1031 exchange, divorce, estate, relocation)? That informs how much negotiation room exists.
- Schools are B-rated — typically a magnet for longer-tenancy family renters. What's the average tenant stay here, and is there a school-zone premium baked into asking?
- What's the average days-on-market for RENTAL listings here right now (not sales)? A rising rental-DOM trend means longer vacancies and softer asking-rent achievability than the comps imply.
- What's the recent tenant-quality profile in this submarket — average credit score on applications, eviction rate, late-payment / NSF rate, and stable-employment percentage? A property-management company in the area should have these aggregated.
- How much new apartment / multifamily construction is in the pipeline within 1–3 miles? Heavy new supply (>2% of stock underway) typically softens rents 12–24 months out; light construction supports rent growth.
Investment metrics
- 1% rule
- 1.42% ✓
- Cap rate
- 12.10%
- Cash-on-cash
- 20.74%
- DSCR
- 1.92
- GRM
- 5.8
CMA / ARV
No comps found within radius.
Projected returns pro-forma
-3.0% appreciation · 4.79% rent growth · sell at horizon
- IRR
- 15.0%
- Equity multiple
- 1.61×
- Total profit
- $41,319
- Equity at exit
- $35,785
- IRR
- 25.0%
- Equity multiple
- 3.35×
- Total profit
- $157,809
- Equity at exit
- $20,751
Cash invested: $67,200 (down + closing). Projections, not guarantees.
Landlord ↔ Tenant lean methodology
- Overall (STATE)
- 83 Strongly Landlord-Friendly
- State Kansas
- 83 Strongly Landlord-Friendly · R+10
- County
- — inherits STATE
- City
- — inherits STATE
ZIP-level market 66204
- Rents YoY
- 4.8%
- Active inventory
- 70
- Price-to-rent
- 11.7×
Monthly cashflow live
- Estimated rent
- $3,419 high interval (Pro) →
- Mortgage (P&I)
- −$1,259
- Tax from tax record
- −$181 /mo · $2,174/yr
- Insurance
- −$100
- HOA
- −$0
- Vacancy / Maint / Mgmt
- −$718
- Net cashflow
- $1,161
Break-even live
2-unit breakdown (identical units grouped — click to expand)
| Units | Beds | Baths | Est. rent |
|---|---|---|---|
| 2× units | 3 | 2 | $3,418 |
| #1 | 3 | 2 | $1,709 |
| #2 | 3 | 2 | $1,709 |
| Total (2 units) | $3,419 | ||
UW: 25.0% down · 7.5% · 30yr · 1.5% tax · 5.0% vac · 8.0% maint · 8.0% mgmt
Financing live
Cash to close
- Down payment
- $60,000
- Closing costs
- $7,200
- Reserves months
- —
- Total cash needed
- —
Loan-product check · same deal, 3 products live
Conventional
25% down · 7.5% · 30yr
- Down + closing
- —
- Monthly P&I
- —
- Monthly cashflow
- —
- DSCR
- —
- Eligible?
- —
Personal DTI + credit; lowest rate.
DSCR
20% down · 8.5% · 30yr
- Down + closing
- —
- Monthly P&I
- —
- Monthly cashflow
- —
- DSCR
- —
- Eligible?
- —
No personal income docs; deal must DSCR.
Hard money
10% down · 12.0% · 12mo
- Down + closing
- —
- Monthly P&I
- —
- Monthly cashflow
- —
- DSCR
- —
- Eligible?
- —
Short-term bridge; refi at stabilization.
Rent comps 28 comps
| Address | Beds | Baths | Sqft | Rent | $/sqft | DOM | Units | Dist |
|---|---|---|---|---|---|---|---|---|
| 8342 Wedd St Overland Park, KS | 1.0–3.0 | 1.0–2.0 | 1223 | $1,455 | $1.19 | 23d | 1 | 0.16mi |
| 8100 Perry St Overland Park, KS | 1.0–3.0 | 1.0–2.0 | 991 | $1,850 | $1.87 | 7d | 10 | 0.18mi |
| 8000 Perry St Overland Park, KS | 1.0–3.0 | 1.0–2.0 | 998 | $1,685 | $1.69 | 1d | 11 | 0.34mi |
| 8403 Carter St Overland Park, KS | 2.0–3.0 | 1.0–2.0 | 1732 | $4,750 | $2.74 | 10d | 1 | 0.38mi |
| 9551 W 85th St Overland Park, KS | 1.0–3.0 | 1.0–2.5 | 1026 | $1,225 | $1.19 | 12d | 2 | 0.45mi |
| 9400 W 81st St Overland Park, KS | 2.0 | 1.0 | 1050 | $1,345 | $1.28 | 12d | 1 | 0.51mi |
| 9634 W 87th St Overland Park, KS | 2.0 | 2.5 | 1100 | $1,475 | $1.34 | 7d | 4 | 0.57mi |
| 7819 Carter St Overland Park, KS | 1.0–2.0 | 1.0–1.5 | 850 | $1,175 | $1.38 | 23d | 1 | 0.63mi |
| 9213 W 79th St Overland Park, KS | 1.0–2.0 | 1.0–2.0 | 906 | $1,295 | $1.43 | 1d | 11 | 0.67mi |
| 9010 W 82nd St Overland Park, KS | 3.0 | 1.0 | 1360 | $2,179 | $1.60 | 4d | 1 | 0.70mi |
| 9526 W 78th St Overland Park, KS | 2.0 | 2.0 | 1145 | $1,800 | $1.57 | 20d | 1 | 0.72mi |
| 7903 Grandview St Overland Park, KS | 2.0 | 1.0 | 972 | $1,295 | $1.33 | 23d | 1 | 0.79mi |
| 9301 Santa Fe Ln Overland Park, KS | 1.0–2.0 | 1.0–2.0 | 982 | $3,642 | $3.71 | 10d | 1 | 0.82mi |
| 7650 Goddard St Shawnee, KS | 2.0 | 1.0–2.5 | 1225 | $1,925 | $1.57 | 14d | 1 | 0.87mi |
| 11501 W 81st St Overland Park, KS | 2.0 | 1.0–2.0 | 901 | $2,971 | $3.30 | 1d | 10 | 0.90mi |
| 9130 W 78th St Overland Park, KS | 3.0 | 2.0 | 1527 | $1,745 | $1.14 | 17d | 1 | 0.90mi |
| 9128 W 78th St Overland Park, KS | 3.0 | 2.0 | 1527 | $1,745 | $1.14 | 12d | 1 | 0.91mi |
| 7350 Kings Cove Dr Merriam, KS | 2.0 | 1.0–2.0 | 746 | $1,449 | $1.94 | 23d | 1 | 1.10mi |
| 7613 Flint St Overland Park, KS | 1.0–3.0 | 1.0–2.0 | 1000 | $1,730 | $1.73 | 1d | 16 | 1.17mi |
| 7613 Flint St Overland Park, KS | 1.0–3.0 | 1.0–2.0 | 1000 | $1,750 | $1.75 | 10d | 13 | 1.17mi |
| 8640 Hadley St Overland Park, KS | 3.0 | 2.0 | 1100 | $1,925 | $1.75 | 21d | 1 | 1.19mi |
| 7530 Cody St Overland Park, KS | 1.0–3.0 | 1.0–2.0 | 875 | $1,726 | $1.97 | 3d | 28 | 1.31mi |
| 7420 Flint St Shawnee, KS | 1.0–2.0 | 1.0–2.0 | 917 | $1,399 | $1.53 | 1d | 16 | 1.36mi |
| 7106 Mastin St Unit 1 Shawnee, KS | 3.0 | 3.5 | 1700 | $2,300 | $1.35 | 4d | 1 | 1.38mi |
| 8325 Lowell Ave Unit 6 Overland Park, KS | 2.0 | 1.0 | 900 | $1,195 | $1.33 | 7d | 1 | 1.42mi |
| 7801 W 83rd St Overland Park, KS | 1.0–2.0 | 1.0–2.0 | 875 | $1,450 | $1.66 | 7d | 3 | 1.44mi |
| 8300 Robinson St Apt 2 Overland Park, KS | 2.0 | 2.0 | 950 | $1,450 | $1.53 | 23d | 1 | 1.45mi |
| 10405 W 70th Ter Shawnee, KS | 1.0–2.0 | 1.0–2.0 | 830 | $1,540 | $1.86 | 23d | 1 | 1.48mi |
Listing history 12 events
-
2026-04-19status Pending
-
2026-03-27$240,000 Active
-
2026-03-24historical $240,000
-
2025-04-23historical
-
2025-04-22status Active
-
2025-04-12status Pending
-
2025-04-02status Active
-
2025-03-24status Pending
-
2025-03-21$190,000 Active
-
2008-07-23soldstatus
-
2008-02-08$124,500
-
2007-10-05$124,500
ⓘ Source: listings_history table (triggers on properties + properties_extension) + one-shot
backfill from property_details.listing_events for pre-trigger history.
Tax reassessment forecast KS · Resets to sale price
- Current annual tax
- $2,174 · $181/mo
- Projected year-2 tax
- $3,384 · $282/mo
- Expected delta
- +$1,210/yr (+$101/mo · 55.7%)
ⓘ Screening estimate from a state-policy table — verify with the county assessor before closing.
Climate risk First Street
- Flood 1/10 Low FEMA zone X (unshaded) · 0% chance over 30 yrs
- Wildfire 1/10 Low
- Heat 4/10 Moderate 7 d/yr ≥107°F today · 17 d/yr by 30 yrs out
- Wind 2/10 Low
- Air quality 2/10 Low 2 unhealthy d/yr today · 2 by 30 yrs out
Nearby sold comps map
Loading sold comps map…
Walkable amenities ~0.75 mi
Loading nearby amenities…
Taxation est. · year 1
- Rental income
- $41,028
- − Mortgage interest
- −$13,444
- − Property taxes
- −$2,174
- − Insurance
- −$1,200
- − Repairs & maintenance
- −$3,282
- − Management
- −$3,282
- − Depreciation
- −$6,982
- Taxable income
- $10,664
- Est. tax owed @ 24.0%
- −$2,559
- After-tax cash flow
- $11,376/yr
For passive investors: Depreciation is non-cash, so a rental often shows a tax loss while cash-flowing — sheltering income. Rental losses are passive: they offset passive income freely, and up to $25,000/yr can offset ordinary (W-2) income if you actively participate and your MAGI is under $100k (phasing out to $0 by $150k); unused losses carry forward. On sale, claimed depreciation is recaptured at up to 25%, and gains may owe capital-gains tax (a 1031 exchange can defer both). Figures are a year-1 estimate at your 24.0% rate — not tax advice; consult a CPA.
Schools (NCES district)
- District
- Shawnee Mission Pub Schools
- NCES district ID
- 2011640
- Math proficiency
- 38% ▼ -6.00%
- Reading proficiency
- 46% ▼ -2.00%
- Median HH income
- $64,923
- Composite
- 37.55/100
- National rank
- #4391
- State rank
- #22 of 169 in KS
Livability — Overland Park
- Score
- 80/100
- State rank
- #16
- US rank
- #1851
Category grades
Schools grade is shown separately in the Schools card above.
Census & demographics
- Census place
- Overland Park, KS
- County
- Johnson County · 574,662 people
- City population
- 180,138
- Metro
- Kansas City, MO-KS
- Population (ZIP)
- 17,948
- Household income
- $75,889
- Rent vs Own
- Severe rent burden
- 935.0
Population outlook (Johnson County) Hauer SSP2
- Today (2025)
- 663,396 people
- By 2030
- 702,585 · +5.9%
- By 2040
- 775,386 · +16.9%
- By 2050
- 841,772 · +26.9%
- By 2075
- 994,137 · +49.9%
- By 2100
- 1,073,036 · +61.7%
Race, ethnicity, and origin ACS 2023
- Neighborhood character
- Predominantly White (71%)
- Race & ethnicity
- White 71% Hispanic / Latino 17% Two or more races 10% Black 7% Asian 1%
- Hispanic origin (detail)
- Mexican 10%
- Common ancestry
- Romanian 2% Serbian 2% Slovak 2%
- Foreign-born
- 9% · Canada
- Languages at home
- 85% English-only · Spanish 11% Other Indo-European 1% Arabic 1%
Political lean MEDSL · Johnson
- 2024 margin
- Lean D (+8.5) · D 53.4% · R 44.9% · Other 1.8%
- 2008→2024 swing
- +17.5pp toward D · 2008: -9.0pp · 2024: 8.5pp
- All cycles
- 2024: D+8.5 2020: D+8.2 2016: R+2.7 2012: R+17.8 2008: R+9.0
Not yet ingested
- Civics
- —
Market trends
- HPI YoY
- ▼ -355.92%
- Current HPI
- 266.5058
- Rent YoY
- ▲ 4.79%
- Metro
- Kansas City, MO-KS
- State GDP YoY
- —
- F500 in state
- 0
Price history
+92.8% since first listed12 events — show timeline
- 2026-04-19 Pending — Heartland MLS as Distributed by MLS Grid
- 2026-03-27 Listed $240,000 Heartland MLS as Distributed by MLS Grid
- 2026-03-24 Coming Soon $240,000 Heartland MLS as Distributed by MLS Grid
- 2025-04-23 Listing Removed — Heartland MLS as Distributed by MLS Grid
- 2025-04-22 Relisted — Heartland MLS as Distributed by MLS Grid
- 2025-04-12 Pending — Heartland MLS as Distributed by MLS Grid
- 2025-04-02 Relisted — Heartland MLS as Distributed by MLS Grid
- 2025-03-24 Pending — Heartland MLS as Distributed by MLS Grid
- 2025-03-21 Listed $190,000 Heartland MLS as Distributed by MLS Grid
- 2008-07-23 Sold (Public Records) — Public Records
- 2008-02-08 Listed $124,500 Heartland MLS as Distributed by MLS Grid
- 2007-10-05 Listed $124,500 Heartland MLS as Distributed by MLS Grid
Property tax history
+6.0%/yrLatest (2025): $2,174 · +2.2% YoY. Source: county tax records.
Cash-flow waterfall
monthlySold comps — $/sqft
last 12 mo · ≤1 miLoading sold comps…