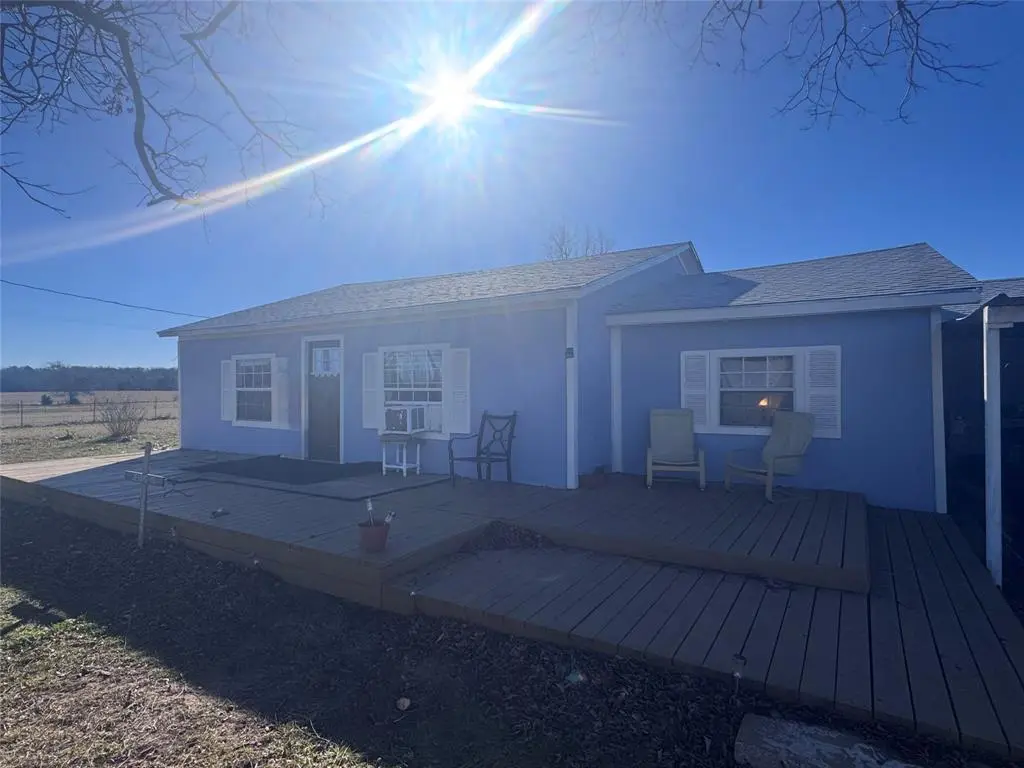
6305 W State Highway 243 · Myrtle Springs, TX
Flood risk 1/10 · Minimal
- FEMA flood zone
- X (unshaded)
- Chance of flooding over 30 yrs
- 0.0%
- Est. flood insurance / yr
- $507 – $1,088
Fire risk 4/10 · Minor
- Est. fire insurance / yr
- $1,222 – $2,270
Heat risk 7/10 · Major
- Hot days now (above 111°F)
- 7 days/yr
- Hot days in 30 yrs
- 25 days/yr
Wind risk 6/10 · Moderate
- Chance of severe wind over 30 yrs
- 61.0%
Air-quality risk 2/10 · Minimal
- Unhealthy air days now
- 0 days/yr
- Unhealthy air days in 30 yrs
- 1 days/yr
Risk factors via First Street. Map © Google.
Why this score? — see what drove the D- grade
The composite is a weighted blend of 9 inputs, each scored 0–100. Each bar is that input's sub-score; the figure is the points it added to the 100-point composite (weight × sub-score).
- Cash flow +9.2/30.0
- ARV discount +7.5/15.0
- Schools +4.4/10.0
- 1% rule +3.3/10.0
- Livability +3.0/5.0
- DSCR +2.6/10.0
- Rent growth +2.5/5.0
- Condition / age +2.5/5.0
- Appreciation +0.0/10.0
$190,000
🖨 Deal sheet (PDF) 📄 Offer letter ✓ Due diligence
Listing remarks MLS
Perfectly located on 243, less than 10 miles from Canton and the famous Canton Trade Days!! Offering 2.5 ACRES of flat, useable land. This 1800+ square foot house has a NEW ROOF, new front deck, new water heater, and updated HVAC system is ready to be installed! Needs some foundation work. Interior needs a full renovation. Huge kitchen. So much space to create your dream house both inside and out!! Incredible investment opportunity or great place to put in some sweat-equity to invest in yourself!! BRING ME YOUR BEST OFFER!!
Key facts
- Updated hvac system
- New water heater
- Huge kitchen
Tags
Neighborhood map
What this means for you Summary
Snapshot
- This is a 3-bed/2.0-bath single-family listed at $190k.
Deal economics
- At list price, monthly cash flow is $-141 ($-2k/yr) — negative.
- To cash-flow at today's rent, offer at most $165k (13.1% below list).
- To meet the 1% rule (rent ≥ 1% of price), the offer needs to be $157k (17.1% below list).
- Recommended offer: $157k (17.1% below list) — sets the bar for 1% rule.
- Cap rate 5.4% vs local median 1.1% in Myrtle Springs — top-decile yield for the area; either an underpriced asset or a hidden risk that comps aren't pricing in. Stress-test before assuming the spread holds.
Location & tenants
- Location reads 60/100 on livability (#1,054 in TX) — a middle-class / working-renter tenant base. Strengths: cost of living A+, housing A+; Watch: employment C-, amenities F, commute F.
- Canton ISD (town): math 49% / reading 55% proficiency, ranked #151 of 826 in TX (top 18%) — acceptable for families but not a draw, mixed tenant base, ~2y average lease.
- Zoned schools: Canton El (571 students, 57% FRL); Canton J H (math 47% / reading 52%, grade C, #356 of 1,662 statewide, top 23%, 550 students, 47% FRL); Canton H S (math 67% / reading 72%, grade B, #119 of 1,632 statewide, top 9%, 653 students, 41% FRL).
- Market conditions: 261 active listings in the ZIP; 54 units permitted in Van Zandt County in 2024 (0 in 5+ unit buildings).
Forward outlook
- Local home prices are declining (-3.0%/yr); year-one equity from $1k of loan paydown is wiped out by about $6k of value loss. Plan a longer hold.
- Van Zandt County population projected at +4% by 2050 — modest demand growth; plan on rents tracking national, not racing it.
Negotiation context
- It's been on market 133 days — a 12% lower offer ($167k) is reasonable based on typical stale-listing flexibility.
- 2 sale attempts; this cycle's ask has dropped $10k (5%) from the opening price — seller is motivated, your offer sets the floor, not the list.
Risks & watch-outs
- Watch-outs: built in 1949 — expect roof / HVAC / electrical / plumbing capex.
- Climate carrying-cost: major wind risk, 61% chance of damaging wind over 30y; extreme-heat days projected 7→25/yr by 2055 (HVAC capex compounding) — expect insurance premiums to compound above CPI over the hold.
Questions for the listing agent
- What do current leases actually rent for vs. the listed asking? Can we see a recent rent roll and the last 12 months of T-12 income?
- It's been on market 133 days. Have you received any prior offers? Is the seller open to a 17% concession, seller financing, or rate buy-down credit?
- Built in 1949 — when were the roof, HVAC, electrical panel, plumbing, and water heater last replaced?
- Why hasn't it sold? Are there any deal-killer items the seller is aware of (foundation, flood, title, zoning, code violations)?
- Is there a deadline driving the sale (1031 exchange, divorce, estate, relocation)? That informs how much negotiation room exists.
- Schools are F-rated, which usually means shorter tenancies and higher turnover. Who's the typical renter profile here, and what's been the actual vacancy rate?
- The area grade is low — what's the realistic commute time and amenity access for the typical tenant pool here? Any planned neighborhood developments (good or bad) we should know about?
- What's the average days-on-market for RENTAL listings here right now (not sales)? A rising rental-DOM trend means longer vacancies and softer asking-rent achievability than the comps imply.
- What's the recent tenant-quality profile in this submarket — average credit score on applications, eviction rate, late-payment / NSF rate, and stable-employment percentage? A property-management company in the area should have these aggregated.
- How much new for-sale + rental construction is in the pipeline within 1–3 miles? Heavy new supply typically softens prices + rents 12–24 months out; constrained supply supports both.
Investment metrics
- 1% rule
- 0.83% ✗
- Cap rate
- 5.40%
- Cash-on-cash
- -3.19%
- DSCR
- 0.86
- GRM
- 10.1
CMA / ARV
- ARV (median comp)
- $452,636
- List price
- $190,000
- Delta
- -58.02%
- Verdict
- UNDERPRICED
- Comps
- 3 within 1.0 mi
Show comp detail 1 sale within ~0.75 mi
| Address | Dist | Beds/Ba | Sqft | Sold | Price | $/sf | Match |
|---|---|---|---|---|---|---|---|
| 6520 W State Highway 243 | 0.26mi | 3/2.0 | 1,932 (+6%) | 18mo | $514,500 | $266 | 64 |
Match score weights: distance 35% · size 25% · config 20% · recency 20%. Top-matched comps best support the ARV.
Projected returns pro-forma
-3.0% appreciation · 3.0% rent growth · sell at horizon
- IRR
- -21.6%
- Equity multiple
- 0.25×
- Total profit
- $-39,719
- Equity at exit
- $28,330
- IRR
- -15.2%
- Equity multiple
- 0.14×
- Total profit
- $-45,898
- Equity at exit
- $16,428
Cash invested: $53,200 (down + closing). Projections, not guarantees.
Landlord ↔ Tenant lean methodology
- Overall (STATE)
- 87 Strongly Landlord-Friendly
- State Texas
- 87 Strongly Landlord-Friendly · R+5
- County
- — inherits STATE
- City
- — inherits STATE
ZIP-level market 75103
- Home prices YoY
- -14.3%
- Active inventory
- 261
- Price-to-rent
- 10.1×
Monthly cashflow live
- Estimated rent
- $1,575 medium interval (Pro) →
- Mortgage (P&I)
- −$996
- Tax from tax record
- −$310 /mo · $3,717/yr
- Insurance
- −$79
- HOA
- −$0
- Vacancy / Maint / Mgmt
- −$331
- Net cashflow
- $-141
Break-even live
Sensitivity live
| Price | -10% $-34 | -5% $-88 | +0% $-141 | +5% $-195 | +10% $-249 |
|---|---|---|---|---|---|
| Rent | -10% $-266 | -5% $-203 | +0% $-141 | +5% $-79 | +10% $-17 |
| Rate | -1.0pp $-46 | -0.5pp $-93 | base $-141 | +0.5pp $-191 | +1.0pp $-241 |
UW: 25.0% down · 7.5% · 30yr · 1.5% tax · 5.0% vac · 8.0% maint · 8.0% mgmt
Financing live
Cash to close
- Down payment
- $47,500
- Closing costs
- $5,700
- Reserves months
- —
- Total cash needed
- —
Loan-product check · same deal, 3 products live
Conventional
25% down · 7.5% · 30yr
- Down + closing
- —
- Monthly P&I
- —
- Monthly cashflow
- —
- DSCR
- —
- Eligible?
- —
Personal DTI + credit; lowest rate.
DSCR
20% down · 8.5% · 30yr
- Down + closing
- —
- Monthly P&I
- —
- Monthly cashflow
- —
- DSCR
- —
- Eligible?
- —
No personal income docs; deal must DSCR.
Hard money
10% down · 12.0% · 12mo
- Down + closing
- —
- Monthly P&I
- —
- Monthly cashflow
- —
- DSCR
- —
- Eligible?
- —
Short-term bridge; refi at stabilization.
Listing history 22 events
-
2026-06-21days on market $190,000 Active 133 DOM
-
2026-06-18days on market $190,000 Active 130 DOM
-
2026-06-17days on market $190,000 Active 129 DOM
-
2026-06-16days on market $190,000 Active 128 DOM
-
2026-06-15days on market $190,000 Active 127 DOM
-
2026-06-13days on market $190,000 Active 125 DOM
-
2026-06-13days on market $190,000 Active 124 DOM
-
2026-06-09days on market $190,000 Active 121 DOM
-
2026-06-08days on market $190,000 Active 120 DOM
-
2026-06-07days on market $190,000 Active 119 DOM
-
2026-06-04days on market $190,000 Active 116 DOM
-
2026-06-03days on market $190,000 Active 115 DOM
-
2026-06-02days on market $190,000 Active 114 DOM
-
2026-06-01days on market $190,000 Active 113 DOM
-
2026-05-31days on market $190,000 Active 112 DOM
-
2026-04-13price $190,000 529-char remark
Show marketing remark (529 chars)
Perfectly located on 243, less than 10 miles from Canton and the famous Canton Trade Days!! Offering 2.5 ACRES of flat, useable land. This 1800+ square foot house has a NEW ROOF, new front deck, new water heater, and updated HVAC system is ready to be installed! Needs some foundation work. Interior needs a full renovation. Huge kitchen. So much space to create your dream house both inside and out!! Incredible investment opportunity or great place to put in some sweat-equity to invest in yourself!! BRING ME YOUR BEST OFFER!!
-
2026-03-06status Active 529-char remark
Show marketing remark (529 chars)
Perfectly located on 243, less than 10 miles from Canton and the famous Canton Trade Days!! Offering 2.5 ACRES of flat, useable land. This 1800+ square foot house has a NEW ROOF, new front deck, new water heater, and updated HVAC system is ready to be installed! Needs some foundation work. Interior needs a full renovation. Huge kitchen. So much space to create your dream house both inside and out!! Incredible investment opportunity or great place to put in some sweat-equity to invest in yourself!! BRING ME YOUR BEST OFFER!!
-
2026-02-06$200,000 Active 529-char remark
Show marketing remark (529 chars)
Perfectly located on 243, less than 10 miles from Canton and the famous Canton Trade Days!! Offering 2.5 ACRES of flat, useable land. This 1800+ square foot house has a NEW ROOF, new front deck, new water heater, and updated HVAC system is ready to be installed! Needs some foundation work. Interior needs a full renovation. Huge kitchen. So much space to create your dream house both inside and out!! Incredible investment opportunity or great place to put in some sweat-equity to invest in yourself!! BRING ME YOUR BEST OFFER!!
-
2024-04-15soldstatus
-
2016-01-28soldstatus
-
1998-03-09soldstatus
-
1998-02-12soldstatus
ⓘ Source: listings_history table (triggers on properties + properties_extension) + one-shot
backfill from property_details.listing_events for pre-trigger history.
Tax reassessment forecast TX · Resets to sale price
- Current annual tax
- $3,717 · $310/mo
- Projected year-2 tax
- $3,717 · $310/mo
- Expected delta
- $0/yr ($0/mo · 0.0%)
ⓘ Screening estimate from a state-policy table — verify with the county assessor before closing.
Climate risk First Street
- Flood 1/10 Low FEMA zone X (unshaded) · 0% chance over 30 yrs
- Wildfire 4/10 Moderate
- Heat 7/10 Severe 7 d/yr ≥111°F today · 25 d/yr by 30 yrs out
- Wind 6/10 Major 61% chance of damaging wind over 30 yrs
- Air quality 2/10 Low 0 unhealthy d/yr today · 1 by 30 yrs out
Nearby sold comps map
Loading sold comps map…
Walkable amenities ~0.75 mi
Loading nearby amenities…
Taxation est. · year 1
- Rental income
- $18,896
- − Mortgage interest
- −$10,643
- − Property taxes
- −$3,717
- − Insurance
- −$950
- − Repairs & maintenance
- −$1,512
- − Management
- −$1,512
- − Depreciation
- −$5,527
- Taxable loss
- −$4,964
- Est. tax savings @ 24.0%
- +$1,191
- After-tax cash flow
- $-504/yr
For passive investors: Depreciation is non-cash, so a rental often shows a tax loss while cash-flowing — sheltering income. Rental losses are passive: they offset passive income freely, and up to $25,000/yr can offset ordinary (W-2) income if you actively participate and your MAGI is under $100k (phasing out to $0 by $150k); unused losses carry forward. On sale, claimed depreciation is recaptured at up to 25%, and gains may owe capital-gains tax (a 1031 exchange can defer both). Figures are a year-1 estimate at your 24.0% rate — not tax advice; consult a CPA.
Schools (NCES district)
- District
- Canton ISD
- NCES district ID
- 4812750
- Math proficiency
- 49% ▼ -12.00%
- Reading proficiency
- 55% ▼ -1.00%
- Median HH income
- $46,385
- Composite
- 44.08/100
- National rank
- #2877
- State rank
- #151 of 826 in TX
Livability — Myrtle Springs
- Score
- 60/100
- State rank
- #1054
- US rank
- #18547
Category grades
Schools grade is shown separately in the Schools card above.
Census & demographics
- Population (ZIP)
- 16,222
Population outlook (Van Zandt County) Hauer SSP2
- Today (2025)
- 55,634 people
- By 2030
- 56,479 · +1.5%
- By 2040
- 57,672 · +3.7%
- By 2050
- 57,913 · +4.1%
- By 2075
- 57,544 · +3.4%
- By 2100
- 52,659 · -5.3%
Race, ethnicity, and origin ACS 2023
- Neighborhood character
- Predominantly White (86%)
- Race & ethnicity
- White 86% Hispanic / Latino 7% Two or more races 5% Black 1%
- Hispanic origin (detail)
- Mexican 7%
- Common ancestry
- Lithuanian 2% Italian 1% Slovak 1%
- Foreign-born
- 2% · Canada
- Languages at home
- 95% English-only · Spanish 4%
Political lean MEDSL · Van Zandt
- 2024 margin
- Solid R (+74.8) · D 12.3% · R 87.2%
- 2008→2024 swing
- -19.8pp toward R · 2008: -55.1pp · 2024: -74.8pp
- All cycles
- 2024: R+74.8 2020: R+72.1 2016: R+72.1 2012: R+66.6 2008: R+55.1
Not yet ingested
- Civics
- —
Market trends
- HPI YoY
- ▼ -38.07%
- Current HPI
- 227.6156
- Rent YoY
- —
- Metro
- —
- State GDP YoY
- ▲ 3.95%
- F500 in state
- 110
Industry mix (Fortune 500 HQ in TX)
| Industry | F500 HQs | Revenue |
|---|---|---|
| Energy | 16 | $1,198B |
|
||
| Technology | 5 | $198B |
|
||
| Engineering / Construction | 4 | $72B |
|
||
| Energy Services | 3 | $60B |
|
||
| Utilities | 3 | $41B |
|
||
| Healthcare | 2 | $330B |
|
||
Price history
-5.0% since first listed7 events — show timeline
- 2026-04-13 Price Changed $190,000 NTREIS
- 2026-03-06 Relisted — NTREIS
- 2026-02-06 Listed $200,000 NTREIS
- 2024-04-15 Sold (Public Records) — Public Records
- 2016-01-28 Sold (Public Records) — Public Records
- 1998-03-09 Sold (Public Records) — Public Records
- 1998-02-12 Sold (Public Records) — Public Records
Property tax history
+13.1%/yrLatest (2025): $3,717 · +60.7% YoY. Source: county tax records.
Cash-flow waterfall
monthlySold comps — $/sqft
last 12 mo · ≤1 miLoading sold comps…