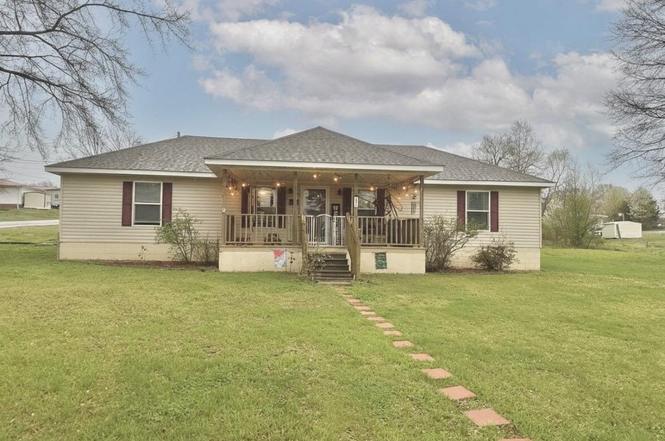
350 Amanda St · Bear Creek, AL
Flood risk 1/10 · Minimal
- FEMA flood zone
- X (unshaded)
- Chance of flooding over 30 yrs
- 0.0%
- Est. flood insurance / yr
- $507 – $1,088
Fire risk 4/10 · Minor
- Est. fire insurance / yr
- $916 – $1,700
Heat risk 6/10 · Moderate
- Hot days now (above 106°F)
- 7 days/yr
- Hot days in 30 yrs
- 20 days/yr
Wind risk 6/10 · Moderate
- Chance of severe wind over 30 yrs
- 27.0%
Air-quality risk 2/10 · Minimal
- Unhealthy air days now
- 1 days/yr
- Unhealthy air days in 30 yrs
- 1 days/yr
Risk factors via First Street. Map © Google.
Why this score? — see what drove the D- grade
The composite is a weighted blend of 9 inputs, each scored 0–100. Each bar is that input's sub-score; the figure is the points it added to the 100-point composite (weight × sub-score).
- Cash flow +11.0/30.0
- ARV discount +7.5/15.0
- Appreciation +5.0/10.0
- DSCR +3.2/10.0
- Schools +2.8/10.0
- Livability +2.7/5.0
- Rent growth +2.5/5.0
- Condition / age +2.5/5.0
- 1% rule +2.2/10.0
$154,900
🖨 Deal sheet 📄 Offer letter ✓ Due diligence
Listing remarks
This adorable home features an open-concept living area, 3 bedrooms, & 2 full baths designed for easy living & maximizes every square foot of living space. The private & spacious primary suite is complete with a generous walk-in closet & large tiled shower. The kitchen is very functional with a large island and comes with equipped with refrigerator, stove & built in microwave. Large yard perfect for children and pets and located within close proximity to area schools. There's a 2 car carport with storage room, also. Cute home!
Key facts
- Large tiled shower
- Walk-in closet
- Large yard
Tags
Property features AI
Exterior
- Parking: Attached carport; Two carport spaces
- Utilities: Public water; Septic tank
- Home design: Single family residence; Residential property; R1 zoning
- Construction: Vinyl siding
- Exterior features: Shingle roof
Interior
- Kitchen: Electric range; Microwave; Refrigerator
- Bedrooms: Three bedrooms on the main level
- Bathrooms: Two full bathrooms
- Heating & cooling: Central heating (natural gas); Central air conditioning
- Interior features: Blinds; Crawl space
- Laundry & utility: Laundry room; Electric water heater
Neighborhood map
What this means for you Summary
Snapshot
- This is a 3-bed/1.0-bath single-family listed at $155k.
Deal economics
- At list price, monthly cash flow is $-65 ($-779/yr) — negative.
- To cash-flow at today's rent, offer at most $143k (7.4% below list).
- To meet the 1% rule (rent ≥ 1% of price), the offer needs to be $111k (28.4% below list).
- Recommended offer: $111k (28.4% below list) — sets the bar for 1% rule.
Location & tenants
- Location reads 54/100 on livability (#454 in AL) — a working-class tenant base; expect higher turnover. Strengths: cost of living A+; Watch: crime F, amenities F, commute F.
- Marion County (rural): math 20% / reading 48% proficiency, ranked #56 of 129 in AL (top 43%) — families likely to look elsewhere, expect single-tenant / working-renter base with shorter leases.
- Zoned schools: Phillips Elementary School (math 22% / reading 32%, grade F, #392 of 627 statewide, top 65%, 254 students, 74% FRL); Phillips High School (math 8% / reading 42%, grade F, #116 of 305 statewide, top 38%, 208 students, 76% FRL) — zoned schools average 75% FRL vs 53% district-wide (22 pts higher); higher-poverty schools than district average — tighter screening recommended.
- Market conditions: 6 active listings in the ZIP; 1 units permitted in Marion County in 2024 (0 in 5+ unit buildings).
Forward outlook
- In year one you build about $6k of equity ($1k loan paydown + $5k appreciation (3.0% local appreciation)).
- Marion County population projected at -16% by 2050 — secular population decline; favor cash flow + early exit over multi-decade hold.
- At projected returns (3.0% appreciation + 3.0% rent growth), your $43k cash investment doubles in ~7 years — after that, you're playing with house money.
- By year 6, paydown + projected appreciation supports a ~$30k cash-out refi (75% LTV) — recoverable capital for the next deal without selling this one.
Negotiation context
- It's been on market 51 days — a 3% lower offer ($150k) is reasonable based on typical stale-listing flexibility.
- Current owner paid $79k; list at $155k implies a 96% gain — meaningful room to come down on a strong offer.
Risks & watch-outs
- Climate carrying-cost: major wind risk, 27% chance of damaging wind over 30y; extreme-heat days projected 7→20/yr by 2055 (HVAC capex compounding) — expect insurance premiums to compound above CPI over the hold.
Questions for the listing agent
- What do current leases actually rent for vs. the listed asking? Can we see a recent rent roll and the last 12 months of T-12 income?
- It's been on market 51 days. Have you received any prior offers? Is the seller open to a 28% concession, seller financing, or rate buy-down credit?
- Is there a deadline driving the sale (1031 exchange, divorce, estate, relocation)? That informs how much negotiation room exists.
- Schools are F-rated, which usually means shorter tenancies and higher turnover. Who's the typical renter profile here, and what's been the actual vacancy rate?
- Crime grade is F in this area — have there been break-ins, vandalism, or insurance claims at this property in the last 3 years? What carrier currently insures it and at what premium?
- The area grade is low — what's the realistic commute time and amenity access for the typical tenant pool here? Any planned neighborhood developments (good or bad) we should know about?
- What's the average days-on-market for RENTAL listings here right now (not sales)? A rising rental-DOM trend means longer vacancies and softer asking-rent achievability than the comps imply.
- What's the recent tenant-quality profile in this submarket — average credit score on applications, eviction rate, late-payment / NSF rate, and stable-employment percentage? A property-management company in the area should have these aggregated.
- How much new for-sale + rental construction is in the pipeline within 1–3 miles? Heavy new supply typically softens prices + rents 12–24 months out; constrained supply supports both.
Investment metrics
- 1% rule
- 0.72% ✗
- Cap rate
- 5.79%
- Cash-on-cash
- -1.80%
- DSCR
- 0.92
- GRM
- 11.6
CMA / ARV
- ARV (on-the-fly)
- $29,120
- Comps found
- 1
Show comp detail 1 sale within ~0.75 mi
| Address | Dist | Beds/Ba | Sqft | Sold | Price | $/sf | Match |
|---|---|---|---|---|---|---|---|
| 429 Georgia St | 0.23mi | 3/1.0 | 1,366 (-6%) | 23mo | $27,500 | $20 | 60 |
Match score weights: distance 35% · size 25% · config 20% · recency 20%. Top-matched comps best support the ARV.
Projected returns pro-forma
3.0% appreciation · 3.0% rent growth · sell at horizon
- IRR
- 5.8%
- Equity multiple
- 1.33×
- Total profit
- $14,460
- Equity at exit
- $69,650
- IRR
- 8.7%
- Equity multiple
- 2.32×
- Total profit
- $57,213
- Equity at exit
- $107,339
Cash invested: $43,372 (down + closing). Projections, not guarantees.
Landlord ↔ Tenant lean methodology
- Overall (STATE)
- 90 Strongly Landlord-Friendly
- State Alabama
- 90 Strongly Landlord-Friendly · R+15
- County
- — inherits STATE
- City
- — inherits STATE
ZIP-level market 35543
- Active inventory
- 6
- Price-to-rent
- 11.6×
Monthly cashflow live
- Estimated rent
- $1,109 medium interval (Pro) →
- Mortgage (P&I)
- −$812
- Tax from tax record
- −$64 /mo · $774/yr
- Insurance
- −$65
- HOA
- −$0
- Vacancy / Maint / Mgmt
- −$233
- Net cashflow
- $-65
Break-even live
UW: 25.0% down · 7.5% · 30yr · 1.5% tax · 5.0% vac · 8.0% maint · 8.0% mgmt
Financing live
Cash to close
- Down payment
- $38,725
- Closing costs
- $4,647
- Reserves months
- —
- Total cash needed
- —
Loan-product check · same deal, 3 products live
Conventional
25% down · 7.5% · 30yr
- Down + closing
- —
- Monthly P&I
- —
- Monthly cashflow
- —
- DSCR
- —
- Eligible?
- —
Personal DTI + credit; lowest rate.
DSCR
20% down · 8.5% · 30yr
- Down + closing
- —
- Monthly P&I
- —
- Monthly cashflow
- —
- DSCR
- —
- Eligible?
- —
No personal income docs; deal must DSCR.
Hard money
10% down · 12.0% · 12mo
- Down + closing
- —
- Monthly P&I
- —
- Monthly cashflow
- —
- DSCR
- —
- Eligible?
- —
Short-term bridge; refi at stabilization.
Listing history 3 events
-
2026-04-30status Pending
-
2026-03-10$154,900 Active
-
2015-10-14soldstatus $79,000
ⓘ Source: listings_history table (triggers on properties + properties_extension) + one-shot
backfill from property_details.listing_events for pre-trigger history.
Tax reassessment forecast AL · Resets to sale price
- Current annual tax
- $774 · $64/mo
- Projected year-2 tax
- $774 · $64/mo
- Expected delta
- $0/yr ($0/mo · 0.0%)
ⓘ Screening estimate from a state-policy table — verify with the county assessor before closing.
Climate risk First Street
- Flood 1/10 Low FEMA zone X (unshaded) · 0% chance over 30 yrs
- Wildfire 4/10 Moderate
- Heat 6/10 Major 7 d/yr ≥106°F today · 20 d/yr by 30 yrs out
- Wind 6/10 Major 27% chance of damaging wind over 30 yrs
- Air quality 2/10 Low 1 unhealthy d/yr today · 1 by 30 yrs out
Nearby sold comps map
Loading sold comps map…
Walkable amenities ~0.75 mi
Loading nearby amenities…
Taxation est. · year 1
- Rental income
- $13,312
- − Mortgage interest
- −$8,677
- − Property taxes
- −$774
- − Insurance
- −$774
- − Repairs & maintenance
- −$1,065
- − Management
- −$1,065
- − Depreciation
- −$4,506
- Taxable loss
- −$3,549
- Est. tax savings @ 24.0%
- +$852
- After-tax cash flow
- $72/yr
For passive investors: Depreciation is non-cash, so a rental often shows a tax loss while cash-flowing — sheltering income. Rental losses are passive: they offset passive income freely, and up to $25,000/yr can offset ordinary (W-2) income if you actively participate and your MAGI is under $100k (phasing out to $0 by $150k); unused losses carry forward. On sale, claimed depreciation is recaptured at up to 25%, and gains may owe capital-gains tax (a 1031 exchange can defer both). Figures are a year-1 estimate at your 24.0% rate — not tax advice; consult a CPA.
Schools (NCES district)
- District
- Marion County
- NCES district ID
- 0102310
- Math proficiency
- 20% ▼ -29.00%
- Reading proficiency
- 48% ▬ 0.00%
- Median HH income
- $32,048
- Composite
- 27.69/100
- National rank
- #6911
- State rank
- #56 of 129 in AL
Livability — Bear Creek
- Score
- 54/100
- State rank
- #454
- US rank
- #23775
Category grades
Schools grade is shown separately in the Schools card above.
Census & demographics
- Census place
- Bear Creek, AL
- Population (ZIP)
- 1,086
Population outlook (Marion County) Hauer SSP2
- Today (2025)
- 28,759 people
- By 2030
- 27,834 · -3.2%
- By 2040
- 25,974 · -9.7%
- By 2050
- 24,129 · -16.1%
- By 2075
- 20,179 · -29.8%
- By 2100
- 16,341 · -43.2%
Race, ethnicity, and origin ACS 2023
- Neighborhood character
- Predominantly White (99%)
- Race & ethnicity
- White 99%
- Common ancestry
- Lithuanian 3% Slovak 2% Scottish 1%
- Languages at home
- 99% English-only · Spanish 1%
Political lean MEDSL · Marion
- 2024 margin
- Solid R (+81.7) · D 8.8% · R 90.5%
- 2008→2024 swing
- -25.6pp toward R · 2008: -56.1pp · 2024: -81.7pp
- All cycles
- 2024: R+81.7 2020: R+77.8 2016: R+76.2 2012: R+61.5 2008: R+56.1
Not yet ingested
- Civics
- —
Market trends
- HPI YoY
- —
- Current HPI
- —
- Rent YoY
- —
- Metro
- —
- State GDP YoY
- ▲ 2.94%
- F500 in state
- 4
Industry mix (Fortune 500 HQ in AL)
| Industry | F500 HQs | Revenue |
|---|---|---|
| Financial Services | 1 | $8B |
|
||
| Healthcare | 1 | $5B |
|
||
Price history
+96.1% since first listed3 events — show timeline
- 2026-04-30 Pending — SAARMLS
- 2026-03-10 Listed $154,900 SAARMLS
- 2015-10-14 Sold (Public Records) $79,000 Public Records
Property tax history
+9.4%/yrLatest (2025): $774 · +7.0% YoY. Source: county tax records.
Cash-flow waterfall
monthlySold comps — $/sqft
last 12 mo · ≤1 miLoading sold comps…