 Triplex
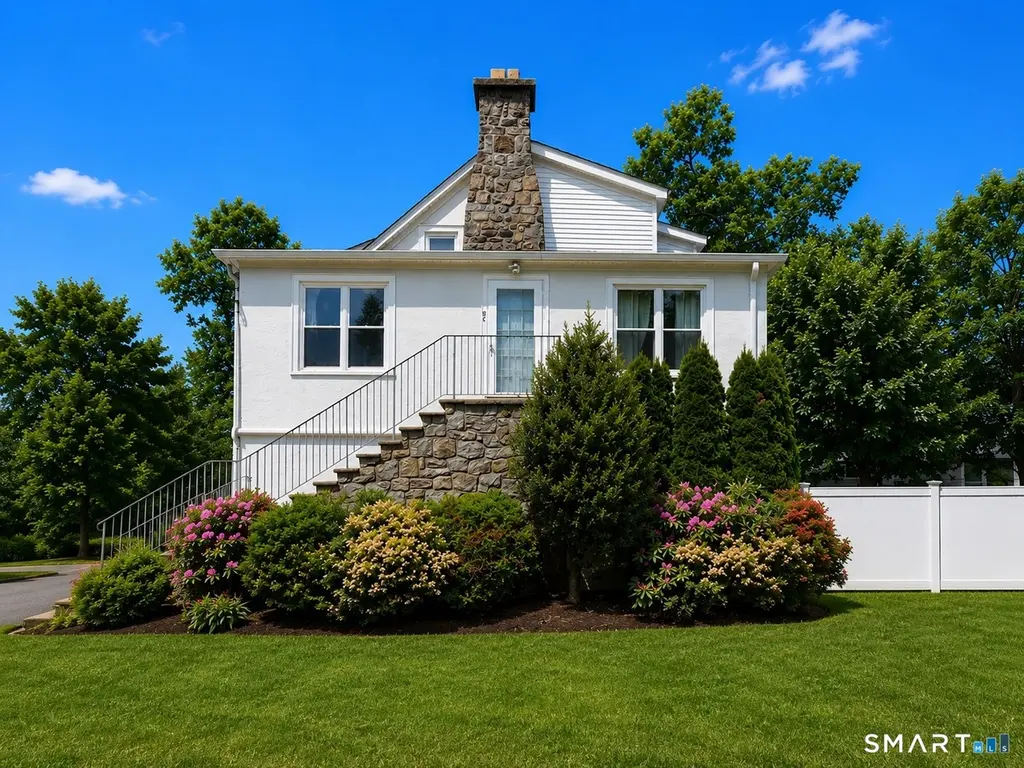
19 Urban St · New Canaan, CT
Flood risk 1/10 · Minimal
- FEMA flood zone
- X (unshaded)
- Chance of flooding over 30 yrs
- 0.0%
- Est. flood insurance / yr
- $473 – $860
Fire risk 1/10 · Minimal
- Est. fire insurance / yr
- $829 – $1,539
Heat risk 5/10 · Moderate
- Hot days now (above 99°F)
- 7 days/yr
- Hot days in 30 yrs
- 16 days/yr
Wind risk 6/10 · Moderate
- Chance of severe wind over 30 yrs
- 59.0%
Air-quality risk 4/10 · Minor
- Unhealthy air days now
- 3 days/yr
- Unhealthy air days in 30 yrs
- 5 days/yr
Risk factors via First Street. Map © Google.
Why this score? — see what drove the C- grade
The composite is a weighted blend of 9 inputs, each scored 0–100. Each bar is that input's sub-score; the figure is the points it added to the 100-point composite (weight × sub-score).
- Cash flow +20.2/30.0
- Schools +8.1/10.0
- ARV discount +7.5/15.0
- DSCR +6.4/10.0
- 1% rule +4.3/10.0
- Rent growth +2.5/5.0
- Livability +2.5/5.0
- Condition / age +2.5/5.0
- Appreciation +0.0/10.0
$1,950,000
🖨 Deal sheet 📄 Offer letter ✓ Due diligence
Multi-family units
County records classify this as Multi-Family (5+ Unit). Listing-text estimate: 3 units. estimate disagrees with records
5+ unit building — per-unit beds/baths from public records are typically unavailable; the breakdown below (if shown) is an estimate from the listing text.
Listing remarks MLS
A unique opportunity to own a multi-family property in highly sought-after New Canaan. This well-maintained three-family home is fully turn-key, with each unit offering in-unit laundry and comfortable, functional layouts that are equally appealing for tenants or extended family living. The property includes four attached garages plus a two-car detached garage with storage, providing flexibility for additional rental income, personal use, or future customization. Whether you're an investor looking for a strong income-producing asset in Fairfield County or a buyer seeking multi-generational living with built-in value, this property delivers the perfect balance of lifestyle and opportunity-all within one of Connecticut's most desirable communities.
Key facts
- Fully leased
- Garage
- Income producing
Tags
Property features AI
Exterior
- Parking: Attached garage; Detached garage; Under-house garage; 6 total garage spaces
- Utilities: Public water connected; Public sewer connected; Domestic hot water (oil and propane)
- Home design: Multi-family property (3-family)
- Construction: Built with stone and masonry; White exterior; Stucco siding; Concrete foundation; Asphalt shingle roof
- Exterior features: Balcony; Garden area; Level lot
Interior
- Bedrooms: 5 bedrooms total
- Bathrooms: 3 full bathrooms
- Heating & cooling: Hot water heating; Oil and propane fuel with above-ground fuel tank
- Interior features: 12 total rooms; Full walk-out basement with garage access; One fireplace; Split system and window unit cooling
- Laundry & utility: Washer and dryer in each unit (W/D in each unit)
Neighborhood map
What this means for you Summary
Snapshot
- This is a 3 × 3-bed/3-bath units multifamily listed at $1.95M.
Deal economics
- At list price, monthly cash flow is $2k ($30k/yr) — positive. Per door: $820/mo.
- The deal already cash-flows at list — no discount required.
- To meet the 1% rule (rent ≥ 1% of price), the offer needs to be $1.81M (7.2% below list).
- Recommended offer: $1.81M (7.2% below list) — sets the bar for 1% rule.
- Cap rate 7.8% vs local median 1.5% in New Canaan — top-decile yield for the area; either an underpriced asset or a hidden risk that comps aren't pricing in. Stress-test before assuming the spread holds.
Location & tenants
- Location reads: area grade C — affects rentability + tenant quality, not the cash-flow math above.
- New Canaan School District (suburban): math 81% / reading 86% proficiency, ranked #1 of 153 in CT (top 1%) — strong family-tenant draw, lease renewals of 3-5y typical; only 6% free/reduced lunch — higher-income household profile.
- Zoned schools: East School (math 84% / reading 84%, grade A+, #7 of 553 statewide, top 1%, 550 students, 0% FRL); New Canaan High School (math 77% / reading 92%, grade A, #1 of 194 statewide, top 1%, 1,294 students, 0% FRL).
- Market conditions: 165 active listings in the ZIP; 7 comparable units currently listed for rent nearby; rentals lingering (median 44d on market — plan ~5-8 weeks vacancy on turnover, expect pricing pressure); 57% of comp listings sitting > 30 days — soft ceiling on asking rent; high-income renter base; 1,151 units permitted in Western Connecticut Planning Region in 2024 (714 in 5+ unit buildings).
- At $18,088/mo this rent would consume 87% of the median local household income ($250k/yr) (locally 261% of renters already pay >50% of income on rent) — very limited rent-growth headroom before tenants either downsize or default.
Forward outlook
- Local home prices are declining (-3.0%/yr); year-one equity from $13k of loan paydown is wiped out by about $58k of value loss. Plan a longer hold.
Negotiation context
- It's been on market 17 days — a 2% lower offer ($1.92M) is reasonable based on typical stale-listing flexibility.
- 3 sale attempts since 17y ago with the ask held roughly flat each time — persistent listings suggest the price (not the market) is what's stuck; bring a comps-based counter.
- Current owner paid $1.28M; list at $1.95M implies a 52% gain — meaningful room to come down on a strong offer.
Risks & watch-outs
- Watch-outs: built in 1941 — expect roof / HVAC / electrical / plumbing capex.
- Climate carrying-cost: major wind risk, 59% chance of damaging wind over 30y; extreme-heat days projected 7→16/yr by 2055 (HVAC capex compounding) — expect insurance premiums to compound above CPI over the hold.
Questions for the listing agent
- Can we see the unit-by-unit rent roll, current vacancy, and any below-market leases? What's the average tenancy length?
- What capital expenditures (roof, boiler, parking lot, exteriors) have been made in the last 5 years, and what's planned in the next 2?
- Built in 1941 — when were the roof, HVAC, electrical panel, plumbing, and water heater last replaced?
- Is there a deadline driving the sale (1031 exchange, divorce, estate, relocation)? That informs how much negotiation room exists.
- What's the average days-on-market for RENTAL listings here right now (not sales)? A rising rental-DOM trend means longer vacancies and softer asking-rent achievability than the comps imply.
- What's the recent tenant-quality profile in this submarket — average credit score on applications, eviction rate, late-payment / NSF rate, and stable-employment percentage? A property-management company in the area should have these aggregated.
- How much new apartment / multifamily construction is in the pipeline within 1–3 miles? Heavy new supply (>2% of stock underway) typically softens rents 12–24 months out; light construction supports rent growth.
Investment metrics
- 1% rule
- 0.93% ✗
- Cap rate
- 7.81%
- Cash-on-cash
- 5.41%
- DSCR
- 1.24
- GRM
- 9.0
CMA / ARV
- ARV (on-the-fly)
- $1,279,670
- Comps found
- 3
Show comp detail 3 sales within ~0.75 mi
| Address | Dist | Beds/Ba | Sqft | Sold | Price | $/sf | Match |
|---|---|---|---|---|---|---|---|
| 19 Urban St | 0.00mi | 5/3.0 (+1) | 2,534 (0%) | 8mo | $1,280,000 | $505 | 73 |
| 15 Brook St | 0.06mi | 5/3.0 (+1) | 2,802 (+11%) | 20mo | $1,275,000 | $455 | 43 |
| 14 Richmond Hill Rd | 0.70mi | 5/6.0 (+1) | 2,756 (+9%) | 19mo | $1,625,000 | $590 | 20 |
Match score weights: distance 35% · size 25% · config 20% · recency 20%. Top-matched comps best support the ARV.
Projected returns pro-forma
-3.0% appreciation · 3.0% rent growth · sell at horizon
- IRR
- -8.0%
- Equity multiple
- 0.71×
- Total profit
- $-159,970
- Equity at exit
- $290,751
- IRR
- 1.5%
- Equity multiple
- 1.11×
- Total profit
- $59,542
- Equity at exit
- $168,600
Cash invested: $546,000 (down + closing). Projections, not guarantees.
Landlord ↔ Tenant lean methodology
- Overall (STATE)
- 27 Tenant-Leaning
- State Connecticut
- 27 Tenant-Leaning · D+7
- County
- — inherits STATE
- City
- — inherits STATE
ZIP-level market 06840
- Active inventory
- 165
- Price-to-rent
- 27.0×
Monthly cashflow live
- Estimated rent
- $18,088 medium interval (Pro) →
- Mortgage (P&I)
- −$10,226
- Tax from tax record
- −$790 /mo · $9,478/yr
- Insurance
- −$812
- HOA
- −$0
- Vacancy / Maint / Mgmt
- −$3,798
- Net cashflow
- $2,461
Break-even live
3-unit breakdown (identical units grouped — click to expand)
| Units | Beds | Baths | Est. rent |
|---|---|---|---|
| 3× units | 3 | 3 | $18,087 |
| #1 | 3 | 3 | $6,029 |
| #2 | 3 | 3 | $6,029 |
| #3 | 3 | 3 | $6,029 |
| Total (3 units) | $18,088 | ||
UW: 25.0% down · 7.5% · 30yr · 1.5% tax · 5.0% vac · 8.0% maint · 8.0% mgmt
Financing live
Cash to close
- Down payment
- $487,500
- Closing costs
- $58,500
- Reserves months
- —
- Total cash needed
- —
Loan-product check · same deal, 3 products live
Conventional
25% down · 7.5% · 30yr
- Down + closing
- —
- Monthly P&I
- —
- Monthly cashflow
- —
- DSCR
- —
- Eligible?
- —
Personal DTI + credit; lowest rate.
DSCR
20% down · 8.5% · 30yr
- Down + closing
- —
- Monthly P&I
- —
- Monthly cashflow
- —
- DSCR
- —
- Eligible?
- —
No personal income docs; deal must DSCR.
Hard money
10% down · 12.0% · 12mo
- Down + closing
- —
- Monthly P&I
- —
- Monthly cashflow
- —
- DSCR
- —
- Eligible?
- —
Short-term bridge; refi at stabilization.
Rent comps 7 comps
| Address | Beds | Baths | Sqft | Rent | $/sqft | DOM | Units | Dist |
|---|---|---|---|---|---|---|---|---|
| 112 East Ave New Canaan, CT | 4.0 | 2.5 | 2800 | $6,950 | $2.48 | 3d | 1 | 0.22mi |
| 126 East Ave New Canaan, CT | 3.0 | 1.5 | 2124 | $4,500 | $2.12 | 43d | 1 | 0.23mi |
| 42 Forest St #4 New Canaan, CT | 3.0 | 3.5 | 3290 | $16,000 | $4.86 | 11d | 1 | 0.36mi |
| 138 Millport Ave New Canaan, CT | 3.0 | 1.5 | 1750 | $5,300 | $3.03 | 43d | 1 | 0.55mi |
| 129 Park St New Canaan, CT | 3.0 | 3.0 | 3058 | $6,950 | $2.27 | 3d | 1 | 0.65mi |
| 136 Harrison Ave New Canaan, CT | 4.0 | 3.5 | 3455 | $16,000 | $4.63 | 43d | 1 | 0.66mi |
| 70 Seminary St Unit 1 New Canaan, CT | 3.0 | 4.0 | 2100 | $9,500 | $4.52 | 43d | 1 | 0.72mi |
Listing history 13 events
-
2026-06-18days on market $1,950,000 Active 17 DOM
-
2026-06-17days on market $1,950,000 Active 16 DOM
-
2026-06-16days on market $1,950,000 Active 15 DOM
-
2026-06-15days on market $1,950,000 Active 14 DOM
-
2026-06-13days on market $1,950,000 Active 12 DOM
-
2026-06-10days on market $1,950,000 Active 9 DOM
-
2026-06-09days on market $1,950,000 Active 8 DOM
-
2026-06-08days on market $1,950,000 Active 7 DOM
-
2026-06-07days on market $1,950,000 Active 6 DOM
-
2026-06-05days on market $1,950,000 Active 3 DOM
-
2026-06-03days on market $1,950,000 Active 2 DOM
-
2026-06-02remarks 699-char remark
-
2026-06-02$1,950,000 Active 1 DOM
ⓘ Source: listings_history table (triggers on properties + properties_extension) + one-shot
backfill from property_details.listing_events for pre-trigger history.
Tax reassessment forecast CT · Partial reset (capped growth)
- Current annual tax
- $9,478 · $790/mo
- Projected year-2 tax
- $25,604 · $2,134/mo
- Expected delta
- +$16,126/yr (+$1,344/mo · 170.1%)
ⓘ Screening estimate from a state-policy table — verify with the county assessor before closing.
Climate risk First Street
- Flood 1/10 Low FEMA zone X (unshaded) · 0% chance over 30 yrs
- Wildfire 1/10 Low
- Heat 5/10 Major 7 d/yr ≥99°F today · 16 d/yr by 30 yrs out
- Wind 6/10 Major 59% chance of damaging wind over 30 yrs
- Air quality 4/10 Moderate 3 unhealthy d/yr today · 5 by 30 yrs out
Nearby sold comps map
Loading sold comps map…
Walkable amenities ~0.75 mi
Loading nearby amenities…
Taxation est. · year 1
- Rental income
- $217,056
- − Mortgage interest
- −$109,230
- − Property taxes
- −$9,478
- − Insurance
- −$9,750
- − Repairs & maintenance
- −$17,364
- − Management
- −$17,364
- − Depreciation
- −$56,727
- Taxable loss
- −$2,859
- Est. tax savings @ 24.0%
- +$686
- After-tax cash flow
- $30,220/yr
For passive investors: Depreciation is non-cash, so a rental often shows a tax loss while cash-flowing — sheltering income. Rental losses are passive: they offset passive income freely, and up to $25,000/yr can offset ordinary (W-2) income if you actively participate and your MAGI is under $100k (phasing out to $0 by $150k); unused losses carry forward. On sale, claimed depreciation is recaptured at up to 25%, and gains may owe capital-gains tax (a 1031 exchange can defer both). Figures are a year-1 estimate at your 24.0% rate — not tax advice; consult a CPA.
Schools (NCES district)
- District
- New Canaan School District
- NCES district ID
- 0902700
- Math proficiency
- 81% ▼ -6.00%
- Reading proficiency
- 86% ▼ -4.00%
- Median HH income
- $164,303
- Composite
- 81.47/100
- National rank
- #38
- State rank
- #1 of 153 in CT
Livability — New Canaan
No livability data for this city. (Only ~50 U.S. cities are tracked.)
Census & demographics
- Census place
- New Canaan, CT
- County
- Fairfield County · 765,532 people
- City population
- 20,870
- Metro
- Bridgeport-Stamford-Norwalk, CT
- Population (ZIP)
- 20,870
- Household income
- $250,001
- Rent vs Own
- Severe rent burden
- 261.0
Population outlook (Western Connecticut County) Hauer SSP2
- By 2040
- 685,031
Race, ethnicity, and origin ACS 2023
- Neighborhood character
- Predominantly White (83%)
- Race & ethnicity
- White 83% Two or more races 7% Asian 6% Hispanic / Latino 5% Black 2%
- Common ancestry
- Romanian 5% Lithuanian 4% Italian 2%
- Foreign-born
- 14% · Canada, China, South Korea
- Languages at home
- 85% English-only · Other Indo-European 6% Chinese 2% Spanish 2%
Political lean MEDSL · Western Connecticut
- 2024 margin
- D (+19.1) · D 58.8% · R 39.7% · Other 1.6%
- All cycles
- 2024: D+19.1
Not yet ingested
- Civics
- —
Market trends
- HPI YoY
- ▼ -480.93%
- Current HPI
- 232.5667
- Rent YoY
- —
- Metro
- Bridgeport-Stamford-Norwalk, CT
- State GDP YoY
- ▲ 1.06%
- F500 in state
- 38
Industry mix (Fortune 500 HQ in CT)
| Industry | F500 HQs | Revenue |
|---|---|---|
| Industrial Machinery | 4 | $38B |
|
||
| Insurance | 3 | $71B |
|
||
| Financial Services | 2 | $25B |
|
||
| Transportation / Logistics | 2 | $18B |
|
||
| Healthcare | 1 | $247B |
|
||
| Telecommunications | 1 | $55B |
|
||
Price history
+278.6% since first listed9 events — show timeline
- 2026-05-31 Listed $1,950,000 Smart MLS
- 2025-10-14 Sold (MLS) $1,280,000 Smart MLS
- 2025-10-03 Pending — Smart MLS
- 2025-09-26 Contingent — Smart MLS
- 2025-09-18 Listed $1,150,000 Smart MLS
- 2025-09-12 Coming Soon $1,150,000 Smart MLS
- 2011-04-26 Sold (MLS) $450,000 Smart MLS
- 2011-04-21 Sold (Public Records) $450,000 Public Records
- 2009-09-25 Listed $515,000 Smart MLS
Property tax history
+2.2%/yrLatest (2023): $9,478 · +3.1% YoY. Source: county tax records.
Cash-flow waterfall
monthlySold comps — $/sqft
last 12 mo · ≤1 miLoading sold comps…