190 Adams Rd · Rison, AR
Flood risk No data
- FEMA flood zone
- —
- Chance of flooding over 30 yrs
- —
- Est. flood insurance / yr
- —
Fire risk No data
- Est. fire insurance / yr
- —
Heat risk No data
- Hot days now (above threshold)
- —
- Hot days in 30 yrs
- —
Wind risk No data
- Chance of severe wind over 30 yrs
- —
Air-quality risk No data
- Unhealthy air days now
- —
- Unhealthy air days in 30 yrs
- —
Risk factors via First Street. Map © Google.
Why this score? — see what drove the B+ grade
The composite is a weighted blend of 9 inputs, each scored 0–100. Each bar is that input's sub-score; the figure is the points it added to the 100-point composite (weight × sub-score).
- Cash flow +30.0/30.0
- ARV discount +15.0/15.0
- 1% rule +10.0/10.0
- DSCR +10.0/10.0
- Livability +3.4/5.0
- Schools +3.2/10.0
- Rent growth +2.5/5.0
- Condition / age +2.5/5.0
- Appreciation +0.0/10.0
$40,000
🖨 Deal sheet (PDF) 📄 Offer letter ✓ Due diligence
Listing remarks MLS
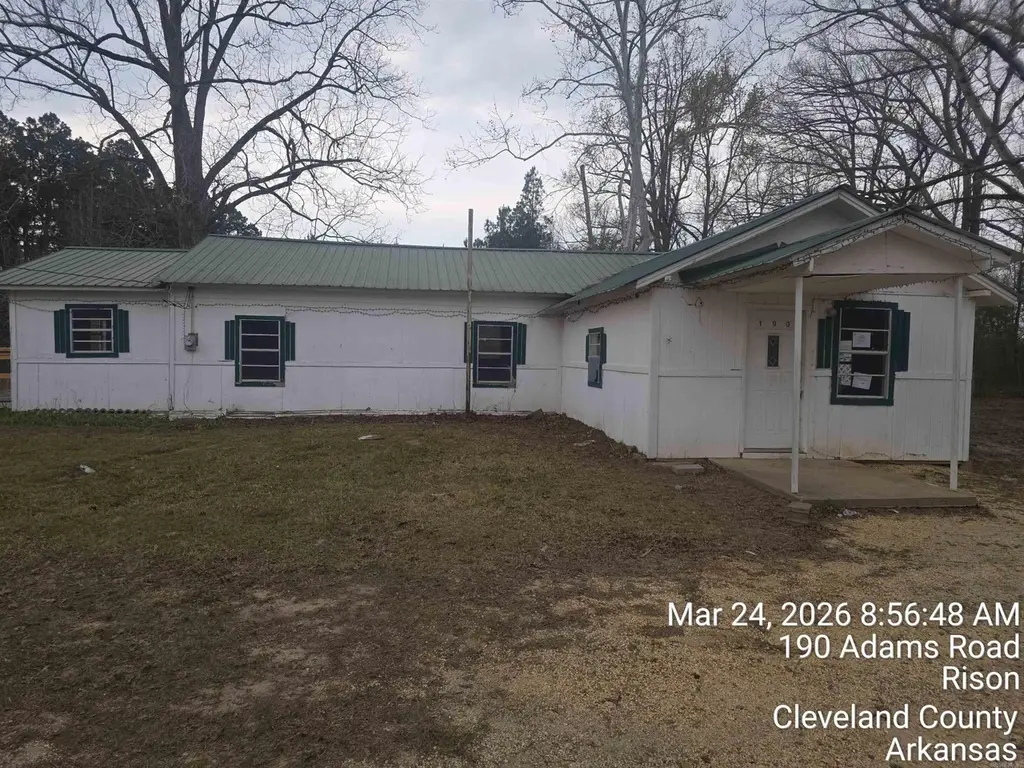
3 bedroom, 2 bath home located on a country road. Property needs repairs and updates. Fixer upper with potential. Sold as-is. AGENTS SEE REMARKS
Key facts
- 2 acre lot
- 2 parking spots
- Built 1955
Neighborhood map
What this means for you Summary
Snapshot
- This is a 3-bed/2.0-bath single-family listed at $40k.
Deal economics
- At list price, monthly cash flow is $600 ($7k/yr) — positive.
- The deal already cash-flows at list — no discount required.
- Meets the 1% rule at list price ($1k rent vs $40k).
- Recommended offer: $39k (3.0% below list) — sets the bar for market timing.
Location & tenants
- Location reads 67/100 on livability (#110 in AR) — a middle-class / working-renter tenant base. Strengths: cost of living A+, health & safety A+, housing A-; Watch: amenities F, commute F, employment F.
- Cleveland County School District (rural): math 40% / reading 36% proficiency, ranked #95 of 238 in AR (top 40%) — families likely to look elsewhere, expect single-tenant / working-renter base with shorter leases.
- Zoned schools: Rison Elementary School (math 47% / reading 32%, grade F, #206 of 454 statewide, top 48%, 377 students, 65% FRL); Rison High School (math 33% / reading 39%, grade F, #81 of 292 statewide, top 29%, 362 students, 51% FRL) — zoned schools at 58% FRL track the district average.
- Market conditions: 34 active listings in the ZIP.
Forward outlook
- Local home prices are declining (-3.0%/yr); year-one equity from $277 of loan paydown is wiped out by about $1k of value loss. Plan a longer hold.
- Cleveland County population projected at -27% by 2050 — secular population decline; favor cash flow + early exit over multi-decade hold.
- At projected returns (-3.0% appreciation + 3.0% rent growth), your $11k cash investment doubles in ~2 years — after that, you're playing with house money.
Negotiation context
- It's been on market 49 days — a 3% lower offer ($39k) is reasonable based on typical stale-listing flexibility.
- 3 sale attempts since 6y ago; this cycle's ask has dropped $5k (11%) from the opening price — seller is motivated, your offer sets the floor, not the list.
Risks & watch-outs
- Watch-outs: built in 1955 — expect roof / HVAC / electrical / plumbing capex.
Questions for the listing agent
- It's been on market 49 days. Have you received any prior offers? Is the seller open to a 3% concession, seller financing, or rate buy-down credit?
- Built in 1955 — when were the roof, HVAC, electrical panel, plumbing, and water heater last replaced?
- Is there a deadline driving the sale (1031 exchange, divorce, estate, relocation)? That informs how much negotiation room exists.
- Schools are D-rated, which usually means shorter tenancies and higher turnover. Who's the typical renter profile here, and what's been the actual vacancy rate?
- What's the average days-on-market for RENTAL listings here right now (not sales)? A rising rental-DOM trend means longer vacancies and softer asking-rent achievability than the comps imply.
- What's the recent tenant-quality profile in this submarket — average credit score on applications, eviction rate, late-payment / NSF rate, and stable-employment percentage? A property-management company in the area should have these aggregated.
- How much new for-sale + rental construction is in the pipeline within 1–3 miles? Heavy new supply typically softens prices + rents 12–24 months out; constrained supply supports both.
Investment metrics
- 1% rule
- 2.77% ✓
- Cap rate
- 24.29%
- Cash-on-cash
- 64.27%
- DSCR
- 3.86
- GRM
- 3.0
CMA / ARV
- ARV (median comp)
- $65,070
- List price
- $40,000
- Delta
- -38.53%
- Verdict
- UNDERPRICED
- Comps
- 3 within 1.0 mi
Projected returns pro-forma
-3.0% appreciation · 3.0% rent growth · sell at horizon
- IRR
- 63.4%
- Equity multiple
- 3.83×
- Total profit
- $31,739
- Equity at exit
- $5,964
- IRR
- 67.8%
- Equity multiple
- 7.87×
- Total profit
- $76,900
- Equity at exit
- $3,458
Cash invested: $11,200 (down + closing). Projections, not guarantees.
Landlord ↔ Tenant lean methodology
- Overall (STATE)
- 92 Strongly Landlord-Friendly
- State Arkansas
- 92 Strongly Landlord-Friendly · R+14
- County
- — inherits STATE
- City
- — inherits STATE
ZIP-level market 71665
- Home prices YoY
- -28.3%
- Active inventory
- 34
- Price-to-rent
- 3.0×
Monthly cashflow live
- Estimated rent
- $1,109 medium interval (Pro) →
- Mortgage (P&I)
- −$210
- Tax from tax record
- −$50 /mo · $599/yr
- Insurance
- −$17
- HOA
- −$0
- Vacancy / Maint / Mgmt
- −$233
- Net cashflow
- $600
Break-even live
Sensitivity live
| Price | -10% $622 | -5% $611 | +0% $600 | +5% $589 | +10% $577 |
|---|---|---|---|---|---|
| Rent | -10% $512 | -5% $556 | +0% $600 | +5% $644 | +10% $687 |
| Rate | -1.0pp $620 | -0.5pp $610 | base $600 | +0.5pp $589 | +1.0pp $579 |
UW: 25.0% down · 7.5% · 30yr · 1.5% tax · 5.0% vac · 8.0% maint · 8.0% mgmt
Financing live
Cash to close
- Down payment
- $10,000
- Closing costs
- $1,200
- Reserves months
- —
- Total cash needed
- —
Loan-product check · same deal, 3 products live
Conventional
25% down · 7.5% · 30yr
- Down + closing
- —
- Monthly P&I
- —
- Monthly cashflow
- —
- DSCR
- —
- Eligible?
- —
Personal DTI + credit; lowest rate.
DSCR
20% down · 8.5% · 30yr
- Down + closing
- —
- Monthly P&I
- —
- Monthly cashflow
- —
- DSCR
- —
- Eligible?
- —
No personal income docs; deal must DSCR.
Hard money
10% down · 12.0% · 12mo
- Down + closing
- —
- Monthly P&I
- —
- Monthly cashflow
- —
- DSCR
- —
- Eligible?
- —
Short-term bridge; refi at stabilization.
Listing history 9 events
-
2026-05-13status Under Contract 144-char remark
Show marketing remark (144 chars)
3 bedroom, 2 bath home located on a country road. Property needs repairs and updates. Fixer upper with potential. Sold as-is. AGENTS SEE REMARKS
-
2026-05-01price $40,000 144-char remark
Show marketing remark (144 chars)
3 bedroom, 2 bath home located on a country road. Property needs repairs and updates. Fixer upper with potential. Sold as-is. AGENTS SEE REMARKS
-
2026-03-24$45,000 New Listing 144-char remark
Show marketing remark (144 chars)
3 bedroom, 2 bath home located on a country road. Property needs repairs and updates. Fixer upper with potential. Sold as-is. AGENTS SEE REMARKS
-
2021-09-07soldstatus $85,000
-
2020-08-21historical
-
2020-07-31$97,900 New Listing
-
2020-07-20historical
-
2020-06-30$94,900 New Listing
-
2005-01-21soldstatus $38,000
ⓘ Source: listings_history table (triggers on properties + properties_extension) + one-shot
backfill from property_details.listing_events for pre-trigger history.
Tax reassessment forecast AR · Resets to sale price
- Current annual tax
- $599 · $50/mo
- Projected year-2 tax
- $599 · $50/mo
- Expected delta
- $0/yr ($0/mo · 0.0%)
ⓘ Screening estimate from a state-policy table — verify with the county assessor before closing.
Nearby sold comps map
Loading sold comps map…
Walkable amenities ~0.75 mi
Loading nearby amenities…
Taxation est. · year 1
- Rental income
- $13,309
- − Mortgage interest
- −$2,241
- − Property taxes
- −$599
- − Insurance
- −$200
- − Repairs & maintenance
- −$1,065
- − Management
- −$1,065
- − Depreciation
- −$1,164
- Taxable income
- $6,976
- Est. tax owed @ 24.0%
- −$1,674
- After-tax cash flow
- $5,524/yr
For passive investors: Depreciation is non-cash, so a rental often shows a tax loss while cash-flowing — sheltering income. Rental losses are passive: they offset passive income freely, and up to $25,000/yr can offset ordinary (W-2) income if you actively participate and your MAGI is under $100k (phasing out to $0 by $150k); unused losses carry forward. On sale, claimed depreciation is recaptured at up to 25%, and gains may owe capital-gains tax (a 1031 exchange can defer both). Figures are a year-1 estimate at your 24.0% rate — not tax advice; consult a CPA.
Schools (NCES district)
- District
- Cleveland County School District
- NCES district ID
- 0500067
- Math proficiency
- 40% ▼ -8.00%
- Reading proficiency
- 36% ▼ -8.00%
- Median HH income
- $37,028
- Composite
- 31.62/100
- National rank
- #5939
- State rank
- #95 of 238 in AR
Livability — Rison
- Score
- 67/100
- State rank
- #110
- US rank
- #11095
Category grades
Schools grade is shown separately in the Schools card above.
Census & demographics
- Population (ZIP)
- 4,889
Population outlook (Cleveland County) Hauer SSP2
- Today (2025)
- 7,657 people
- By 2030
- 7,246 · -5.4%
- By 2040
- 6,391 · -16.5%
- By 2050
- 5,612 · -26.7%
- By 2075
- 4,230 · -44.8%
- By 2100
- 3,389 · -55.7%
Race, ethnicity, and origin ACS 2023
- Neighborhood character
- Predominantly White (87%)
- Race & ethnicity
- White 87% Black 9% Two or more races 4%
- Common ancestry
- Lithuanian 1% Slovak 1% Italian 1%
- Foreign-born
- 0% · Canada
- Languages at home
- 99% English-only · Spanish 1% French/Haitian/Cajun 1%
Political lean MEDSL · Cleveland
- 2024 margin
- Solid R (+67.6) · D 15.5% · R 83.1% · Other 1.4%
- 2008→2024 swing
- -23.6pp toward R · 2008: -43.9pp · 2024: -67.6pp
- All cycles
- 2024: R+67.6 2020: R+61.6 2016: R+52.6 2012: R+45.0 2008: R+43.9
Not yet ingested
- Civics
- —
Market trends
- HPI YoY
- ▼ -49.03%
- Current HPI
- 124.3335
- Rent YoY
- —
- Metro
- —
- State GDP YoY
- ▲ 3.80%
- F500 in state
- 10
Industry mix (Fortune 500 HQ in AR)
| Industry | F500 HQs | Revenue |
|---|---|---|
| Retail | 1 | $681B |
|
||
| Food / Agriculture | 1 | $53B |
|
||
| Retail / Energy | 1 | $22B |
|
||
| Transportation / Logistics | 1 | $12B |
|
||
| Energy | 1 | $4B |
|
||
Price history
+5.3% since first listed9 events — show timeline
- 2026-05-13 Pending — CARMLS
- 2026-05-01 Price Changed $40,000 CARMLS
- 2026-03-24 Listed $45,000 CARMLS
- 2021-09-07 Sold (Public Records) $85,000 Public Records
- 2020-08-21 Listing Removed — CARMLS
- 2020-07-31 Listed $97,900 CARMLS
- 2020-07-20 Listing Removed — CARMLS
- 2020-06-30 Listed $94,900 CARMLS
- 2005-01-21 Sold (Public Records) $38,000 Public Records
Property tax history
+27.3%/yrLatest (2025): $599 · +784.2% YoY. Source: county tax records.
Cash-flow waterfall
monthlySold comps — $/sqft
last 12 mo · ≤1 miLoading sold comps…