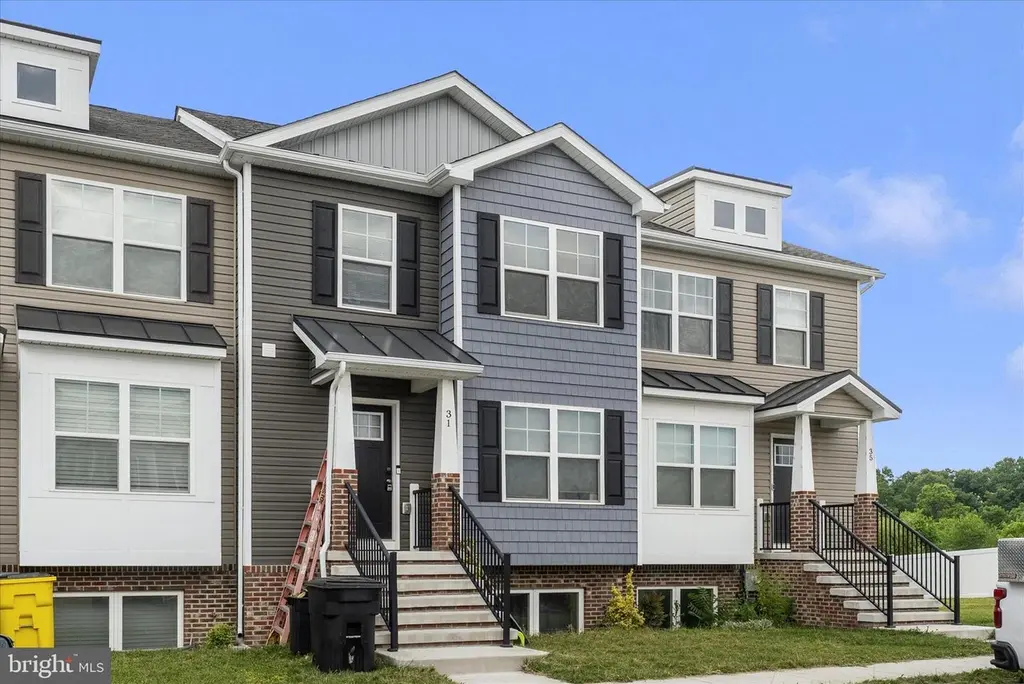
31 Moses Dr · Martinsburg, WV
Flood risk No data
- FEMA flood zone
- —
- Chance of flooding over 30 yrs
- —
- Est. flood insurance / yr
- —
Fire risk No data
- Est. fire insurance / yr
- —
Heat risk No data
- Hot days now (above threshold)
- —
- Hot days in 30 yrs
- —
Wind risk No data
- Chance of severe wind over 30 yrs
- —
Air-quality risk No data
- Unhealthy air days now
- —
- Unhealthy air days in 30 yrs
- —
Risk factors via First Street. Map © Google.
Why this score? — see what drove the D grade
The composite is a weighted blend of 9 inputs, each scored 0–100. Each bar is that input's sub-score; the figure is the points it added to the 100-point composite (weight × sub-score).
- Cash flow +10.0/30.0
- ARV discount +10.0/15.0
- Appreciation +6.9/10.0
- Livability +3.8/5.0
- DSCR +2.8/10.0
- Schools +2.6/10.0
- Rent growth +2.5/5.0
- Condition / age +2.5/5.0
- 1% rule +2.1/10.0
$315,000
🖨 Deal sheet (PDF) 📄 Offer letter ✓ Due diligence
Listing remarks MLS
Energy Efficient homes with natural gas heating systems. .. .New 4 bedroom, 3.5 bath English Basement Town Homes under construction in Heritage Hills. Features include 4th bedroom and full bath with spacious family room in lower level, Luxury Vinyl Plank throughout the main level, large living room w/ bump out and ceiling fan, kitchen with granite countertops, center island, pantry, and island bar, and upper level offering 3 bedrooms including primary bedroom with vaulted ceilings, walk in closet, and full bath w/ tile shower & glass door. Exterior features bump outs on both main level and bedroom level, brick on fronts, and covered entry porch. Free 10x12 deck included!
Key facts
- $17 HOA
- 2 parking spots
- Built 2022
Property features AI
Finance
- HOA & community: HOA fee of $200 annually
Exterior
- Parking: Assigned parking in a parking lot (2 assigned spaces)
- Utilities: Public water; Public sewer; Electric hot water; Natural gas heating fuel; Electric cooling
- Home design: Interior townhouse/rowhouse; Not in a federal flood zone; Fee simple ownership
- Construction: Estimated year built; Advanced framing; Brick front; Stick built construction; Architectural shingle roof; Permanent foundation; Above-grade structure; Energy-efficient casement windows
- Exterior features: Bump-outs; Sidewalks; Street lights; Deck(s)
Interior
- Kitchen: Built-in microwave; Dishwasher; Refrigerator; Stove; Stainless steel appliances
- Bedrooms: Three bedrooms on the upper level; One bedroom on the lower level
- Flooring: Luxury vinyl plank; Carpet
- Bathrooms: Two full bathrooms on the upper level; One full bathroom on the lower level; One half bathroom on the main level; Three full bathrooms total; One half bathroom total
- Heating & cooling: Forced air heating; Central air conditioning
- Interior features: Ceiling fans; Open floor plan; Combination kitchen and dining area; Kitchen island; Pantry; Master bathroom; Recessed lighting; Sprinkler system; Upgraded countertops; Walk-in closets; Vaulted ceilings
Neighborhood map
What this means for you Summary
Snapshot
- This is a 4-bed/3.5-bath townhouse listed at $315k.
Deal economics
- At list price, monthly cash flow is $-192 ($-2k/yr) — negative.
- To cash-flow at today's rent, offer at most $281k (10.8% below list).
- To meet the 1% rule (rent ≥ 1% of price), the offer needs to be $225k (28.6% below list).
- Recommended offer: $225k (28.6% below list) — sets the bar for 1% rule.
- Cap rate 5.6% vs local median 3.8% in Martinsburg — top-decile yield for the area; either an underpriced asset or a hidden risk that comps aren't pricing in. Stress-test before assuming the spread holds.
Location & tenants
- Location reads 75/100 on livability (#29 in WV, #4,057 nationally) — a middle-class / working-renter tenant base. Strengths: amenities A+, cost of living A+, housing A+; Watch: commute F, employment D-.
- Berkeley County Schools (other): math 21% / reading 38% proficiency, ranked #24 of 55 in WV (top 44%) — low school quality limits family demand, transient renter base, plan for 1-2y turnover.
- Market conditions: 121 active listings in the ZIP; 1 comparable units currently listed for rent nearby; 1,460 units permitted in Berkeley County in 2024 (16 in 5+ unit buildings).
Forward outlook
- In year one you build about $14k of equity ($2k loan paydown + $12k appreciation (3.8% local appreciation)).
- Berkeley County population projected at +25% by 2050 — long-run rental-demand tailwind backs the buy-and-hold thesis.
- By year 3, paydown + projected appreciation supports a ~$35k cash-out refi (75% LTV) — recoverable capital for the next deal without selling this one.
Negotiation context
- It's been on market 16 days — a 2% lower offer ($310k) is reasonable based on typical stale-listing flexibility.
- 3 sale attempts since 4y ago; this cycle's ask is 13900% above the opening price — seller raised mid-cycle; expect resistance to lowballs.
Questions for the listing agent
- What do current leases actually rent for vs. the listed asking? Can we see a recent rent roll and the last 12 months of T-12 income?
- What does the HOA fee cover, when was the last increase, and are there any pending special assessments or reserve-fund shortfalls?
- Is there a deadline driving the sale (1031 exchange, divorce, estate, relocation)? That informs how much negotiation room exists.
- The area grade is low — what's the realistic commute time and amenity access for the typical tenant pool here? Any planned neighborhood developments (good or bad) we should know about?
- What's the average days-on-market for RENTAL listings here right now (not sales)? A rising rental-DOM trend means longer vacancies and softer asking-rent achievability than the comps imply.
- What's the recent tenant-quality profile in this submarket — average credit score on applications, eviction rate, late-payment / NSF rate, and stable-employment percentage? A property-management company in the area should have these aggregated.
- How much new for-sale + rental construction is in the pipeline within 1–3 miles? Heavy new supply typically softens prices + rents 12–24 months out; constrained supply supports both.
Investment metrics
- 1% rule
- 0.71% ✗
- Cap rate
- 5.56%
- Cash-on-cash
- -2.62%
- DSCR
- 0.88
- GRM
- 11.7
CMA / ARV
- ARV (on-the-fly)
- $333,164
- Comps found
- 10
Show comp detail 10 sales within ~0.75 mi
| Address | Dist | Beds/Ba | Sqft | Sold | Price | $/sf | Match |
|---|---|---|---|---|---|---|---|
| 7 Moses | 0.02mi | 4/3.5 | 2,236 (0%) | 2mo | $300,000 | $134 | 97 |
| 23 Moses Dr | 0.01mi | 4/3.5 | 2,175 (-3%) | 10mo | $290,000 | $133 | 86 |
| 35 Moses Dr | 0.00mi | 4/3.5 | 2,075 (-7%) | 19mo | $309,900 | $149 | 72 |
| 90 Moses Dr | 0.06mi | 4/3.0 | 1,915 (-14%) | 7mo | $298,500 | $156 | 65 |
| 98 Moses Dr | 0.07mi | 4/3.0 | 1,915 (-14%) | 8mo | $298,500 | $156 | 64 |
| 106 Moses Dr | 0.08mi | 4/3.0 | 1,915 (-14%) | 12mo | $298,500 | $156 | 61 |
| 114 Moses Dr | 0.08mi | 4/3.0 | 1,915 (-14%) | 12mo | $305,000 | $159 | 60 |
| 32 Marineris Cir | 0.32mi | 3/2.5 (-1) | 1,956 (-12%) | 19mo | $268,000 | $137 | 40 |
| 28 Marineris Cir | 0.32mi | 3/2.5 (-1) | 1,932 (-14%) | 21mo | $280,900 | $145 | 36 |
| 109 Kensington Ter | 0.75mi | 3/3.0 (-1) | 1,972 (-12%) | 21mo | $260,000 | $132 | 21 |
Match score weights: distance 35% · size 25% · config 20% · recency 20%. Top-matched comps best support the ARV.
Projected returns pro-forma
3.84% appreciation · 3.0% rent growth · sell at horizon
- IRR
- 7.5%
- Equity multiple
- 1.45×
- Total profit
- $39,870
- Equity at exit
- $156,810
- IRR
- 9.8%
- Equity multiple
- 2.61×
- Total profit
- $141,998
- Equity at exit
- $254,188
Cash invested: $88,200 (down + closing). Projections, not guarantees.
Landlord ↔ Tenant lean methodology
- Overall (STATE)
- 83 Strongly Landlord-Friendly
- State West Virginia
- 83 Strongly Landlord-Friendly · R+22
- County
- — inherits STATE
- City
- — inherits STATE
ZIP-level market 25405
- Home prices YoY
- 1.9%
- Active inventory
- 121
- Price-to-rent
- 11.7×
Monthly cashflow live
- Estimated rent
- $2,250 medium interval (Pro) →
- Mortgage (P&I)
- −$1,652
- Tax from tax record
- −$170 /mo · $2,035/yr
- Insurance
- −$131
- HOA
- −$17
- Vacancy / Maint / Mgmt
- −$472
- Net cashflow
- $-192
Break-even live
Sensitivity live
| Price | -10% $-14 | -5% $-103 | +0% $-192 | +5% $-281 | +10% $-371 |
|---|---|---|---|---|---|
| Rent | -10% $-370 | -5% $-281 | +0% $-192 | +5% $-103 | +10% $-14 |
| Rate | -1.0pp $-34 | -0.5pp $-112 | base $-192 | +0.5pp $-274 | +1.0pp $-357 |
UW: 25.0% down · 7.5% · 30yr · 1.5% tax · 5.0% vac · 8.0% maint · 8.0% mgmt
Financing live
Cash to close
- Down payment
- $78,750
- Closing costs
- $9,450
- Reserves months
- —
- Total cash needed
- —
Loan-product check · same deal, 3 products live
Conventional
25% down · 7.5% · 30yr
- Down + closing
- —
- Monthly P&I
- —
- Monthly cashflow
- —
- DSCR
- —
- Eligible?
- —
Personal DTI + credit; lowest rate.
DSCR
20% down · 8.5% · 30yr
- Down + closing
- —
- Monthly P&I
- —
- Monthly cashflow
- —
- DSCR
- —
- Eligible?
- —
No personal income docs; deal must DSCR.
Hard money
10% down · 12.0% · 12mo
- Down + closing
- —
- Monthly P&I
- —
- Monthly cashflow
- —
- DSCR
- —
- Eligible?
- —
Short-term bridge; refi at stabilization.
Rent comps 1 comps
| Address | Beds | Baths | Sqft | Rent | $/sqft | DOM | Units | Dist |
|---|---|---|---|---|---|---|---|---|
| 47 Pikeview Dr Martinsburg, WV | 3.0 | 2.5 | 2146 | $2,250 | $1.05 | 23d | 1 | 1.30mi |
HOA detail
- Monthly dues
- $17 · $204/yr
- Likely covers
- gas
Listing history 12 events
-
2026-06-22days on market $315,000 Active 16 DOM
-
2026-06-18days on market $315,000 Active 13 DOM
-
2026-06-17days on market $315,000 Active 12 DOM
-
2026-06-16days on market $315,000 Active 11 DOM
-
2026-06-15days on market $315,000 Active 10 DOM
-
2026-06-14days on market $315,000 Active 8 DOM
-
2026-06-13days on market $315,000 Active 7 DOM
-
2026-06-10days on market $315,000 Active 5 DOM
-
2026-06-09days on market $315,000 Active 4 DOM
-
2026-06-08days on market $315,000 Active 3 DOM
-
2026-06-07remarks 699-char remark
-
2026-06-07$315,000 Active 2 DOM
ⓘ Source: listings_history table (triggers on properties + properties_extension) + one-shot
backfill from property_details.listing_events for pre-trigger history.
Tax reassessment forecast WV · Resets to sale price
- Current annual tax
- $2,035 · $170/mo
- Projected year-2 tax
- $2,035 · $170/mo
- Expected delta
- $0/yr ($0/mo · 0.0%)
ⓘ Screening estimate from a state-policy table — verify with the county assessor before closing.
Nearby sold comps map
Loading sold comps map…
Walkable amenities ~0.75 mi
Loading nearby amenities…
Taxation est. · year 1
- Rental income
- $27,000
- − Mortgage interest
- −$17,645
- − Property taxes
- −$2,035
- − Insurance
- −$1,575
- − Repairs & maintenance
- −$2,160
- − Management
- −$2,160
- − HOA
- −$204
- − Depreciation
- −$9,164
- Taxable loss
- −$7,943
- Est. tax savings @ 24.0%
- +$1,906
- After-tax cash flow
- $-401/yr
For passive investors: Depreciation is non-cash, so a rental often shows a tax loss while cash-flowing — sheltering income. Rental losses are passive: they offset passive income freely, and up to $25,000/yr can offset ordinary (W-2) income if you actively participate and your MAGI is under $100k (phasing out to $0 by $150k); unused losses carry forward. On sale, claimed depreciation is recaptured at up to 25%, and gains may owe capital-gains tax (a 1031 exchange can defer both). Figures are a year-1 estimate at your 24.0% rate — not tax advice; consult a CPA.
Schools (NCES district)
- District
- Berkeley County Schools
- NCES district ID
- 5400060
- Math proficiency
- 21% ▼ -12.00%
- Reading proficiency
- 38% ▼ -6.00%
- Median HH income
- $54,599
- Composite
- 26.16/100
- National rank
- #7273
- State rank
- #24 of 55 in WV
Livability — Martinsburg
- Score
- 75/100
- State rank
- #29
- US rank
- #4057
Category grades
Schools grade is shown separately in the Schools card above.
Census & demographics
- City population
- 55,439
- Population (ZIP)
- 14,993
Population outlook (Berkeley County) Hauer SSP2
- Today (2025)
- 127,359 people
- By 2030
- 134,684 · +5.8%
- By 2040
- 148,219 · +16.4%
- By 2050
- 159,300 · +25.1%
- By 2075
- 179,920 · +41.3%
- By 2100
- 183,896 · +44.4%
Race, ethnicity, and origin ACS 2023
- Neighborhood character
- Predominantly White (84%)
- Race & ethnicity
- White 84% Black 6% Hispanic / Latino 5% Two or more races 5%
- Hispanic origin (detail)
- Puerto Rican 1% Dominican 1%
- Common ancestry
- Italian 4% Scotch-Irish 3% Slovak 2%
- Foreign-born
- 6% · Canada, South Korea
- Languages at home
- 93% English-only · Spanish 4% Other Indo-European 1%
Political lean MEDSL · Berkeley
- 2024 margin
- Solid R (+35.8) · D 31.2% · R 67.0% · Other 1.8%
- 2008→2024 swing
- -22.8pp toward R · 2008: -13.0pp · 2024: -35.8pp
- All cycles
- 2024: R+35.8 2020: R+31.2 2016: R+37.2 2012: R+21.3 2008: R+13.0
Not yet ingested
- Civics
- —
Market trends
- HPI YoY
- ▲ 3.84%
- Current HPI
- 204.0128
- Rent YoY
- —
- Metro
- —
- State GDP YoY
- —
- F500 in state
- 0
Price history
-99.2% since first listed7 events — show timeline
- 2026-06-07 Listed for Rent $2,250 BRIGHTMLS
- 2026-06-06 Listed $315,000 BRIGHT MLS
- 2026-06-05 Coming Soon $315,000 BRIGHT MLS
- 2022-07-29 Sold (MLS) $283,500 BRIGHT MLS
- 2022-05-16 Price Changed $283,500 BRIGHT MLS
- 2022-05-16 Contingent — BRIGHT MLS
- 2022-04-26 Listed $278,500 BRIGHT MLS
Property tax history
+65.5%/yrLatest (2025): $2,035 · +0.0% YoY. Source: county tax records.
Cash-flow waterfall
monthlySold comps — $/sqft
last 12 mo · ≤1 miLoading sold comps…