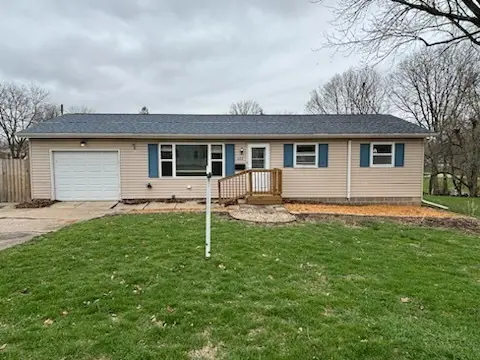
402 NE 2nd Ave · Galva, IL
Flood risk 1/10 · Minimal
- FEMA flood zone
- X (unshaded)
- Chance of flooding over 30 yrs
- 0.0%
- Est. flood insurance / yr
- $507 – $1,088
Fire risk 1/10 · Minimal
- Est. fire insurance / yr
- $804 – $1,492
Heat risk 3/10 · Minor
- Hot days now (above 104°F)
- 7 days/yr
- Hot days in 30 yrs
- 17 days/yr
Wind risk 2/10 · Minimal
- Chance of severe wind over 30 yrs
- 0.0%
Air-quality risk 3/10 · Minor
- Unhealthy air days now
- 2 days/yr
- Unhealthy air days in 30 yrs
- 3 days/yr
Risk factors via First Street. Map © Google.
Why this score? — see what drove the C- grade
The composite is a weighted blend of 9 inputs, each scored 0–100. Each bar is that input's sub-score; the figure is the points it added to the 100-point composite (weight × sub-score).
- Cash flow +23.7/30.0
- DSCR +7.6/10.0
- 1% rule +6.7/10.0
- Appreciation +5.8/10.0
- Livability +3.4/5.0
- Rent growth +2.5/5.0
- Condition / age +2.5/5.0
- Schools +1.4/10.0
- ARV discount +0.0/15.0
$82,900
🖨 Deal sheet 📄 Offer letter ✓ Due diligence
Listing remarks MLS
Updated one story home, w/ 1 car attached garage & 10 x 12 storage shed. Home features: living room, open kitchen/dining room w/ S.S. appliances, laundry area, full bath w/tub shower combo & 3 bedrooms. Lots of updates in last 2 yrs, per the seller: New roof, vinyl siding, gutters, flooring & paint through-out, kitchen counter-tops, newer s.s. refrigerator, gas stove, range hood, ceiling fans, total bathroom remodel, replaced water meter, new access panel for washer & dryer, roof vent, plumbing under bathroom sink, front entry door & garage service door. Window blinds all stay & living room curtains. Nothing to do but move in!
Key facts
- 7,840 sq ft lot
- Garage
- Built 1971
Neighborhood map
What this means for you Summary
Snapshot
- This is a 3-bed/1.0-bath single-family listed at $83k.
Deal economics
- At list price, monthly cash flow is $158 ($2k/yr) — positive.
- The deal already cash-flows at list — no discount required.
- Meets the 1% rule at list price ($966 rent vs $83k).
- Recommended offer: $78k (6.0% below list) — sets the bar for market timing.
Location & tenants
- Location reads 67/100 on livability (#497 in IL) — a middle-class / working-renter tenant base. Strengths: cost of living A+, crime A, housing A-; Watch: employment D+, schools F, amenities F.
- Galva CUSD 224 (rural): math 18% / reading 14% proficiency, ranked #497 of 620 in IL (top 80%) — low school quality limits family demand, transient renter base, plan for 1-2y turnover.
- Market conditions: 22 active listings in the ZIP; 32 units permitted in Henry County in 2024 (0 in 5+ unit buildings).
Forward outlook
- In year one you build about $2k of equity ($573 loan paydown + $1k appreciation (1.7% local appreciation)).
- Henry County population projected at -16% by 2050 — secular population decline; favor cash flow + early exit over multi-decade hold.
- At projected returns (1.7% appreciation + 3.0% rent growth), your $23k cash investment doubles in ~6 years — after that, you're playing with house money.
Negotiation context
- It's been on market 77 days — a 6% lower offer ($78k) is reasonable based on typical stale-listing flexibility.
- 3 sale attempts since 7y ago; this cycle's ask has dropped $7k (8%) from the opening price — seller is motivated, your offer sets the floor, not the list.
- Current owner paid $55k; list at $83k implies a 51% gain — meaningful room to come down on a strong offer.
Questions for the listing agent
- It's been on market 77 days. Have you received any prior offers? Is the seller open to a 6% concession, seller financing, or rate buy-down credit?
- Built in 1971 — when were the roof, HVAC, electrical panel, plumbing, and water heater last replaced?
- Why hasn't it sold? Are there any deal-killer items the seller is aware of (foundation, flood, title, zoning, code violations)?
- Is there a deadline driving the sale (1031 exchange, divorce, estate, relocation)? That informs how much negotiation room exists.
- Schools are F-rated, which usually means shorter tenancies and higher turnover. Who's the typical renter profile here, and what's been the actual vacancy rate?
- What's the average days-on-market for RENTAL listings here right now (not sales)? A rising rental-DOM trend means longer vacancies and softer asking-rent achievability than the comps imply.
- What's the recent tenant-quality profile in this submarket — average credit score on applications, eviction rate, late-payment / NSF rate, and stable-employment percentage? A property-management company in the area should have these aggregated.
- How much new for-sale + rental construction is in the pipeline within 1–3 miles? Heavy new supply typically softens prices + rents 12–24 months out; constrained supply supports both.
Investment metrics
- 1% rule
- 1.17% ✓
- Cap rate
- 8.58%
- Cash-on-cash
- 8.16%
- DSCR
- 1.36
- GRM
- 7.1
CMA / ARV
- ARV (median comp)
- $66,577
- List price
- $82,900
- Delta
- 24.52%
- Verdict
- OVERPRICED
- Comps
- 18 within 1.0 mi
Show comp detail 10 sales within ~0.75 mi
| Address | Dist | Beds/Ba | Sqft | Sold | Price | $/sf | Match |
|---|---|---|---|---|---|---|---|
| 116 NW 3rd St | 0.24mi | 2/1.0 (-1) | 976 (+2%) | 9mo | $59,900 | $61 | 73 |
| 116 NW 3rd St | 0.24mi | 2/1.0 (-1) | 976 (+2%) | 9mo | $59,900 | $61 | 73 |
| 800 NW 1st Ave | 0.31mi | 2/1.0 (-1) | 960 (0%) | 18mo | $55,000 | $57 | 66 |
| 800 NW 1st Ave | 0.31mi | 2/1.0 (-1) | 960 (0%) | 18mo | $55,000 | $57 | 66 |
| 514 SW 1st Ave | 0.67mi | 3/1.5 | 930 (-3%) | 17mo | $70,000 | $75 | 48 |
| 804 SE 1st St | 0.52mi | 3/1.5 | 1,084 (+13%) | 10mo | $140,000 | $129 | 44 |
| 804 SE 1st St | 0.52mi | 3/1.5 | 1,084 (+13%) | 10mo | $140,000 | $129 | 44 |
| 101 NE Eight Ave | 0.45mi | 2/1.0 (-1) | 1,073 (+12%) | 13mo | $85,000 | $79 | 43 |
| 424 SE 7th Ave | 0.70mi | 3/1.5 | 922 (-4%) | 21mo | $135,000 | $146 | 41 |
| 424 SE 7th Ave | 0.70mi | 3/1.5 | 922 (-4%) | 21mo | $135,000 | $146 | 41 |
Match score weights: distance 35% · size 25% · config 20% · recency 20%. Top-matched comps best support the ARV.
Projected returns pro-forma
1.67% appreciation · 3.0% rent growth · sell at horizon
- IRR
- 11.7%
- Equity multiple
- 1.62×
- Total profit
- $14,375
- Equity at exit
- $31,210
- IRR
- 14.8%
- Equity multiple
- 2.92×
- Total profit
- $44,637
- Equity at exit
- $43,827
Cash invested: $23,212 (down + closing). Projections, not guarantees.
Landlord ↔ Tenant lean methodology
- Overall (STATE)
- 43 Moderately Tenant-Leaning
- State Illinois
- 43 Moderately Tenant-Leaning · D+7
- County
- — inherits STATE
- City
- — inherits STATE
ZIP-level market 61434
- Home prices YoY
- 1.2%
- Active inventory
- 22
- Price-to-rent
- 7.1×
Monthly cashflow live
- Estimated rent
- $966 medium interval (Pro) →
- Mortgage (P&I)
- −$435
- Tax from tax record
- −$136 /mo · $1,636/yr
- Insurance
- −$35
- HOA
- −$0
- Vacancy / Maint / Mgmt
- −$203
- Net cashflow
- $158
Break-even live
UW: 25.0% down · 7.5% · 30yr · 1.5% tax · 5.0% vac · 8.0% maint · 8.0% mgmt
Financing live
Cash to close
- Down payment
- $20,725
- Closing costs
- $2,487
- Reserves months
- —
- Total cash needed
- —
Loan-product check · same deal, 3 products live
Conventional
25% down · 7.5% · 30yr
- Down + closing
- —
- Monthly P&I
- —
- Monthly cashflow
- —
- DSCR
- —
- Eligible?
- —
Personal DTI + credit; lowest rate.
DSCR
20% down · 8.5% · 30yr
- Down + closing
- —
- Monthly P&I
- —
- Monthly cashflow
- —
- DSCR
- —
- Eligible?
- —
No personal income docs; deal must DSCR.
Hard money
10% down · 12.0% · 12mo
- Down + closing
- —
- Monthly P&I
- —
- Monthly cashflow
- —
- DSCR
- —
- Eligible?
- —
Short-term bridge; refi at stabilization.
Listing history 23 events
-
2026-06-18days on market $82,900 Active 77 DOM
-
2026-06-17days on market $82,900 Active 76 DOM
-
2026-06-16days on market $82,900 Active 75 DOM
-
2026-06-15days on market $82,900 Active 74 DOM
-
2026-06-13days on market $82,900 Active 72 DOM
-
2026-06-12days on market $82,900 Active 71 DOM
-
2026-06-09days on market $82,900 Active 68 DOM
-
2026-06-09price $82,900 Active 67 DOM
-
2026-06-08days on market $84,900 Active 67 DOM
-
2026-06-07days on market $84,900 Active 66 DOM
-
2026-06-05days on market $84,900 Active 64 DOM
-
2026-06-04days on market $84,900 Active 62 DOM
-
2026-06-02days on market $84,900 Active 61 DOM
-
2026-06-01days on market $84,900 Active 60 DOM
-
2026-05-31days on market $84,900 Active 59 DOM
-
2026-05-31days on market $84,900 Active 58 DOM
-
2026-05-01price $84,900
-
2026-04-02$89,900 Active
-
2019-08-02soldstatus $55,000
-
2019-07-31soldstatus $55,000 658-char remark
Show marketing remark (658 chars)
Updated one story home, w/ 1 car attached garage & 10 x 12 storage shed. Home features: living room, open kitchen/dining room w/ S.S. appliances, laundry area, full bath w/tub shower combo & 3 bedrooms. Lots of updates in last 2 yrs, per the seller: New roof, vinyl siding, gutters, flooring & paint through-out, kitchen counter-tops, newer s.s. refrigerator, gas stove, range hood, ceiling fans, total bathroom remodel, replaced water meter, new access panel for washer & dryer, roof vent, plumbing under bathroom sink, front entry door & garage service door. Window blinds all stay & living room curtains. Nothing to do but move in!
-
2019-02-26$59,900 658-char remark
Show marketing remark (658 chars)
Updated one story home, w/ 1 car attached garage & 10 x 12 storage shed. Home features: living room, open kitchen/dining room w/ S.S. appliances, laundry area, full bath w/tub shower combo & 3 bedrooms. Lots of updates in last 2 yrs, per the seller: New roof, vinyl siding, gutters, flooring & paint through-out, kitchen counter-tops, newer s.s. refrigerator, gas stove, range hood, ceiling fans, total bathroom remodel, replaced water meter, new access panel for washer & dryer, roof vent, plumbing under bathroom sink, front entry door & garage service door. Window blinds all stay & living room curtains. Nothing to do but move in!
ⓘ Source: listings_history table (triggers on properties + properties_extension) + one-shot
backfill from property_details.listing_events for pre-trigger history.
Tax reassessment forecast IL · Partial reset (capped growth)
- Current annual tax
- $1,636 · $136/mo
- Projected year-2 tax
- $1,759 · $147/mo
- Expected delta
- +$123/yr (+$10/mo · 7.5%)
ⓘ Screening estimate from a state-policy table — verify with the county assessor before closing.
Climate risk First Street
- Flood 1/10 Low FEMA zone X (unshaded) · 0% chance over 30 yrs
- Wildfire 1/10 Low
- Heat 3/10 Moderate 7 d/yr ≥104°F today · 17 d/yr by 30 yrs out
- Wind 2/10 Low 0% chance of damaging wind over 30 yrs
- Air quality 3/10 Moderate 2 unhealthy d/yr today · 3 by 30 yrs out
Nearby sold comps map
Loading sold comps map…
Walkable amenities ~0.75 mi
Loading nearby amenities…
Taxation est. · year 1
- Rental income
- $11,598
- − Mortgage interest
- −$4,644
- − Property taxes
- −$1,636
- − Insurance
- −$414
- − Repairs & maintenance
- −$928
- − Management
- −$928
- − Depreciation
- −$2,412
- Taxable income
- $636
- Est. tax owed @ 24.0%
- −$153
- After-tax cash flow
- $1,742/yr
For passive investors: Depreciation is non-cash, so a rental often shows a tax loss while cash-flowing — sheltering income. Rental losses are passive: they offset passive income freely, and up to $25,000/yr can offset ordinary (W-2) income if you actively participate and your MAGI is under $100k (phasing out to $0 by $150k); unused losses carry forward. On sale, claimed depreciation is recaptured at up to 25%, and gains may owe capital-gains tax (a 1031 exchange can defer both). Figures are a year-1 estimate at your 24.0% rate — not tax advice; consult a CPA.
Schools (NCES district)
- District
- Galva CUSD 224
- NCES district ID
- 1716140
- Math proficiency
- 18% ▼ -9.00%
- Reading proficiency
- 14% ▼ -15.00%
- Median HH income
- $44,393
- Composite
- 14.08/100
- National rank
- #9463
- State rank
- #497 of 620 in IL
Livability — Galva
- Score
- 67/100
- State rank
- #497
- US rank
- #10271
Category grades
Schools grade is shown separately in the Schools card above.
Census & demographics
- Census place
- Galva, IL
- City population
- 2,992
- Population (ZIP)
- 2,992
Population outlook (Henry County) Hauer SSP2
- Today (2025)
- 47,376 people
- By 2030
- 45,920 · -3.1%
- By 2040
- 42,829 · -9.6%
- By 2050
- 39,606 · -16.4%
- By 2075
- 31,848 · -32.8%
- By 2100
- 23,503 · -50.4%
Race, ethnicity, and origin ACS 2023
- Neighborhood character
- Predominantly White (90%)
- Race & ethnicity
- White 90% Two or more races 7% Hispanic / Latino 5%
- Common ancestry
- English 6% Slovak 4% Lithuanian 3%
- Foreign-born
- 1%
- Languages at home
- 97% English-only · Spanish 1% Other Indo-European 1%
Political lean MEDSL · Henry
- 2024 margin
- Strong R (+24.5) · D 36.8% · R 61.3% · Other 1.9%
- 2008→2024 swing
- -32.2pp toward R · 2008: 7.7pp · 2024: -24.5pp
- All cycles
- 2024: R+24.5 2020: R+21.4 2016: R+21.2 2012: D+3.1 2008: D+7.7
Not yet ingested
- Civics
- —
Market trends
- HPI YoY
- ▲ 1.67%
- Current HPI
- 141.1529
- Rent YoY
- —
- Metro
- —
- State GDP YoY
- ▲ 1.59%
- F500 in state
- 60
Industry mix (Fortune 500 HQ in IL)
| Industry | F500 HQs | Revenue |
|---|---|---|
| Insurance | 4 | $201B |
|
||
| Consumer Goods | 4 | $87B |
|
||
| Industrial Machinery | 3 | $64B |
|
||
| Healthcare | 2 | $55B |
|
||
| Retail / Pharmacy | 1 | $148B |
|
||
| Agriculture / Food | 1 | $86B |
|
||
Price history
+41.7% since first listed7 events — show timeline
- 2026-05-01 Price Changed $84,900 MRED as Distributed by MLS Grid
- 2026-04-02 Listed $89,900 MRED as Distributed by MLS Grid
- 2019-08-02 Sold (Public Records) $55,000 Public Records
- 2019-07-31 Sold (MLS) $55,000 MRED as Distributed by MLS Grid
- 2019-07-31 Sold (MLS) $55,000 RMLSA as Distributed by MLS Grid
- 2019-02-26 Listed $59,900 MRED as Distributed by MLS Grid
- 2019-02-26 Listed $59,900 RMLSA as Distributed by MLS Grid
Property tax history
+4.8%/yrLatest (2024): $1,636 · +3.3% YoY. Source: county tax records.
Cash-flow waterfall
monthlySold comps — $/sqft
last 12 mo · ≤1 miLoading sold comps…