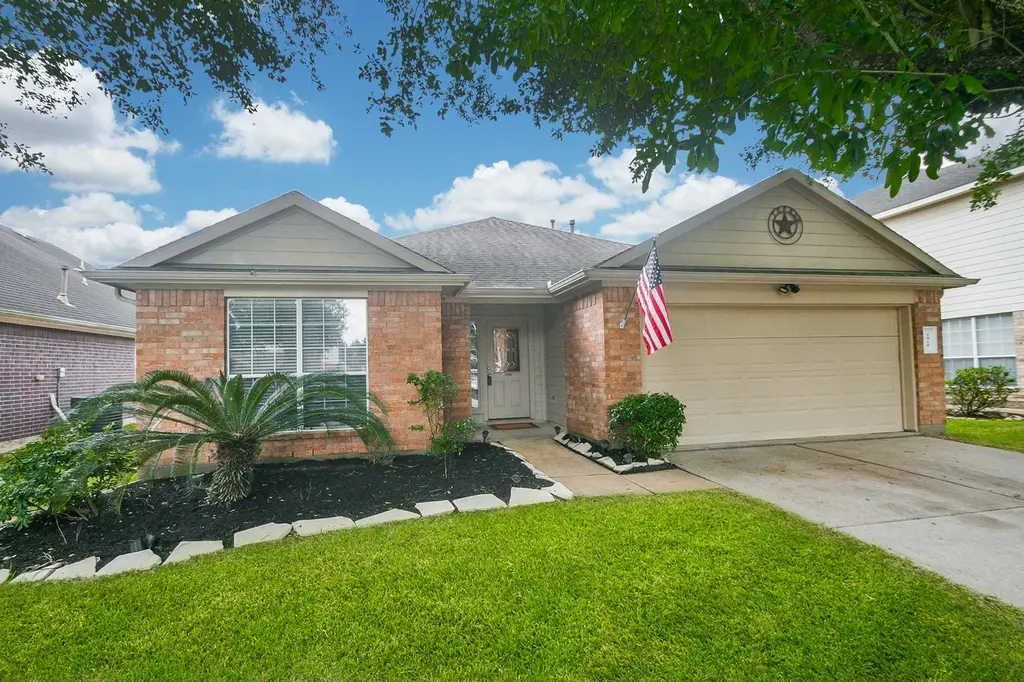
1910 Plum Creek Ln · Missouri City, TX
Flood risk 4/10 · Minor
- FEMA flood zone
- X (unshaded)
- Chance of flooding over 30 yrs
- 0.2%
- Est. flood insurance / yr
- $507 – $1,088
Fire risk 2/10 · Minimal
- Est. fire insurance / yr
- $1,222 – $2,270
Heat risk 9/10 · Severe
- Hot days now (above 110°F)
- 7 days/yr
- Hot days in 30 yrs
- 23 days/yr
Wind risk 9/10 · Severe
- Chance of severe wind over 30 yrs
- 99.0%
Air-quality risk 3/10 · Minor
- Unhealthy air days now
- 2 days/yr
- Unhealthy air days in 30 yrs
- 3 days/yr
Risk factors via First Street. Map © Google.
Why this score? — see what drove the D- grade
The composite is a weighted blend of 9 inputs, each scored 0–100. Each bar is that input's sub-score; the figure is the points it added to the 100-point composite (weight × sub-score).
- ARV discount +12.7/15.0
- Cash flow +6.1/30.0
- Appreciation +4.7/10.0
- Schools +4.5/10.0
- Livability +3.4/5.0
- 1% rule +2.7/10.0
- Rent growth +2.6/5.0
- Condition / age +2.5/5.0
- DSCR +0.5/10.0
$256,000
🖨 Deal sheet (PDF) 📄 Offer letter ✓ Due diligence
Listing remarks MLS
This charming one story property offers a spacious layout with modern upgrades throughout. Three nice size bedrooms, the kitchen is open to the family room, which is perfect for entertaining. The large backyard is ideal for outdoor gatherings or simply relaxing in the sun. Located in a desirable neighborhood and easy access to amenities. Don't miss the opportunity to call this place home!
Key facts
- Modern upgrades
- Large backyard
- Spacious layout
Tags
Neighborhood map
What this means for you Summary
Snapshot
- This is a 3-bed/2.0-bath single-family listed at $256k.
Deal economics
- At list price, monthly cash flow is $-473 ($-6k/yr) — negative.
- To cash-flow at today's rent, offer at most $172k (32.6% below list).
- To meet the 1% rule (rent ≥ 1% of price), the offer needs to be $197k (23.1% below list).
- Recommended offer: $172k (32.6% below list) — sets the bar for cash-flow.
Location & tenants
- Location reads 67/100 on livability (#526 in TX) — a middle-class / working-renter tenant base. Strengths: housing A+, crime A, employment A; Watch: amenities F, commute F, health & safety F.
- Fort Bend ISD (suburban): math 44% / reading 53% proficiency, ranked #140 of 826 in TX (top 17%) — families likely to look elsewhere, expect single-tenant / working-renter base with shorter leases.
- Zoned schools: Edgar Glover Jr El (math 42% / reading 37%, grade F, #1,545 of 4,322 statewide, top 38%, 380 students, 87% FRL); Missouri City Middle (math 19% / reading 35%, grade F, #1,177 of 1,662 statewide, top 72%, 963 students, 88% FRL); Fort Bend Co Alter (26 students, 0% FRL) — zoned schools average 58% FRL vs 35% district-wide (24 pts higher); higher-poverty schools than district average — tighter screening recommended.
- Zoned-school proficiency averages 33% at this address vs 48% district-wide (-15 pts) — the specific schools serving this property underperform the Fort Bend ISD average; the district grade overstates school quality for this exact location.
- Market conditions: Rents flat; 188 active listings in the ZIP; 8 comparable units currently listed for rent nearby; rentals at typical pace (median 23d on market — plan ~3-4 weeks tenant-placement turnaround); 12,093 units permitted in Fort Bend County in 2024 (815 in 5+ unit buildings).
- This rent runs 32% of the median local income ($75k/yr) — at the standard rent-burdened threshold; future hikes will face affordability resistance.
Forward outlook
- In year one you build about $359 of equity ($2k loan paydown + $-1k appreciation (-0.6% local appreciation)).
- Fort Bend County population projected at +75% by 2050 — long-run rental-demand tailwind backs the buy-and-hold thesis.
Negotiation context
- It's been on market 63 days — a 6% lower offer ($241k) is reasonable based on typical stale-listing flexibility.
- 2 sale attempts since 9y ago with the ask held roughly flat each time — persistent listings suggest the price (not the market) is what's stuck; bring a comps-based counter.
Risks & watch-outs
- Watch-outs: property tax is 2.6% of price.
- Climate carrying-cost: severe wind risk, 99% chance of damaging wind over 30y; extreme-heat days projected 7→23/yr by 2055 (HVAC capex compounding) — expect insurance premiums to compound above CPI over the hold.
Questions for the listing agent
- What do current leases actually rent for vs. the listed asking? Can we see a recent rent roll and the last 12 months of T-12 income?
- It's been on market 63 days. Have you received any prior offers? Is the seller open to a 33% concession, seller financing, or rate buy-down credit?
- Property tax is high relative to price — has the assessment been appealed recently, and will the sale trigger a re-assessment?
- What does the HOA fee cover, when was the last increase, and are there any pending special assessments or reserve-fund shortfalls?
- Why hasn't it sold? Are there any deal-killer items the seller is aware of (foundation, flood, title, zoning, code violations)?
- Is there a deadline driving the sale (1031 exchange, divorce, estate, relocation)? That informs how much negotiation room exists.
- Schools are B-rated — typically a magnet for longer-tenancy family renters. What's the average tenant stay here, and is there a school-zone premium baked into asking?
- The area grade is low — what's the realistic commute time and amenity access for the typical tenant pool here? Any planned neighborhood developments (good or bad) we should know about?
- What's the average days-on-market for RENTAL listings here right now (not sales)? A rising rental-DOM trend means longer vacancies and softer asking-rent achievability than the comps imply.
- What's the recent tenant-quality profile in this submarket — average credit score on applications, eviction rate, late-payment / NSF rate, and stable-employment percentage? A property-management company in the area should have these aggregated.
- How much new for-sale + rental construction is in the pipeline within 1–3 miles? Heavy new supply typically softens prices + rents 12–24 months out; constrained supply supports both.
Investment metrics
- 1% rule
- 0.77% ✗
- Cap rate
- 4.08%
- Cash-on-cash
- -7.92%
- DSCR
- 0.65
- GRM
- 10.8
CMA / ARV
- ARV (median comp)
- $289,176
- List price
- $256,000
- Delta
- -11.47%
- Verdict
- UNDERPRICED
- Comps
- 20 within 1.0 mi
Show comp detail 12 sales within ~0.75 mi
| Address | Dist | Beds/Ba | Sqft | Sold | Price | $/sf | Match |
|---|---|---|---|---|---|---|---|
| 2603 Lazy Spring Ct | 0.32mi | 3/2.0 | 1,488 (+1%) | 3mo | $230,000 | $155 | 81 |
| 2706 Indian Trail Dr | 0.30mi | 3/2.0 | 1,416 (-4%) | 9mo | $259,900 | $184 | 72 |
| 1922 Shady Oaks Ct | 0.63mi | 3/2.0 | 1,509 (+2%) | 5mo | $225,000 | $149 | 63 |
| 2254 Stillmeadow Dr | 0.68mi | 3/2.0 | 1,528 (+3%) | 3mo | $265,000 | $173 | 60 |
| 1410 Gentle Bend Dr | 0.47mi | 3/2.0 | 1,638 (+11%) | 1mo | $244,900 | $150 | 59 |
| 1323 Fieldstone | 0.55mi | 3/2.0 | 1,397 (-6%) | 11mo | $249,900 | $179 | 56 |
| 1734 Grand Park Dr | 0.72mi | 3/2.0 | 1,515 (+2%) | 8mo | $255,900 | $169 | 56 |
| 1406 River Rock Dr | 0.53mi | 3/2.0 | 1,601 (+8%) | 10mo | $249,990 | $156 | 53 |
| 1934 Shady Oaks Ct | 0.64mi | 3/2.0 | 1,376 (-7%) | 8mo | $234,900 | $171 | 52 |
| 1402 Blue Diamond Dr | 0.57mi | 3/2.0 | 1,601 (+8%) | 11mo | $268,000 | $167 | 50 |
| 1634 Grand Park Dr | 0.72mi | 4/2.0 (+1) | 1,412 (-4%) | 11mo | $230,000 | $163 | 45 |
| 2407 Albany Ter | 0.60mi | 4/2.0 (+1) | 1,680 (+14%) | 8mo | $289,000 | $172 | 38 |
Match score weights: distance 35% · size 25% · config 20% · recency 20%. Top-matched comps best support the ARV.
Projected returns pro-forma
-0.55% appreciation · 0.34% rent growth · sell at horizon
- IRR
- -15.8%
- Equity multiple
- 0.31×
- Total profit
- $-49,121
- Equity at exit
- $67,358
- IRR
- -11.5%
- Equity multiple
- -0.04×
- Total profit
- $-74,416
- Equity at exit
- $75,590
Cash invested: $71,680 (down + closing). Projections, not guarantees.
Landlord ↔ Tenant lean methodology
- Overall (STATE)
- 87 Strongly Landlord-Friendly
- State Texas
- 87 Strongly Landlord-Friendly · R+5
- County
- — inherits STATE
- City
- — inherits STATE
ZIP-level market 77489
- Home prices YoY
- -0.2%
- Rents YoY
- 0.3%
- Active inventory
- 188
- Price-to-rent
- 10.8×
Monthly cashflow live
- Estimated rent
- $1,969 high interval (Pro) →
- Mortgage (P&I)
- −$1,342
- Tax from tax record
- −$546 /mo · $6,555/yr
- Insurance
- −$107
- HOA
- −$33
- Vacancy / Maint / Mgmt
- −$413
- Net cashflow
- $-473
Break-even live
Sensitivity live
| Price | -10% $-328 | -5% $-401 | +0% $-473 | +5% $-546 | +10% $-618 |
|---|---|---|---|---|---|
| Rent | -10% $-629 | -5% $-551 | +0% $-473 | +5% $-395 | +10% $-318 |
| Rate | -1.0pp $-344 | -0.5pp $-408 | base $-473 | +0.5pp $-539 | +1.0pp $-607 |
UW: 25.0% down · 7.5% · 30yr · 1.5% tax · 5.0% vac · 8.0% maint · 8.0% mgmt
Financing live
Cash to close
- Down payment
- $64,000
- Closing costs
- $7,680
- Reserves months
- —
- Total cash needed
- —
Loan-product check · same deal, 3 products live
Conventional
25% down · 7.5% · 30yr
- Down + closing
- —
- Monthly P&I
- —
- Monthly cashflow
- —
- DSCR
- —
- Eligible?
- —
Personal DTI + credit; lowest rate.
DSCR
20% down · 8.5% · 30yr
- Down + closing
- —
- Monthly P&I
- —
- Monthly cashflow
- —
- DSCR
- —
- Eligible?
- —
No personal income docs; deal must DSCR.
Hard money
10% down · 12.0% · 12mo
- Down + closing
- —
- Monthly P&I
- —
- Monthly cashflow
- —
- DSCR
- —
- Eligible?
- —
Short-term bridge; refi at stabilization.
Rent comps 8 comps
| Address | Beds | Baths | Sqft | Rent | $/sqft | DOM | Units | Dist |
|---|---|---|---|---|---|---|---|---|
| 1919 Doliver Cir Missouri City, TX | 3.0 | 2.0 | 1515 | $2,000 | $1.32 | 45d | 1 | 0.47mi |
| 2026 Summer Place Dr Missouri City, TX | 3.0 | 2.0 | 1837 | $1,861 | $1.01 | 22d | 1 | 0.48mi |
| 3102 Texas Pkwy Missouri City, TX | 2.0 | 1.0 | 900 | $1,301 | $1.45 | 3d | 3 | 0.69mi |
| 3302 Texas Pkwy Missouri City, TX | 1.0–2.0 | 1.0–2.0 | 800 | $1,302 | $1.63 | 3d | 7 | 0.82mi |
| 1215 New Tree Ln Missouri City, TX | 3.0 | 2.0 | 1323 | $1,725 | $1.30 | 14d | 1 | 0.83mi |
| 16310 Setter Ct Missouri City, TX | 3.0 | 2.0 | 1672 | $1,700 | $1.02 | 45d | 1 | 1.08mi |
| 17318 Edgehaven Dr Missouri City, TX | 3.0 | 2.0 | 1448 | $1,695 | $1.17 | 22d | 1 | 1.29mi |
| 3618 Quail Meadow Dr Missouri City, TX | 3.0 | 2.0 | 1618 | $1,966 | $1.22 | 45d | 1 | 1.41mi |
HOA detail
- Monthly dues
- $33 · $396/yr
Listing history 15 events
-
2026-06-13statusdays on market $256,000 Pending 63 DOM
-
2026-06-09days on market $256,000 Active Under Contract 61 DOM
-
2026-06-07days on market $256,000 Active Under Contract 59 DOM
-
2026-06-04days on market $256,000 Active Under Contract 56 DOM
-
2026-06-03days on market $256,000 Active Under Contract 55 DOM
-
2026-06-02days on market $256,000 Active Under Contract 54 DOM
-
2026-06-01days on market $256,000 Active Under Contract 53 DOM
-
2026-05-31days on market $256,000 Active Under Contract 52 DOM
-
2026-05-19status Pending 392-char remark
Show marketing remark (392 chars)
This charming one story property offers a spacious layout with modern upgrades throughout. Three nice size bedrooms, the kitchen is open to the family room, which is perfect for entertaining. The large backyard is ideal for outdoor gatherings or simply relaxing in the sun. Located in a desirable neighborhood and easy access to amenities. Don't miss the opportunity to call this place home!
-
2026-04-09$256,000 Active 392-char remark
Show marketing remark (392 chars)
This charming one story property offers a spacious layout with modern upgrades throughout. Three nice size bedrooms, the kitchen is open to the family room, which is perfect for entertaining. The large backyard is ideal for outdoor gatherings or simply relaxing in the sun. Located in a desirable neighborhood and easy access to amenities. Don't miss the opportunity to call this place home!
-
2017-03-08soldstatus
-
2017-03-07soldstatus Sold 297-char remark
Show marketing remark (297 chars)
Beautiful recently updated home in established neighborhood. New granite counter tops and stained cabinets with pendant lighting, in addition to the master bath remodel. Stainless steel fridge included. A mile from Fort Bend toll and easy access to Highway 90 . 15-20 minutes to the Medical Center
-
2017-02-19status Pending 297-char remark
Show marketing remark (297 chars)
Beautiful recently updated home in established neighborhood. New granite counter tops and stained cabinets with pendant lighting, in addition to the master bath remodel. Stainless steel fridge included. A mile from Fort Bend toll and easy access to Highway 90 . 15-20 minutes to the Medical Center
-
2017-02-08status Option Pending 297-char remark
Show marketing remark (297 chars)
Beautiful recently updated home in established neighborhood. New granite counter tops and stained cabinets with pendant lighting, in addition to the master bath remodel. Stainless steel fridge included. A mile from Fort Bend toll and easy access to Highway 90 . 15-20 minutes to the Medical Center
-
2017-01-31$169,900 Active 297-char remark
Show marketing remark (297 chars)
Beautiful recently updated home in established neighborhood. New granite counter tops and stained cabinets with pendant lighting, in addition to the master bath remodel. Stainless steel fridge included. A mile from Fort Bend toll and easy access to Highway 90 . 15-20 minutes to the Medical Center
ⓘ Source: listings_history table (triggers on properties + properties_extension) + one-shot
backfill from property_details.listing_events for pre-trigger history.
Tax reassessment forecast TX · Resets to sale price
- Current annual tax
- $6,555 · $546/mo
- Projected year-2 tax
- $6,555 · $546/mo
- Expected delta
- $0/yr ($0/mo · 0.0%)
ⓘ Screening estimate from a state-policy table — verify with the county assessor before closing.
Climate risk First Street
- Flood 4/10 Moderate FEMA zone X (unshaded) · 20% chance over 30 yrs
- Wildfire 2/10 Low
- Heat 9/10 Extreme 7 d/yr ≥110°F today · 23 d/yr by 30 yrs out
- Wind 9/10 Extreme 99% chance of damaging wind over 30 yrs
- Air quality 3/10 Moderate 2 unhealthy d/yr today · 3 by 30 yrs out
Nearby sold comps map
Loading sold comps map…
Walkable amenities ~0.75 mi
Loading nearby amenities…
Taxation est. · year 1
- Rental income
- $23,625
- − Mortgage interest
- −$14,340
- − Property taxes
- −$6,555
- − Insurance
- −$1,280
- − Repairs & maintenance
- −$1,890
- − Management
- −$1,890
- − HOA
- −$396
- − Depreciation
- −$7,447
- Taxable loss
- −$10,173
- Est. tax savings @ 24.0%
- +$2,442
- After-tax cash flow
- $-3,235/yr
For passive investors: Depreciation is non-cash, so a rental often shows a tax loss while cash-flowing — sheltering income. Rental losses are passive: they offset passive income freely, and up to $25,000/yr can offset ordinary (W-2) income if you actively participate and your MAGI is under $100k (phasing out to $0 by $150k); unused losses carry forward. On sale, claimed depreciation is recaptured at up to 25%, and gains may owe capital-gains tax (a 1031 exchange can defer both). Figures are a year-1 estimate at your 24.0% rate — not tax advice; consult a CPA.
Schools (NCES district)
- District
- Fort Bend ISD
- NCES district ID
- 4819650
- Math proficiency
- 44% ▼ -15.00%
- Reading proficiency
- 53% ▼ -4.00%
- Median HH income
- $82,360
- Composite
- 44.61/100
- National rank
- #2779
- State rank
- #140 of 826 in TX
Livability — Missouri City
- Score
- 67/100
- State rank
- #526
- US rank
- #10308
Category grades
Schools grade is shown separately in the Schools card above.
Census & demographics
- Census place
- Missouri City, TX
- County
- Fort Bend County · 836,777 people
- City population
- 123,513
- Metro
- Houston-The Woodlands-Sugar Land, TX
- Population (ZIP)
- 39,292
- Household income
- $74,689
- Rent vs Own
- Severe rent burden
- 1121.0
Population outlook (Fort Bend County) Hauer SSP2
- Today (2025)
- 1,004,526 people
- By 2030
- 1,153,104 · +14.8%
- By 2040
- 1,453,718 · +44.7%
- By 2050
- 1,753,781 · +74.6%
- By 2075
- 2,455,772 · +144.5%
- By 2100
- 2,930,528 · +191.7%
Race, ethnicity, and origin ACS 2023
- Neighborhood character
- Majority Black (60%)
- Race & ethnicity
- Black 60% Hispanic / Latino 29% Two or more races 13% White 4% Asian 3%
- Hispanic origin (detail)
- Mexican 17%
- Foreign-born
- 16% · Canada, Vietnam
- Languages at home
- 73% English-only · Spanish 22% Vietnamese 1% Other Asian/Pacific 1%
Political lean MEDSL · Fort Bend
- 2024 margin
- Toss-up / Even · D 49.5% · R 47.9% · Other 2.6%
- 2008→2024 swing
- +4.0pp toward D · 2008: -2.4pp · 2024: 1.6pp
- All cycles
- 2024: D+1.6 2020: D+10.6 2016: D+6.6 2012: R+6.8 2008: R+2.4
Not yet ingested
- Civics
- —
Market trends
- HPI YoY
- ▼ -0.55%
- Current HPI
- 288.1306
- Rent YoY
- ▲ 0.34%
- Metro
- Houston-The Woodlands-Sugar Land, TX
- State GDP YoY
- ▲ 3.95%
- F500 in state
- 110
Industry mix (Fortune 500 HQ in TX)
| Industry | F500 HQs | Revenue |
|---|---|---|
| Energy | 16 | $1,198B |
|
||
| Technology | 5 | $198B |
|
||
| Engineering / Construction | 4 | $72B |
|
||
| Energy Services | 3 | $60B |
|
||
| Utilities | 3 | $41B |
|
||
| Healthcare | 2 | $330B |
|
||
Price history
+50.7% since first listed7 events — show timeline
- 2026-05-19 Pending — HARMLS
- 2026-04-09 Listed $256,000 HARMLS
- 2017-03-08 Sold (Public Records) — Public Records
- 2017-03-07 Sold (MLS) — HARMLS
- 2017-02-19 Pending — HARMLS
- 2017-02-08 Pending — HARMLS
- 2017-01-31 Listed $169,900 HARMLS
Property tax history
+3.6%/yrLatest (2025): $6,555 · +12.4% YoY. Source: county tax records.
Cash-flow waterfall
monthlySold comps — $/sqft
last 12 mo · ≤1 miLoading sold comps…