149 State Rd · Rockbridge, IL
Flood risk 1/10 · Minimal
- FEMA flood zone
- X (unshaded)
- Chance of flooding over 30 yrs
- 0.0%
- Est. flood insurance / yr
- $473 – $860
Fire risk 1/10 · Minimal
- Est. fire insurance / yr
- $804 – $1,492
Heat risk 4/10 · Minor
- Hot days now (above 107°F)
- 7 days/yr
- Hot days in 30 yrs
- 20 days/yr
Wind risk 2/10 · Minimal
- Chance of severe wind over 30 yrs
- 2.0%
Air-quality risk 3/10 · Minor
- Unhealthy air days now
- 2 days/yr
- Unhealthy air days in 30 yrs
- 4 days/yr
Risk factors via First Street. Map © Google.
Why this score? — see what drove the D grade
The composite is a weighted blend of 9 inputs, each scored 0–100. Each bar is that input's sub-score; the figure is the points it added to the 100-point composite (weight × sub-score).
- Cash flow +12.8/30.0
- ARV discount +7.5/15.0
- Appreciation +5.0/10.0
- DSCR +3.8/10.0
- 1% rule +3.1/10.0
- Schools +2.9/10.0
- Livability +2.9/5.0
- Rent growth +2.5/5.0
- Condition / age +2.5/5.0
$130,000
🖨 Deal sheet (PDF) 📄 Offer letter ✓ Due diligence
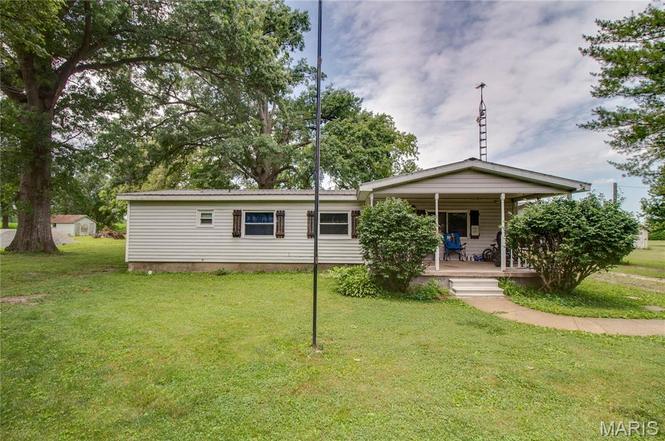
Listing remarks
Well-maintained ranch-style home offering comfortable one-level living with plenty of garage and workshop space. The exterior features low-maintenance vinyl siding, a durable metal roof on both the home and garage, central air conditioning, a covered front porch, concrete patio, gravel and grass driveway, and an 18' x 12' detached metal storage shed. Inside, you'll find a spacious living room a large eat-in kitchen, providing plenty of room for gatherings. The convenient mudroom/laundry room offers direct access to the backyard and patio. The main level includes three bedrooms, including a primary suite with a private 3/4 bath featuring a step-in shower with built-in bench seat. Two addit
Key facts
- Durable metal roof
- Covered front porch
- Concrete patio
Tags
Property features AI
Finance
- Other: Assessor-provided above-grade finished area: 1,152
- Financial info: Lease not considered; No second mortgage reported
Exterior
- Parking: 2-car garage
- Utilities: Public water; Public sewer; Electric service by Ameren; Propane available; Electricity, water and sewer available
- Home design: Residential manufactured home; One level
- Construction: Vinyl siding; Metal roof; Slab foundation; House structure
- Exterior features: Back yard; Front yard; Some trees; Covered front porch
Interior
- Kitchen: Kitchen
- Bedrooms: 3 bedrooms (all on the main level)
- Bathrooms: 2 full bathrooms (main level)
- Heating & cooling: Propane heating; Central air conditioning
- Interior features: Living room; Covered front porch
- Laundry & utility: Main-level laundry
Neighborhood map
What this means for you Summary
Snapshot
- This is a 3-bed/2.0-bath other listed at $130k.
Deal economics
- At list price, monthly cash flow is $-11 ($-129/yr) — negative.
- To cash-flow at today's rent, offer at most $128k (1.5% below list).
- To meet the 1% rule (rent ≥ 1% of price), the offer needs to be $105k (19.2% below list).
- Recommended offer: $105k (19.2% below list) — sets the bar for 1% rule.
Location & tenants
- Location reads 57/100 on livability (#1,173 in IL) — a working-class tenant base; expect higher turnover. Strengths: cost of living A+, housing A+, employment B; Watch: crime F, amenities F, commute F.
- Greenfield CUSD 10 (rural): math 30% / reading 30% proficiency, ranked #490 of 919 in IL (top 53%) — families likely to look elsewhere, expect single-tenant / working-renter base with shorter leases.
- Zoned schools: Greenfield Elem School (math 17% / reading 22%, grade F, #1,054 of 2,056 statewide, top 54%, 312 students, 0% FRL); Greenfield High School (math 15% / reading 15%, grade F, #462 of 693 statewide, top 68%, 119 students, 0% FRL) — zoned schools average 0% FRL vs 38% district-wide (38 pts lower); this property's tenant base skews higher-income than the district average.
- Zoned-school proficiency averages 17% at this address vs 30% district-wide (-13 pts) — the specific schools serving this property underperform the Greenfield CUSD 10 average; the district grade overstates school quality for this exact location.
- Market conditions: 3 active listings in the ZIP; 1 units permitted in Greene County in 2024 (0 in 5+ unit buildings).
Forward outlook
- In year one you build about $5k of equity ($899 loan paydown + $4k appreciation (3.0% local appreciation)).
- Greene County population projected at -28% by 2050 — secular population decline; favor cash flow + early exit over multi-decade hold.
- At projected returns (3.0% appreciation + 3.0% rent growth), your $36k cash investment doubles in ~7 years — after that, you're playing with house money.
- By year 7, paydown + projected appreciation supports a ~$30k cash-out refi (75% LTV) — recoverable capital for the next deal without selling this one.
Negotiation context
- Only 5 days on market — expect competitive offers; lowballing is unlikely to land.
Questions for the listing agent
- What do current leases actually rent for vs. the listed asking? Can we see a recent rent roll and the last 12 months of T-12 income?
- Built in 1977 — when were the roof, HVAC, electrical panel, plumbing, and water heater last replaced?
- Is there a deadline driving the sale (1031 exchange, divorce, estate, relocation)? That informs how much negotiation room exists.
- Schools are F-rated, which usually means shorter tenancies and higher turnover. Who's the typical renter profile here, and what's been the actual vacancy rate?
- Crime grade is F in this area — have there been break-ins, vandalism, or insurance claims at this property in the last 3 years? What carrier currently insures it and at what premium?
- The area grade is low — what's the realistic commute time and amenity access for the typical tenant pool here? Any planned neighborhood developments (good or bad) we should know about?
- What's the average days-on-market for RENTAL listings here right now (not sales)? A rising rental-DOM trend means longer vacancies and softer asking-rent achievability than the comps imply.
- What's the recent tenant-quality profile in this submarket — average credit score on applications, eviction rate, late-payment / NSF rate, and stable-employment percentage? A property-management company in the area should have these aggregated.
- How much new for-sale + rental construction is in the pipeline within 1–3 miles? Heavy new supply typically softens prices + rents 12–24 months out; constrained supply supports both.
Investment metrics
- 1% rule
- 0.81% ✗
- Cap rate
- 6.19%
- Cash-on-cash
- -0.35%
- DSCR
- 0.98
- GRM
- 10.3
CMA / ARV
No comps found within radius.
Projected returns pro-forma
3.0% appreciation · 3.0% rent growth · sell at horizon
- IRR
- 7.2%
- Equity multiple
- 1.41×
- Total profit
- $14,957
- Equity at exit
- $58,454
- IRR
- 9.9%
- Equity multiple
- 2.49×
- Total profit
- $54,197
- Equity at exit
- $90,084
Cash invested: $36,400 (down + closing). Projections, not guarantees.
Landlord ↔ Tenant lean methodology
- Overall (STATE)
- 43 Moderately Tenant-Leaning
- State Illinois
- 43 Moderately Tenant-Leaning · D+7
- County
- — inherits STATE
- City
- — inherits STATE
ZIP-level market 62081
- Active inventory
- 3
- Price-to-rent
- 10.3×
Monthly cashflow live
- Estimated rent
- $1,050 medium interval (Pro) →
- Mortgage (P&I)
- −$682
- Tax from tax record
- −$104 /mo · $1,251/yr
- Insurance
- −$54
- HOA
- −$0
- Vacancy / Maint / Mgmt
- −$220
- Net cashflow
- $-11
Break-even live
Sensitivity live
| Price | -10% $63 | -5% $26 | +0% $-11 | +5% $-48 | +10% $-84 |
|---|---|---|---|---|---|
| Rent | -10% $-94 | -5% $-52 | +0% $-11 | +5% $31 | +10% $72 |
| Rate | -1.0pp $55 | -0.5pp $22 | base $-11 | +0.5pp $-44 | +1.0pp $-79 |
UW: 25.0% down · 7.5% · 30yr · 1.5% tax · 5.0% vac · 8.0% maint · 8.0% mgmt
Financing live
Cash to close
- Down payment
- $32,500
- Closing costs
- $3,900
- Reserves months
- —
- Total cash needed
- —
Loan-product check · same deal, 3 products live
Conventional
25% down · 7.5% · 30yr
- Down + closing
- —
- Monthly P&I
- —
- Monthly cashflow
- —
- DSCR
- —
- Eligible?
- —
Personal DTI + credit; lowest rate.
DSCR
20% down · 8.5% · 30yr
- Down + closing
- —
- Monthly P&I
- —
- Monthly cashflow
- —
- DSCR
- —
- Eligible?
- —
No personal income docs; deal must DSCR.
Hard money
10% down · 12.0% · 12mo
- Down + closing
- —
- Monthly P&I
- —
- Monthly cashflow
- —
- DSCR
- —
- Eligible?
- —
Short-term bridge; refi at stabilization.
Listing history 5 events
-
2026-06-22days on market $130,000 Active 5 DOM
-
2026-06-21days on market $130,000 Active 4 DOM
-
2026-06-21days on market $130,000 Active 3 DOM
-
2026-06-17remarks 699-char remark
-
2026-06-17$130,000 Active 1 DOM
ⓘ Source: listings_history table (triggers on properties + properties_extension) + one-shot
backfill from property_details.listing_events for pre-trigger history.
Tax reassessment forecast IL · Partial reset (capped growth)
- Current annual tax
- $1,251 · $104/mo
- Projected year-2 tax
- $2,101 · $175/mo
- Expected delta
- +$850/yr (+$71/mo · 68.0%)
ⓘ Screening estimate from a state-policy table — verify with the county assessor before closing.
Climate risk First Street
- Flood 1/10 Low FEMA zone X (unshaded) · 0% chance over 30 yrs
- Wildfire 1/10 Low
- Heat 4/10 Moderate 7 d/yr ≥107°F today · 20 d/yr by 30 yrs out
- Wind 2/10 Low 2% chance of damaging wind over 30 yrs
- Air quality 3/10 Moderate 2 unhealthy d/yr today · 4 by 30 yrs out
Nearby sold comps map
Loading sold comps map…
Walkable amenities ~0.75 mi
Loading nearby amenities…
Taxation est. · year 1
- Rental income
- $12,598
- − Mortgage interest
- −$7,282
- − Property taxes
- −$1,251
- − Insurance
- −$650
- − Repairs & maintenance
- −$1,008
- − Management
- −$1,008
- − Depreciation
- −$3,782
- Taxable loss
- −$2,382
- Est. tax savings @ 24.0%
- +$572
- After-tax cash flow
- $443/yr
For passive investors: Depreciation is non-cash, so a rental often shows a tax loss while cash-flowing — sheltering income. Rental losses are passive: they offset passive income freely, and up to $25,000/yr can offset ordinary (W-2) income if you actively participate and your MAGI is under $100k (phasing out to $0 by $150k); unused losses carry forward. On sale, claimed depreciation is recaptured at up to 25%, and gains may owe capital-gains tax (a 1031 exchange can defer both). Figures are a year-1 estimate at your 24.0% rate — not tax advice; consult a CPA.
Schools (NCES district)
- District
- Greenfield CUSD 10
- NCES district ID
- 1717670
- Math proficiency
- 30% ▼ -5.00%
- Reading proficiency
- 30% ▼ -9.00%
- Median HH income
- $48,286
- Composite
- 28.87/100
- National rank
- #11958
- State rank
- #490 of 919 in IL
Livability — Rockbridge
- Score
- 57/100
- State rank
- #1173
- US rank
- #22197
Category grades
Schools grade is shown separately in the Schools card above.
Census & demographics
- Census place
- Rockbridge, IL
- Population (ZIP)
- 293
Population outlook (Greene County) Hauer SSP2
- Today (2025)
- 12,137 people
- By 2030
- 11,467 · -5.5%
- By 2040
- 10,117 · -16.6%
- By 2050
- 8,804 · -27.5%
- By 2075
- 6,187 · -49.0%
- By 2100
- 4,175 · -65.6%
Race, ethnicity, and origin ACS 2023
- Neighborhood character
- Predominantly White (88%)
- Race & ethnicity
- White 88% Two or more races 7% Hispanic / Latino 6% Black 4%
- Hispanic origin (detail)
- Dominican 6%
- Common ancestry
- Lithuanian 1%
- Languages at home
- 86% English-only · Spanish 14%
Political lean MEDSL · Greene
- 2024 margin
- Solid R (+57.8) · D 20.1% · R 78.0% · Other 1.9%
- 2008→2024 swing
- -50.3pp toward R · 2008: -7.5pp · 2024: -57.8pp
- All cycles
- 2024: R+57.8 2020: R+54.9 2016: R+53.0 2012: R+25.4 2008: R+7.5
Not yet ingested
- Civics
- —
Market trends
- HPI YoY
- —
- Current HPI
- —
- Rent YoY
- —
- Metro
- —
- State GDP YoY
- ▲ 1.59%
- F500 in state
- 60
Industry mix (Fortune 500 HQ in IL)
| Industry | F500 HQs | Revenue |
|---|---|---|
| Insurance | 4 | $201B |
|
||
| Consumer Goods | 4 | $87B |
|
||
| Industrial Machinery | 3 | $64B |
|
||
| Healthcare | 2 | $55B |
|
||
| Retail / Pharmacy | 1 | $148B |
|
||
| Agriculture / Food | 1 | $86B |
|
||
Price history
+0.0% since first listed2 events — show timeline
- 2026-06-17 Listed $130,000 MARIS as Distributed by MLS Grid
- 2026-06-17 Coming Soon $130,000 MARIS as Distributed by MLS Grid
Property tax history
+2.4%/yrLatest (2024): $1,251 · +0.1% YoY. Source: county tax records.
Cash-flow waterfall
monthlySold comps — $/sqft
last 12 mo · ≤1 miLoading sold comps…