 🌊 Lakefront
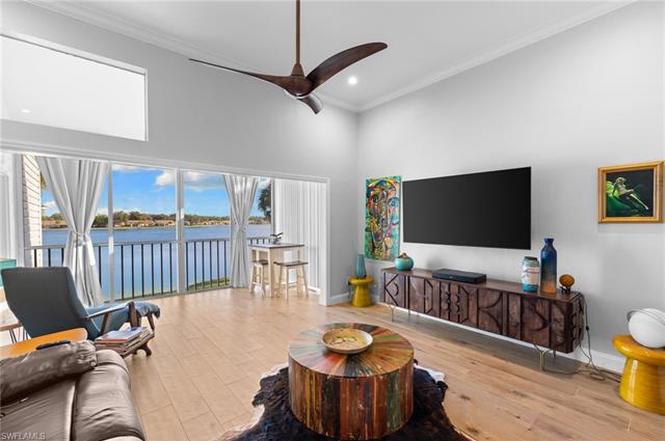
2571 Citrus Lake Dr Unit 201B · Pelican Marsh, FL
Flood risk No data
- FEMA flood zone
- —
- Chance of flooding over 30 yrs
- —
- Est. flood insurance / yr
- —
Fire risk No data
- Est. fire insurance / yr
- —
Heat risk No data
- Hot days now (above threshold)
- —
- Hot days in 30 yrs
- —
Wind risk No data
- Chance of severe wind over 30 yrs
- —
Air-quality risk No data
- Unhealthy air days now
- —
- Unhealthy air days in 30 yrs
- —
Risk factors via First Street. Map © Google.
Why this score? — see what drove the C- grade
The composite is a weighted blend of 9 inputs, each scored 0–100. Each bar is that input's sub-score; the figure is the points it added to the 100-point composite (weight × sub-score).
- Cash flow +14.4/30.0
- ARV discount +7.5/15.0
- 1% rule +6.5/10.0
- Appreciation +5.1/10.0
- Schools +5.0/10.0
- DSCR +4.4/10.0
- Condition / age +4.0/5.0
- Rent growth +2.7/5.0
- Livability +2.5/5.0
$400,000
🖨 Deal sheet 📄 Offer letter ✓ Due diligence
Listing remarks
Enjoy some of the most incredible lake views and an unbeatable Naples lifestyle in this beautifully located Lakeside condo. Wake up to shimmering water views that fill the living spaces with natural light and create a peaceful, private retreat. A one car attached garage adds everyday convenience and extra storage—an exceptional feature for condo living in Naples. Lakeside is a well established, amenity rich community offering resort style pools, a clubhouse, tennis and pickleball courts, and scenic walking paths winding throughout the neighborhood. Residents enjoy a relaxed, active lifestyle surrounded by mature landscaping and picturesque lakes. Perfectly positioned in the heart of N
Key facts
- Resort style pools
- Clubhouse
- Lake views
Tags
Property features AI
Finance
- Other: Part of Lakeside Carriage Homes subdivision; Has freshwater lake/pond view (waterfront); Unit number 201B; Two units per floor; 8 units in building; 396 units in complex; 2 floors in building; Deeded restrictions
- HOA & community: Mandatory HOA (professional management); Quarterly condo fee; Quarterly condo fee billed (amount reported); Maintenance covers cable, insurance, internet/Wi-Fi, irrigation water, lawn/land maintenance, legal/accounting, manager, master association fee, recreation facilities, reserve, street lights and maintenance, and water; Community amenities include clubhouse, community pool, community spa/hot tub, exercise room, billiards, bocce court, tennis courts, fishing pier, community room, internet access, sidewalks and streetlights; Total annual recurring fees reported; One-time fees reported
Exterior
- Parking: Attached 1-car garage
- Security: Gated community
- Utilities: Central water; Central sewer; Cable available
- Home design: Residential property; Low-rise (1–3) carriage/coach style; 2-story building; Rear exposure faces northeast; Zero lot line
- Construction: Concrete block construction; Stucco exterior; Shingle roof; Built in 1989
- Exterior features: Automatic sprinkler system; Double-hung windows; Manual shutters
Interior
- Kitchen: Electric cooktop; Range; Microwave; Dishwasher; Disposal; Refrigerator; Freezer; Refrigerator/Freezer
- Bedrooms: 3 bedrooms (split bedroom floor plan)
- Flooring: Tile
- Bathrooms: 2 full bathrooms; Master bathroom with dual sinks
- Heating & cooling: Central electric heat; Central electric air conditioning; Ceiling fans
- Interior features: High speed internet available; Dining area (family); Screened lanai/porch
- Laundry & utility: Washer; Dryer; Laundry in residence; Auto garage door
Neighborhood map
What this means for you Summary
Snapshot
- This is a 3-bed/2.0-bath condo listed at $400k. Condition is rated good.
Deal economics
- At list price, monthly cash flow is $84 ($1k/yr) — positive.
- The deal already cash-flows at list — no discount required.
- Meets the 1% rule at list price ($5k rent vs $400k).
- Recommended offer: $352k (12.0% below list) — sets the bar for market timing.
Location & tenants
- Location reads: area grade C — affects rentability + tenant quality, not the cash-flow math above.
- Collier (suburban): math 60% / reading 56% proficiency, ranked #16 of 73 in FL (top 22%) — acceptable for families but not a draw, mixed tenant base, ~2y average lease.
- Market conditions: Rents flat; 424 active listings in the ZIP; 40 comparable units currently listed for rent nearby; rentals at typical pace (median 14d on market — plan ~3-4 weeks tenant-placement turnaround); solid renter incomes; 3,520 units permitted in Collier County in 2024 (959 in 5+ unit buildings).
- At $4,601/mo this rent would consume 60% of the median local household income ($92k/yr) (locally 1712% of renters already pay >50% of income on rent) — very limited rent-growth headroom before tenants either downsize or default.
Forward outlook
- In year one you build about $4k of equity ($3k loan paydown + $1k appreciation (0.3% local appreciation)).
- Collier County population projected at +30% by 2050 — long-run rental-demand tailwind backs the buy-and-hold thesis.
- By year 7, paydown + projected appreciation supports a ~$31k cash-out refi (75% LTV) — recoverable capital for the next deal without selling this one.
Negotiation context
- It's been on market 142 days — a 12% lower offer ($352k) is reasonable based on typical stale-listing flexibility.
Questions for the listing agent
- It's been on market 142 days. Have you received any prior offers? Is the seller open to a 12% concession, seller financing, or rate buy-down credit?
- What does the HOA fee cover, when was the last increase, and are there any pending special assessments or reserve-fund shortfalls?
- Any open or pending special assessments — roof, HVAC, plumbing, elevator, façade? What's the per-unit balance and payoff schedule, and is the seller paying it off at close or rolling it to the buyer?
- Why hasn't it sold? Are there any deal-killer items the seller is aware of (foundation, flood, title, zoning, code violations)?
- Is there a deadline driving the sale (1031 exchange, divorce, estate, relocation)? That informs how much negotiation room exists.
- This sits on a lake — are riparian / water-frontage rights deeded with the parcel? Any dock permits, shoreline easements, or HOA water-use restrictions?
- What's the documented flood / surge / shoreline-erosion history here (FEMA AND non-FEMA — e.g., storm surge, creek backup, septic-field saturation)?
- Any water-quality or seasonal algae-bloom issues that affect tenant satisfaction or short-term-rental demand?
- What's the average days-on-market for RENTAL listings here right now (not sales)? A rising rental-DOM trend means longer vacancies and softer asking-rent achievability than the comps imply.
- What's the recent tenant-quality profile in this submarket — average credit score on applications, eviction rate, late-payment / NSF rate, and stable-employment percentage? A property-management company in the area should have these aggregated.
- How much new apartment / multifamily construction is in the pipeline within 1–3 miles? Heavy new supply (>2% of stock underway) typically softens rents 12–24 months out; light construction supports rent growth.
Investment metrics
- 1% rule
- 1.15% ✓
- Cap rate
- 6.54%
- Cash-on-cash
- 0.90%
- DSCR
- 1.04
- GRM
- 7.2
CMA / ARV
No comps found within radius.
Projected returns pro-forma
0.29% appreciation · 0.92% rent growth · sell at horizon
- IRR
- -1.8%
- Equity multiple
- 0.91×
- Total profit
- $-9,676
- Equity at exit
- $122,081
- IRR
- 1.9%
- Equity multiple
- 1.20×
- Total profit
- $22,410
- Equity at exit
- $151,569
Cash invested: $112,000 (down + closing). Projections, not guarantees.
Landlord ↔ Tenant lean methodology
- Overall (STATE)
- 87 Strongly Landlord-Friendly
- State Florida
- 87 Strongly Landlord-Friendly · R+3
- County
- — inherits STATE
- City
- — inherits STATE
ZIP-level market 34109
- Home prices YoY
- 0.1%
- Rents YoY
- 0.9%
- Active inventory
- 424
- Price-to-rent
- 7.2×
Monthly cashflow live
- Estimated rent
- $4,601 high interval (Pro) →
- Mortgage (P&I)
- −$2,098
- Tax est. 1.5%
- −$500 /mo · $6,000/yr
- Insurance
- −$167
- HOA
- −$787
- Vacancy / Maint / Mgmt
- −$966
- Net cashflow
- $84
Break-even live
UW: 25.0% down · 7.5% · 30yr · 1.5% tax · 5.0% vac · 8.0% maint · 8.0% mgmt
Financing live
Cash to close
- Down payment
- $100,000
- Closing costs
- $12,000
- Reserves months
- —
- Total cash needed
- —
Loan-product check · same deal, 3 products live
Conventional
25% down · 7.5% · 30yr
- Down + closing
- —
- Monthly P&I
- —
- Monthly cashflow
- —
- DSCR
- —
- Eligible?
- —
Personal DTI + credit; lowest rate.
DSCR
20% down · 8.5% · 30yr
- Down + closing
- —
- Monthly P&I
- —
- Monthly cashflow
- —
- DSCR
- —
- Eligible?
- —
No personal income docs; deal must DSCR.
Hard money
10% down · 12.0% · 12mo
- Down + closing
- —
- Monthly P&I
- —
- Monthly cashflow
- —
- DSCR
- —
- Eligible?
- —
Short-term bridge; refi at stabilization.
Rent comps 40 comps
| Address | Beds | Baths | Sqft | Rent | $/sqft | DOM | Units | Dist |
|---|---|---|---|---|---|---|---|---|
| 2611 Citrus Lake Dr Unit C-203 Naples, FL | 3.0 | 2.0 | 1710 | $5,500 | $3.22 | 14d | 1 | 0.02mi |
| 2651 Citrus Lake Dr Unit D302 Naples, FL | 2.0 | 2.0 | 1250 | $5,000 | $4.00 | 14d | 1 | 0.04mi |
| 2671 Citrus Lake Dr Unit E-303 Naples, FL | 2.0 | 2.0 | 1380 | $3,500 | $2.54 | 14d | 1 | 0.08mi |
| 2671 Citrus Lake Dr Unit E-201 Naples, FL | 3.0 | 2.0 | 1380 | $5,250 | $3.80 | 14d | 1 | 0.08mi |
| 2541 Citrus Lake Dr Unit A-205 Naples, FL | 3.0 | 2.0 | 1590 | $5,250 | $3.30 | 14d | 1 | 0.09mi |
| 2711 Citrus Lake Dr Unit F302 Naples, FL | 2.0 | 2.0 | 1272 | $4,500 | $3.54 | 14d | 1 | 0.12mi |
| 2711 Citrus Lake Dr Unit F305 Naples, FL | 3.0 | 2.0 | 1480 | $5,500 | $3.72 | 14d | 1 | 0.12mi |
| 2731 Citrus Lake Dr #202 Naples, FL | 2.0 | 2.0 | 1260 | $2,500 | $1.98 | 14d | 1 | 0.15mi |
| 2608 Sailors Way #122 Naples, FL | 2.0 | 2.0 | 1387 | $5,500 | $3.97 | 23d | 1 | 0.25mi |
| 7710 Ahoy Ave Naples, FL | 3.0 | 2.0 | 1580 | $2,950 | $1.87 | 23d | 1 | 0.27mi |
| 2730 Sailors Way Naples, FL | 3.0 | 3.0 | 1700 | $9,000 | $5.29 | 23d | 1 | 0.30mi |
| 7030 Lone Oak Blvd Naples, FL | 3.0 | 2.0 | 1700 | $6,400 | $3.76 | 14d | 1 | 0.31mi |
| 2860 Citrus Lake Dr Unit R202 Naples, FL | 3.0 | 2.0 | 1590 | $5,000 | $3.14 | 23d | 1 | 0.31mi |
| 2860 Citrus Lake Dr Unit R-202 Naples, FL | 3.0 | 2.0 | 1590 | $5,000 | $3.14 | 14d | 1 | 0.31mi |
| 7416 Plumbago Bridge Rd #103 Naples, FL | 2.0 | 2.0 | 1223 | $2,400 | $1.96 | 14d | 1 | 0.33mi |
| 2835 Mizzen Way Naples, FL | 3.0 | 2.0 | 1641 | $2,900 | $1.77 | 23d | 1 | 0.34mi |
| 2880 Citrus Lake Dr Unit Q201 Naples, FL | 3.0 | 2.0 | 1590 | $2,495 | $1.57 | 14d | 1 | 0.35mi |
| 2885 Citrus Lake Dr Unit N103 Naples, FL | 2.0 | 2.0 | 1249 | $5,250 | $4.20 | 14d | 1 | 0.35mi |
| 2864 Mizzen Way Unit Y106 Naples, FL | 2.0 | 2.0 | 1350 | $5,200 | $3.85 | 14d | 1 | 0.35mi |
| 2476 Orchid Bay Dr Unit W201 Naples, FL | 3.0 | 2.0 | 1928 | $2,600 | $1.35 | 14d | 1 | 0.38mi |
| 3048 Horizon Ln #1104 Naples, FL | 3.0 | 2.5 | 1818 | $5,150 | $2.83 | 23d | 1 | 0.38mi |
| 7287 Mill Pond Cir Naples, FL | 3.0 | 2.0 | 1355 | $3,800 | $2.80 | 23d | 1 | 0.39mi |
| 2460 Old Groves Rd Unit E102 Naples, FL | 2.0 | 2.0 | 1226 | $2,400 | $1.96 | 14d | 1 | 0.41mi |
| 7271 Mill Pond Cir Naples, FL | 3.0 | 2.0 | 1700 | $8,250 | $4.85 | 23d | 1 | 0.41mi |
| 3035 Horizon Ln #2206 Naples, FL | 2.0 | 2.0 | 1246 | $6,000 | $4.82 | 23d | 1 | 0.41mi |
| 3051 Horizon Ln #1803 Naples, FL | 2.0 | 2.0 | 1482 | $5,100 | $3.44 | 23d | 1 | 0.42mi |
| 2516 Orchid Bay Dr #203 Naples, FL | 2.0 | 2.0 | 1360 | $4,750 | $3.49 | 23d | 1 | 0.46mi |
| 7546 Mill Pond Cir Naples, FL | 3.0 | 2.0 | 1373 | $6,500 | $4.73 | 23d | 1 | 0.48mi |
| 3015 Horizon Ln #2702 Naples, FL | 3.0 | 2.0 | 1399 | $1,790 | $1.28 | 23d | 1 | 0.52mi |
| 7518 Silver Trumpet Ln Unit Q102 Naples, FL | 2.0 | 2.0 | 1300 | $2,600 | $2.00 | 14d | 1 | 0.53mi |
| 2277 Arbour Walk Cir Naples, FL | 1.0–2.0 | 1.0–2.0 | 937 | $2,540 | $2.71 | 14d | 25 | 0.59mi |
| 3009 Driftwood Way #2802 Naples, FL | 3.0 | 2.0 | 1399 | $2,000 | $1.43 | 23d | 1 | 0.60mi |
| 7778 Emerald Cir #104 Naples, FL | 3.0 | 2.0 | 1199 | $2,300 | $1.92 | 21d | 1 | 0.61mi |
| 7778 Emerald Cir #204 Naples, FL | 3.0 | 2.0 | 1199 | $6,750 | $5.63 | 14d | 1 | 0.61mi |
| 2585 Old Groves Rd Unit L203 Naples, FL | 2.0 | 2.0 | 1448 | $5,500 | $3.80 | 14d | 1 | 0.61mi |
| 3062 Driftwood Way #4301 Naples, FL | 3.0 | 2.0 | 1573 | $6,500 | $4.13 | 23d | 1 | 0.62mi |
| 6654 Tannin Ln Unit B Naples, FL | 2.0 | 2.0 | 1441 | $3,100 | $2.15 | 23d | 1 | 0.63mi |
| 3057 Driftwood Way #4004 Naples, FL | 3.0 | 2.5 | 1818 | $6,400 | $3.52 | 23d | 1 | 0.65mi |
| 3017 Driftwood Way #3001 Naples, FL | 3.0 | 2.0 | 1385 | $5,000 | $3.61 | 23d | 1 | 0.65mi |
| 3296 Twilight Ln #6202 Naples, FL | 3.0 | 2.5 | 2133 | $6,500 | $3.05 | 14d | 1 | 0.66mi |
HOA detail condo
- Monthly dues
- $787 · $9,444/yr
- Likely covers
- waterlandscapingpool
- Assessments
- None detected in remarks — confirm with the listing agent.
Listing history 12 events
-
2026-06-18days on market $400,000 Active 142 DOM
-
2026-06-17days on market $400,000 Active 141 DOM
-
2026-06-16days on market $400,000 Active 140 DOM
-
2026-06-15days on market $400,000 Active 139 DOM
-
2026-06-14days on market $400,000 Active 137 DOM
-
2026-06-10days on market $400,000 Active 134 DOM
-
2026-06-09days on market $400,000 Active 133 DOM
-
2026-06-08days on market $400,000 Active 132 DOM
-
2026-06-07days on market $400,000 Active 131 DOM
-
2026-06-03days on market $400,000 Active 127 DOM
-
2026-06-03remarks 693-char remark
-
2026-06-03$400,000 Active 126 DOM
ⓘ Source: listings_history table (triggers on properties + properties_extension) + one-shot
backfill from property_details.listing_events for pre-trigger history.
Nearby sold comps map
Loading sold comps map…
Walkable amenities ~0.75 mi
Loading nearby amenities…
Taxation est. · year 1
- Rental income
- $55,215
- − Mortgage interest
- −$22,406
- − Property taxes
- −$6,000
- − Insurance
- −$2,000
- − Repairs & maintenance
- −$4,417
- − Management
- −$4,417
- − HOA
- −$9,444
- − Depreciation
- −$11,636
- Taxable loss
- −$5,106
- Est. tax savings @ 24.0%
- +$1,225
- After-tax cash flow
- $2,230/yr
For passive investors: Depreciation is non-cash, so a rental often shows a tax loss while cash-flowing — sheltering income. Rental losses are passive: they offset passive income freely, and up to $25,000/yr can offset ordinary (W-2) income if you actively participate and your MAGI is under $100k (phasing out to $0 by $150k); unused losses carry forward. On sale, claimed depreciation is recaptured at up to 25%, and gains may owe capital-gains tax (a 1031 exchange can defer both). Figures are a year-1 estimate at your 24.0% rate — not tax advice; consult a CPA.
Condition & rehab AI · 13 photos
This well-maintained, move-in-ready townhouse in Pelican Marsh offers stunning lake views and a peaceful retreat. The interior is in excellent condition with modern appliances and a fresh paint job, while the exterior features well-maintained landscaping and a clean, inviting appearance.
Value-add opportunities
- Both Painting the exterior and interior walls — Fresh paint can enhance curb appeal and interior aesthetics, making the property more attractive to buyers and renters.
- Both Updating the flooring — Replacing worn-out flooring with new, high-quality materials can significantly increase the property's value and appeal.
Renovation cost estimate screening
Value-add ROI direction
- Both Painting the exterior and interior walls — Fresh paint can enhance curb appeal and interior aesthetics, making the property more attractive to buyers and renters. ↑
- Both Updating the flooring — Replacing worn-out flooring with new, high-quality materials can significantly increase the property's value and appeal. ↑
ⓘ Cost ranges are severity-bucket heuristics (US national rule-of-thumb). Get contractor quotes + a written scope before underwriting a rehab budget.
Schools (NCES district)
- District
- Collier
- NCES district ID
- 1200330
- Math proficiency
- 60% ▼ -4.00%
- Reading proficiency
- 56% ▼ -2.00%
- Median HH income
- $58,275
- Composite
- 50.23/100
- National rank
- #1892
- State rank
- #16 of 73 in FL
Livability — Pelican Marsh
No livability data for this city. (Only ~50 U.S. cities are tracked.)
Census & demographics
- County
- Collier County · 396,295 people
- Metro
- Naples-Marco Island, FL
- Population (ZIP)
- 27,273
- Household income
- $92,259
- Rent vs Own
- Severe rent burden
- 1712.0
Population outlook (Collier County) Hauer SSP2
- Today (2025)
- 420,858 people
- By 2030
- 450,054 · +6.9%
- By 2040
- 502,232 · +19.3%
- By 2050
- 544,932 · +29.5%
- By 2075
- 627,203 · +49.0%
- By 2100
- 659,015 · +56.6%
Race, ethnicity, and origin ACS 2023
- Neighborhood character
- Predominantly White (78%)
- Race & ethnicity
- White 78% Hispanic / Latino 11% Two or more races 9% Black 4% Asian 4%
- Hispanic origin (detail)
- Mexican 1% Puerto Rican 1% Cuban 3%
- Common ancestry
- Romanian 5% Scotch-Irish 3% Lithuanian 2%
- Foreign-born
- 20% · Canada, Jamaica, Vietnam
- Languages at home
- 77% English-only · Spanish 10% Other Indo-European 5% Russian/Polish/Slavic 3%
Political lean MEDSL · Collier
- 2024 margin
- Solid R (+33.1) · D 33.1% · R 66.2%
- 2008→2024 swing
- -10.6pp toward R · 2008: -22.5pp · 2024: -33.1pp
- All cycles
- 2024: R+33.1 2020: R+24.7 2016: R+26.0 2012: R+30.1 2008: R+22.5
Not yet ingested
- Civics
- —
Market trends
- HPI YoY
- ▲ 0.29%
- Current HPI
- 279.357
- Rent YoY
- ▲ 0.92%
- Metro
- Naples-Marco Island, FL
- State GDP YoY
- ▲ 3.28%
- F500 in state
- 36
Industry mix (Fortune 500 HQ in FL)
| Industry | F500 HQs | Revenue |
|---|---|---|
| Industrial Technology | 2 | $29B |
|
||
| Insurance | 2 | $17B |
|
||
| Retail | 1 | $60B |
|
||
| Technology Distribution | 1 | $58B |
|
||
| Homebuilding | 1 | $35B |
|
||
| Technology Manufacturing | 1 | $35B |
|
||
Price history
-5.9% since first listed3 events — show timeline
- 2026-04-14 Price Changed $400,000 NAPLESMLS
- 2026-03-02 Price Changed $410,000 NAPLESMLS
- 2026-01-27 Listed $425,000 NAPLESMLS
Cash-flow waterfall
monthlySold comps — $/sqft
last 12 mo · ≤1 miLoading sold comps…