6344 S Highland Cir · Haltom City, TX
Flood risk 1/10 · Minimal
- FEMA flood zone
- X (unshaded)
- Chance of flooding over 30 yrs
- 0.0%
- Est. flood insurance / yr
- $507 – $1,088
Fire risk 3/10 · Minor
- Est. fire insurance / yr
- $1,222 – $2,270
Heat risk 7/10 · Major
- Hot days now (above 110°F)
- 7 days/yr
- Hot days in 30 yrs
- 23 days/yr
Wind risk 5/10 · Moderate
- Chance of severe wind over 30 yrs
- 26.0%
Air-quality risk 3/10 · Minor
- Unhealthy air days now
- 2 days/yr
- Unhealthy air days in 30 yrs
- 3 days/yr
Risk factors via First Street. Map © Google.
Why this score? — see what drove the B grade
The composite is a weighted blend of 9 inputs, each scored 0–100. Each bar is that input's sub-score; the figure is the points it added to the 100-point composite (weight × sub-score).
- Cash flow +30.0/30.0
- 1% rule +10.0/10.0
- DSCR +10.0/10.0
- ARV discount +7.5/15.0
- Rent growth +4.5/5.0
- Schools +3.7/10.0
- Livability +3.3/5.0
- Condition / age +2.5/5.0
- Appreciation +0.0/10.0
$69,000
🖨 Deal sheet (PDF) 📄 Offer letter ✓ Due diligence
Listing remarks
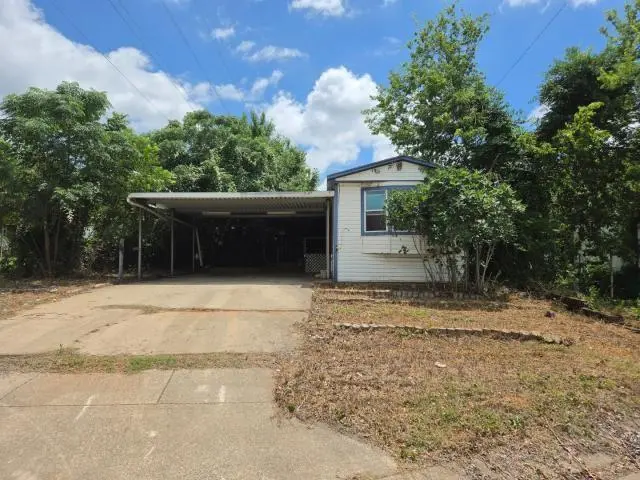
Investor special in Fort Worth! This 2-bedroom, 2-bathroom single-wide mobile home, built in 1983, offers a great opportunity for those looking to add value through renovation. The property includes a covered 2-car carport and is priced to reflect the extensive repairs and updates needed. This home requires a full renovation and is being sold strictly as-is. Cash buyers only. Whether you're looking for your next flip, rental project, or investment property, this is a chance to bring your vision to life and unlock the property's potential.
Key facts
- 6,142 sq ft lot
- Parking
- Built 1983
Property features AI
Finance
- Other: Possession at closing/funding; Photos count: 17; Transaction type: For sale
- Financial info: Listing terms: Cash; Treat as clear loan type; No second mortgage
- HOA & community: No association
Exterior
- Parking: Carport (covered) with space for 1 vehicle; No garage
- Utilities: Cable available; City sewer; City water; Electricity connected; Individual water meter
- Home design: Residential mobile home; Attached; Built in 1983
- Construction: Year built: 1983
- Exterior features: Lot smaller than 0.5 acre (about 0.141 acres); Subdivision: Highlands Add; Directions: Soloma and Highland intersection
Interior
- Kitchen: Dishwasher
- Bedrooms: Primary bedroom on level 1 (approx. 10 x 10)
- Bathrooms: 2 full bathrooms
- Interior features: Cable TV available; High-speed internet available; One living area; One dining area; Total rooms: 2; Levels: One
Neighborhood map
What this means for you Summary
Snapshot
- This is a 1-bed/1.0-bath manufactured listed at $69k.
Deal economics
- At list price, monthly cash flow is $533 ($6k/yr) — positive.
- The deal already cash-flows at list — no discount required.
- Meets the 1% rule at list price ($1k rent vs $69k).
- Cap rate 15.6% vs local median 4.3% in Haltom City — top-decile yield for the area; either an underpriced asset or a hidden risk that comps aren't pricing in. Stress-test before assuming the spread holds.
Location & tenants
- Location reads 66/100 on livability (#644 in TX) — a middle-class / working-renter tenant base. Strengths: cost of living A+, housing A+; Watch: employment D+, amenities F, commute F.
- Birdville ISD (suburban): math 42% / reading 43% proficiency, ranked #299 of 826 in TX (top 36%) — families likely to look elsewhere, expect single-tenant / working-renter base with shorter leases.
- Zoned schools: Cheney Hills El (math 22% / reading 22%, grade F, #3,333 of 4,322 statewide, top 80%, 664 students, 86% FRL) — zoned schools average 86% FRL vs 48% district-wide (38 pts higher); higher-poverty schools than district average — tighter screening recommended.
- Zoned-school proficiency averages 22% at this address vs 42% district-wide (-20 pts) — the specific schools serving this property underperform the Birdville ISD average; the district grade overstates school quality for this exact location.
- Market conditions: Rents rising fast (+7.9%/yr); 125 active listings in the ZIP; 17 comparable units currently listed for rent nearby; rentals at typical pace (median 25d on market — plan ~3-4 weeks tenant-placement turnaround); 47% of comp listings sitting > 30 days — soft ceiling on asking rent; 18,938 units permitted in Tarrant County in 2024 (8,336 in 5+ unit buildings).
Forward outlook
- Local home prices are declining (-3.0%/yr); year-one equity from $477 of loan paydown is wiped out by about $2k of value loss. Plan a longer hold.
- Tarrant County population projected at +41% by 2050 — long-run rental-demand tailwind backs the buy-and-hold thesis.
- At projected returns (-3.0% appreciation + 7.9% rent growth), your $19k cash investment doubles in ~4 years — after that, you're playing with house money.
Negotiation context
- Only 4 days on market — expect competitive offers; lowballing is unlikely to land.
Risks & watch-outs
- Climate carrying-cost: moderate wind risk, 26% chance of damaging wind over 30y; extreme-heat days projected 7→23/yr by 2055 (HVAC capex compounding) — expect insurance premiums to compound above CPI over the hold.
Questions for the listing agent
- Is there a deadline driving the sale (1031 exchange, divorce, estate, relocation)? That informs how much negotiation room exists.
- Schools are D-rated, which usually means shorter tenancies and higher turnover. Who's the typical renter profile here, and what's been the actual vacancy rate?
- What's the average days-on-market for RENTAL listings here right now (not sales)? A rising rental-DOM trend means longer vacancies and softer asking-rent achievability than the comps imply.
- What's the recent tenant-quality profile in this submarket — average credit score on applications, eviction rate, late-payment / NSF rate, and stable-employment percentage? A property-management company in the area should have these aggregated.
- How much new for-sale + rental construction is in the pipeline within 1–3 miles? Heavy new supply typically softens prices + rents 12–24 months out; constrained supply supports both.
Investment metrics
- 1% rule
- 1.78% ✓
- Cap rate
- 15.57%
- Cash-on-cash
- 33.13%
- DSCR
- 2.47
- GRM
- 4.7
CMA / ARV
No comps found within radius.
Projected returns pro-forma
-3.0% appreciation · 7.89% rent growth · sell at horizon
- IRR
- 33.6%
- Equity multiple
- 2.51×
- Total profit
- $29,138
- Equity at exit
- $10,288
- IRR
- 43.0%
- Equity multiple
- 6.07×
- Total profit
- $97,945
- Equity at exit
- $5,966
Cash invested: $19,320 (down + closing). Projections, not guarantees.
Landlord ↔ Tenant lean methodology
- Overall (STATE)
- 87 Strongly Landlord-Friendly
- State Texas
- 87 Strongly Landlord-Friendly · R+5
- County
- — inherits STATE
- City
- — inherits STATE
ZIP-level market 76117
- Home prices YoY
- -23.9%
- Rents YoY
- 7.9%
- Active inventory
- 125
- Price-to-rent
- 4.7×
Monthly cashflow live
- Estimated rent
- $1,231 high interval (Pro) →
- Mortgage (P&I)
- −$362
- Tax from tax record
- −$48 /mo · $578/yr
- Insurance
- −$29
- HOA
- −$0
- Vacancy / Maint / Mgmt
- −$258
- Net cashflow
- $533
Break-even live
Sensitivity live
| Price | -10% $572 | -5% $553 | +0% $533 | +5% $514 | +10% $494 |
|---|---|---|---|---|---|
| Rent | -10% $436 | -5% $485 | +0% $533 | +5% $582 | +10% $631 |
| Rate | -1.0pp $568 | -0.5pp $551 | base $533 | +0.5pp $515 | +1.0pp $497 |
UW: 25.0% down · 7.5% · 30yr · 1.5% tax · 5.0% vac · 8.0% maint · 8.0% mgmt
Financing live
Cash to close
- Down payment
- $17,250
- Closing costs
- $2,070
- Reserves months
- —
- Total cash needed
- —
Loan-product check · same deal, 3 products live
Conventional
25% down · 7.5% · 30yr
- Down + closing
- —
- Monthly P&I
- —
- Monthly cashflow
- —
- DSCR
- —
- Eligible?
- —
Personal DTI + credit; lowest rate.
DSCR
20% down · 8.5% · 30yr
- Down + closing
- —
- Monthly P&I
- —
- Monthly cashflow
- —
- DSCR
- —
- Eligible?
- —
No personal income docs; deal must DSCR.
Hard money
10% down · 12.0% · 12mo
- Down + closing
- —
- Monthly P&I
- —
- Monthly cashflow
- —
- DSCR
- —
- Eligible?
- —
Short-term bridge; refi at stabilization.
Rent comps 17 comps
| Address | Beds | Baths | Sqft | Rent | $/sqft | DOM | Units | Dist |
|---|---|---|---|---|---|---|---|---|
| 6324 Baker Blvd Richland Hills, TX | 1.0–2.0 | 1.0–1.5 | 850 | $1,019 | $1.20 | 2d | 22 | 0.42mi |
| 6200 Baker Blvd Fort Worth, TX | 1.0 | 1.0 | 745 | $988 | $1.33 | 25d | 1 | 0.50mi |
| 6520 Park Place Dr Richland Hills, TX | 2.0–3.0 | 1.0–2.0 | 1317 | $1,100 | $0.84 | 2d | 3 | 0.71mi |
| 6605 Park Place Dr Richland Hills, TX | 2.0 | 2.0 | 1192 | $1,450 | $1.22 | 44d | 1 | 0.76mi |
| 6605 Park Place Dr Unit D Richland Hills, TX | 2.0 | 1.5 | 1192 | $1,450 | $1.22 | 25d | 1 | 0.77mi |
| 3208 Matthews Dr Richland Hills, TX | 2.0 | 1.5 | 1000 | $1,490 | $1.49 | 44d | 1 | 0.88mi |
| 3216 Matthews Dr Richland Hills, TX | 2.0 | 1.5 | 1000 | $1,490 | $1.49 | 44d | 1 | 0.88mi |
| 3218 Matthews Dr Richland Hills, TX | 2.0 | 1.5 | 1000 | $1,480 | $1.48 | 44d | 1 | 0.88mi |
| 6305 Richland Plaza Dr Unit 6305 North Richland Hills, TX | 2.0 | 1.0 | 960 | $1,350 | $1.41 | 44d | 1 | 0.96mi |
| 6321 Richland Plaza Dr Apt D North Richland Hills, TX | 2.0 | 1.0 | 960 | $1,100 | $1.15 | 15d | 1 | 0.97mi |
| 5501 Adams Dr Haltom City, TX | 2.0 | 1.0 | 889 | $1,215 | $1.37 | 3d | 1 | 1.05mi |
| 5501 Adams Dr Haltom City, TX | 2.0 | 1.0 | 889 | $1,215 | $1.37 | 13d | 1 | 1.05mi |
| 5501 Adams Dr Haltom City, TX | 2.0 | 1.0 | 889 | $1,215 | $1.37 | 11d | 1 | 1.05mi |
| 5501 Adams Dr Haltom City, TX | 2.0 | 1.0 | 889 | $1,250 | $1.41 | 44d | 1 | 1.05mi |
| 3760 Kris St North Richland Hills, TX | 2.0 | 1.0 | 880 | $1,495 | $1.70 | 44d | 1 | 1.29mi |
| 5280 Fossil Dr Haltom City, TX | 1.0 | 1.0 | 700 | $1,050 | $1.50 | 25d | 1 | 1.31mi |
| 6419 Onyx Dr N North Richland Hills, TX | 2.0 | 1.0 | 1012 | $1,625 | $1.61 | 44d | 1 | 1.32mi |
Listing history 3 events
-
2026-06-13statusdays on market $69,000 Pending 4 DOM
-
2026-06-08remarks 544-char remark
-
2026-06-08$69,000 Active 1 DOM
ⓘ Source: listings_history table (triggers on properties + properties_extension) + one-shot
backfill from property_details.listing_events for pre-trigger history.
Tax reassessment forecast TX · Resets to sale price
- Current annual tax
- $578 · $48/mo
- Projected year-2 tax
- $1,263 · $105/mo
- Expected delta
- +$684/yr (+$57/mo · 118.4%)
ⓘ Screening estimate from a state-policy table — verify with the county assessor before closing.
Climate risk First Street
- Flood 1/10 Low FEMA zone X (unshaded) · 0% chance over 30 yrs
- Wildfire 3/10 Moderate
- Heat 7/10 Severe 7 d/yr ≥110°F today · 23 d/yr by 30 yrs out
- Wind 5/10 Major 26% chance of damaging wind over 30 yrs
- Air quality 3/10 Moderate 2 unhealthy d/yr today · 3 by 30 yrs out
Nearby sold comps map
Loading sold comps map…
Walkable amenities ~0.75 mi
Loading nearby amenities…
Taxation est. · year 1
- Rental income
- $14,767
- − Mortgage interest
- −$3,865
- − Property taxes
- −$578
- − Insurance
- −$345
- − Repairs & maintenance
- −$1,181
- − Management
- −$1,181
- − Depreciation
- −$2,007
- Taxable income
- $5,608
- Est. tax owed @ 24.0%
- −$1,346
- After-tax cash flow
- $5,054/yr
For passive investors: Depreciation is non-cash, so a rental often shows a tax loss while cash-flowing — sheltering income. Rental losses are passive: they offset passive income freely, and up to $25,000/yr can offset ordinary (W-2) income if you actively participate and your MAGI is under $100k (phasing out to $0 by $150k); unused losses carry forward. On sale, claimed depreciation is recaptured at up to 25%, and gains may owe capital-gains tax (a 1031 exchange can defer both). Figures are a year-1 estimate at your 24.0% rate — not tax advice; consult a CPA.
Schools (NCES district)
- District
- Birdville ISD
- NCES district ID
- 4810230
- Math proficiency
- 42% ▼ -12.00%
- Reading proficiency
- 43% ▼ -6.00%
- Median HH income
- $55,930
- Composite
- 37.13/100
- National rank
- #4491
- State rank
- #299 of 826 in TX
Livability — Haltom City
- Score
- 66/100
- State rank
- #644
- US rank
- #12214
Category grades
Schools grade is shown separately in the Schools card above.
Census & demographics
- Census place
- Haltom City, TX
- County
- Tarrant County · 2,033,669 people
- City population
- 32,950
- Metro
- Dallas-Fort Worth-Arlington, TX
- Population (ZIP)
- 32,950
- Household income
- $51,670
- Rent vs Own
- Severe rent burden
- 1105.0
Population outlook (Tarrant County) Hauer SSP2
- Today (2025)
- 2,380,417 people
- By 2030
- 2,578,900 · +8.3%
- By 2040
- 2,974,995 · +25.0%
- By 2050
- 3,350,489 · +40.8%
- By 2075
- 4,216,909 · +77.2%
- By 2100
- 4,741,527 · +99.2%
Race, ethnicity, and origin ACS 2023
- Neighborhood character
- Diverse neighborhood (Simpson 0.64)
- Race & ethnicity
- Hispanic / Latino 46% White 38% Two or more races 18% Asian 7% Black 6%
- Hispanic origin (detail)
- Mexican 42% Puerto Rican 1%
- Common ancestry
- Italian 2% Serbian 1% Lithuanian 1%
- Foreign-born
- 24% · Canada, Vietnam
- Languages at home
- 56% English-only · Spanish 36% Other Asian/Pacific 4% Vietnamese 2%
Political lean MEDSL · Tarrant
- 2024 margin
- Lean R (+5.1) · D 46.7% · R 51.9% · Other 1.4%
- 2008→2024 swing
- +6.6pp toward D · 2008: -11.7pp · 2024: -5.1pp
- All cycles
- 2024: R+5.1 2020: D+0.2 2016: R+8.7 2012: R+15.7 2008: R+11.7
Not yet ingested
- Civics
- —
Market trends
- HPI YoY
- ▼ -103.25%
- Current HPI
- 328.69
- Rent YoY
- ▲ 7.89%
- Metro
- Dallas-Fort Worth-Arlington, TX
- State GDP YoY
- ▲ 3.95%
- F500 in state
- 110
Industry mix (Fortune 500 HQ in TX)
| Industry | F500 HQs | Revenue |
|---|---|---|
| Energy | 16 | $1,198B |
|
||
| Technology | 5 | $198B |
|
||
| Engineering / Construction | 4 | $72B |
|
||
| Energy Services | 3 | $60B |
|
||
| Utilities | 3 | $41B |
|
||
| Healthcare | 2 | $330B |
|
||
Price history
5 events — show timeline
- 2026-06-08 Listed $69,000 NTREIS
- 2026-05-05 Sold (Public Records) — Public Records
- 2026-05-05 Sold (Public Records) — Public Records
- 2026-05-05 Sold (Public Records) — Public Records
- 1988-09-08 Sold (Public Records) — Public Records
Property tax history
+0.4%/yrLatest (2025): $578 · -2.4% YoY. Source: county tax records.
Cash-flow waterfall
monthlySold comps — $/sqft
last 12 mo · ≤1 miLoading sold comps…