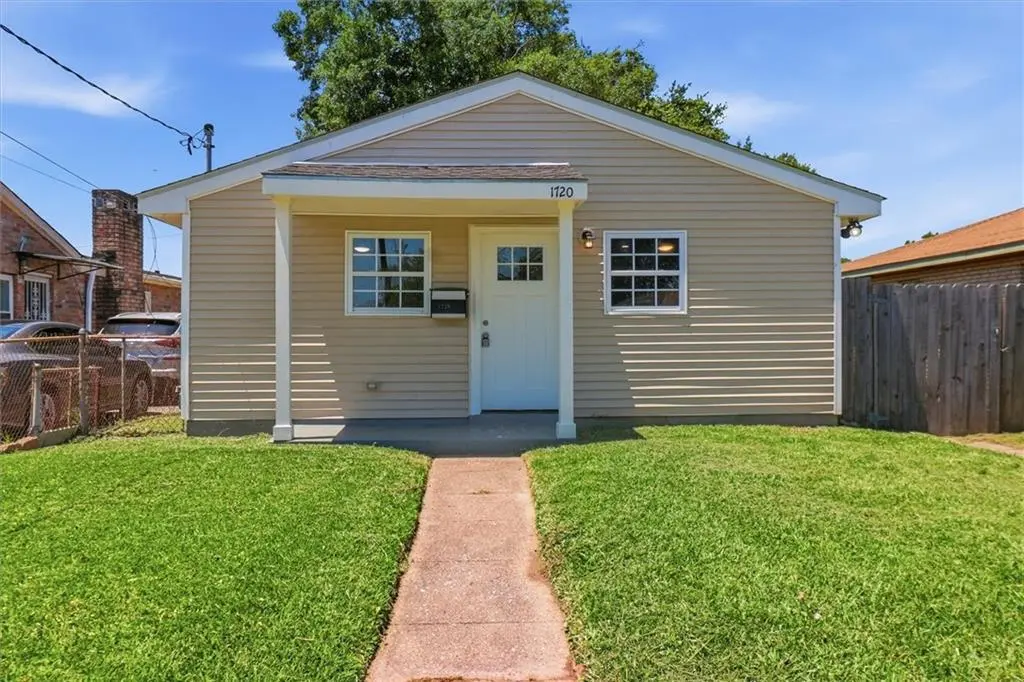
1720 Plaza Dr · Marrero, LA
Flood risk 8/10 · Major
- FEMA flood zone
- X
- Chance of flooding over 30 yrs
- 0.6%
- Est. flood insurance / yr
- $507 – $1,088
Fire risk 1/10 · Minimal
- Est. fire insurance / yr
- $1,269 – $2,357
Heat risk 10/10 · Severe
- Hot days now (above 109°F)
- 7 days/yr
- Hot days in 30 yrs
- 21 days/yr
Wind risk 10/10 · Severe
- Chance of severe wind over 30 yrs
- 99.0%
Air-quality risk 3/10 · Minor
- Unhealthy air days now
- 3 days/yr
- Unhealthy air days in 30 yrs
- 4 days/yr
Risk factors via First Street. Map © Google.
Why this score? — see what drove the B- grade
The composite is a weighted blend of 9 inputs, each scored 0–100. Each bar is that input's sub-score; the figure is the points it added to the 100-point composite (weight × sub-score).
- Cash flow +29.5/30.0
- ARV discount +11.3/15.0
- DSCR +10.0/10.0
- 1% rule +7.4/10.0
- Livability +3.4/5.0
- Rent growth +2.8/5.0
- Schools +2.5/10.0
- Condition / age +2.5/5.0
- Appreciation +0.0/10.0
$139,000
🖨 Deal sheet (PDF) 📄 Offer letter ✓ Due diligence
Listing remarks
Beautifully renovated 3 bedroom, 1 bath home tucked away in a quiet neighborhood! Whether you’re looking for an affordable starter home or your next investment property, this move-in ready home checks all the boxes. Inside, you’ll find updated finishes throughout along with the comfort of central A/C. Major improvements have already been taken care of, including a roof that’s only 3 years old and newer windows. Step outside to a spacious backyard with rear yard access, offering plenty of room for entertaining, storage, boats, trailers, or future possibilities. Don’t miss this great opportunity! Flood Zone X. Owner/Agent
Key facts
- Parking
- Built 1968
- Listed 33 days
Neighborhood map
What this means for you Summary
Snapshot
- This is a 3-bed/1.0-bath single-family listed at $139k.
Deal economics
- At list price, monthly cash flow is $432 ($5k/yr) — positive.
- The deal already cash-flows at list — no discount required.
- Meets the 1% rule at list price ($2k rent vs $139k).
- Recommended offer: $135k (3.0% below list) — sets the bar for market timing.
- Cap rate 10.6% vs local median 6.0% in Marrero — top-decile yield for the area; either an underpriced asset or a hidden risk that comps aren't pricing in. Stress-test before assuming the spread holds.
Location & tenants
- Location reads 67/100 on livability (#104 in LA) — a middle-class / working-renter tenant base. Strengths: cost of living A+, housing A+, health & safety A+; Watch: crime F, amenities F, commute F.
- Jefferson Parish (suburban): math 24% / reading 34% proficiency, ranked #44 of 98 in LA (top 45%) — low school quality limits family demand, transient renter base, plan for 1-2y turnover; 70% free/reduced lunch — lower-income household profile, screen leases tightly.
- Zoned schools: Ray St. Pierre Academy For Advanced Studies (math 82% / reading 82%, grade A+, #9 of 646 statewide, top 1%, 336 students, 26% FRL); Stella Worley Middle School (math 7% / reading 19%, grade F, #189 of 218 statewide, top 87%, 470 students, 80% FRL); John Ehret High School (math 19% / reading 27%, grade F, #169 of 265 statewide, top 64%, 1,579 students, 66% FRL).
- Market conditions: Rents rising (+1.1%/yr); 299 active listings in the ZIP; 7 comparable units currently listed for rent nearby; rentals at typical pace (median 25d on market — plan ~3-4 weeks tenant-placement turnaround); 43% of comp listings sitting > 30 days — soft ceiling on asking rent; 518 units permitted in Jefferson Parish in 2024 (43 in 5+ unit buildings).
- This rent runs 38% of the median local income ($55k/yr) — at the standard rent-burdened threshold; future hikes will face affordability resistance.
Forward outlook
- Local home prices are declining (-3.0%/yr); year-one equity from $961 of loan paydown is wiped out by about $4k of value loss. Plan a longer hold.
Negotiation context
- It's been on market 34 days — a 3% lower offer ($135k) is reasonable based on typical stale-listing flexibility.
- 3 sale attempts since 3y ago; this cycle's ask is 9167% above the opening price — seller raised mid-cycle; expect resistance to lowballs.
- Current owner paid $72k; list at $139k implies a 92% gain — meaningful room to come down on a strong offer.
Risks & watch-outs
- Watch-outs: flood insurance adds $66/mo.
- Climate carrying-cost: severe flood risk; severe wind risk, 99% chance of damaging wind over 30y; extreme-heat days projected 7→21/yr by 2055 (HVAC capex compounding) — expect insurance premiums to compound above CPI over the hold.
Questions for the listing agent
- It's been on market 34 days. Have you received any prior offers? Is the seller open to a 3% concession, seller financing, or rate buy-down credit?
- Built in 1968 — when were the roof, HVAC, electrical panel, plumbing, and water heater last replaced?
- What's the actual annual flood-insurance premium (NFIP or private), and is the property in a SFHA with mandatory coverage?
- Is there a deadline driving the sale (1031 exchange, divorce, estate, relocation)? That informs how much negotiation room exists.
- Schools are B-rated — typically a magnet for longer-tenancy family renters. What's the average tenant stay here, and is there a school-zone premium baked into asking?
- Crime grade is F in this area — have there been break-ins, vandalism, or insurance claims at this property in the last 3 years? What carrier currently insures it and at what premium?
- What's the average days-on-market for RENTAL listings here right now (not sales)? A rising rental-DOM trend means longer vacancies and softer asking-rent achievability than the comps imply.
- What's the recent tenant-quality profile in this submarket — average credit score on applications, eviction rate, late-payment / NSF rate, and stable-employment percentage? A property-management company in the area should have these aggregated.
- How much new for-sale + rental construction is in the pipeline within 1–3 miles? Heavy new supply typically softens prices + rents 12–24 months out; constrained supply supports both.
Investment metrics
- 1% rule
- 1.24% ✓
- Cap rate
- 10.60%
- Cash-on-cash
- 15.38%
- DSCR
- 1.68
- GRM
- 6.7
CMA / ARV
- ARV (median comp)
- $151,867
- List price
- $139,000
- Delta
- -8.47%
- Verdict
- FAIR
- Comps
- 20 within 1.0 mi
Show comp detail 5 sales within ~0.75 mi
| Address | Dist | Beds/Ba | Sqft | Sold | Price | $/sf | Match |
|---|---|---|---|---|---|---|---|
| 1637 Buccola Ave | 0.15mi | 3/1.0 | 943 (+5%) | 13mo | $145,000 | $154 | 74 |
| 1645 Plaza Dr | 0.13mi | 2/1.0 (-1) | 771 (-14%) | 8mo | $104,000 | $135 | 58 |
| 1409 Lincoln Ave | 0.44mi | 3/1.5 | 847 (-6%) | 14mo | $155,000 | $183 | 56 |
| 1120 Saint Ann St | 0.68mi | 3/1.5 | 1,000 (+11%) | 6mo | $130,000 | $130 | 43 |
| 919 Cohen St | 0.68mi | 3/1.0 | 1,001 (+11%) | 23mo | $135,000 | $135 | 30 |
Match score weights: distance 35% · size 25% · config 20% · recency 20%. Top-matched comps best support the ARV.
Projected returns pro-forma
-3.0% appreciation · 1.05% rent growth · sell at horizon
- IRR
- 1.2%
- Equity multiple
- 1.04×
- Total profit
- $1,690
- Equity at exit
- $20,725
- IRR
- 8.8%
- Equity multiple
- 1.61×
- Total profit
- $23,844
- Equity at exit
- $12,018
Cash invested: $38,920 (down + closing). Projections, not guarantees.
Landlord ↔ Tenant lean methodology
- Overall (STATE)
- 90 Strongly Landlord-Friendly
- State Louisiana
- 90 Strongly Landlord-Friendly · R+12
- County
- — inherits STATE
- City
- — inherits STATE
ZIP-level market 70072
- Rents YoY
- 1.1%
- Active inventory
- 299
- Price-to-rent
- 6.7×
Monthly cashflow live
- Estimated rent
- $1,726 high interval (Pro) →
- Mortgage (P&I)
- −$729
- Tax from tax record
- −$78 /mo · $936/yr
- Insurance
- −$58
- Flood insurance flood zone
- −$66 /mo · $798/yr
- HOA
- −$0
- Vacancy / Maint / Mgmt
- −$362
- Net cashflow
- $432
Break-even live
Sensitivity live
| Price | -10% $511 | -5% $472 | +0% $432 | +5% $393 | +10% $354 |
|---|---|---|---|---|---|
| Rent | -10% $296 | -5% $364 | +0% $432 | +5% $500 | +10% $569 |
| Rate | -1.0pp $502 | -0.5pp $468 | base $432 | +0.5pp $396 | +1.0pp $360 |
UW: 25.0% down · 7.5% · 30yr · 1.5% tax · 5.0% vac · 8.0% maint · 8.0% mgmt
Financing live
Cash to close
- Down payment
- $34,750
- Closing costs
- $4,170
- Reserves months
- —
- Total cash needed
- —
Loan-product check · same deal, 3 products live
Conventional
25% down · 7.5% · 30yr
- Down + closing
- —
- Monthly P&I
- —
- Monthly cashflow
- —
- DSCR
- —
- Eligible?
- —
Personal DTI + credit; lowest rate.
DSCR
20% down · 8.5% · 30yr
- Down + closing
- —
- Monthly P&I
- —
- Monthly cashflow
- —
- DSCR
- —
- Eligible?
- —
No personal income docs; deal must DSCR.
Hard money
10% down · 12.0% · 12mo
- Down + closing
- —
- Monthly P&I
- —
- Monthly cashflow
- —
- DSCR
- —
- Eligible?
- —
Short-term bridge; refi at stabilization.
Rent comps 7 comps
| Address | Beds | Baths | Sqft | Rent | $/sqft | DOM | Units | Dist |
|---|---|---|---|---|---|---|---|---|
| 1836 Plaza Dr Unit A Marrero, LA | 3.0 | 1.0 | 1040 | $1,700 | $1.63 | 45d | 1 | 0.19mi |
| 1836 Plaza Dr Unit C Marrero, LA | 3.0 | 1.0 | 1040 | $1,700 | $1.63 | 6d | 1 | 0.19mi |
| 5160 Evans Dr Marrero, LA | 3.0 | 1.0 | 1000 | $1,500 | $1.50 | 45d | 1 | 0.89mi |
| 1917 Gladstone Dr Marrero, LA | 3.0 | 2.0 | 1090 | $1,600 | $1.47 | 25d | 1 | 0.96mi |
| 524 Bertucci St Marrero, LA | 2.0 | 1.0 | 960 | $1,300 | $1.35 | 16d | 1 | 1.18mi |
| 320 Marrero Rd Marrero, LA | 2.0 | 1.0 | 900 | $1,200 | $1.33 | 45d | 1 | 1.29mi |
| 7429 Pritchard St Marrero, LA | 2.0 | 1.0 | 925 | $1,150 | $1.24 | 16d | 1 | 1.32mi |
Listing history 16 events
-
2026-06-08days on market $139,000 Active 34 DOM
-
2026-06-07days on market $139,000 Active 33 DOM
-
2026-06-03days on market $139,000 Active 29 DOM
-
2026-06-02days on market $139,000 Active 28 DOM
-
2026-06-01days on market $139,000 Active 27 DOM
-
2026-05-31days on market $139,000 Active 26 DOM
-
2026-05-14$1,500
-
2026-05-05$139,000 Active 627-char remark
-
2026-05-05$139,000 Active 651-char remark
-
2023-10-02price $150,000
-
2023-09-14price $155,000
-
2023-08-21price $159,000
-
2023-08-04price $160,000
-
2023-07-06$150,000
-
2023-04-10soldstatus $72,500
-
1990-12-01soldstatus
ⓘ Source: listings_history table (triggers on properties + properties_extension) + one-shot
backfill from property_details.listing_events for pre-trigger history.
Tax reassessment forecast LA · Resets to sale price
- Current annual tax
- $936 · $78/mo
- Projected year-2 tax
- $936 · $78/mo
- Expected delta
- $0/yr ($0/mo · 0.0%)
ⓘ Screening estimate from a state-policy table — verify with the county assessor before closing.
Climate risk First Street
- Flood 8/10 Severe FEMA zone X · 60% chance over 30 yrs
- Wildfire 1/10 Low
- Heat 10/10 Extreme 7 d/yr ≥109°F today · 21 d/yr by 30 yrs out
- Wind 10/10 Extreme 99% chance of damaging wind over 30 yrs
- Air quality 3/10 Moderate 3 unhealthy d/yr today · 4 by 30 yrs out
Nearby sold comps map
Loading sold comps map…
Walkable amenities ~0.75 mi
Loading nearby amenities…
Taxation est. · year 1
- Rental income
- $20,712
- − Mortgage interest
- −$7,786
- − Property taxes
- −$936
- − Insurance
- −$1,492
- − Repairs & maintenance
- −$1,657
- − Management
- −$1,657
- − Depreciation
- −$4,044
- Taxable income
- $3,140
- Est. tax owed @ 24.0%
- −$754
- After-tax cash flow
- $4,433/yr
For passive investors: Depreciation is non-cash, so a rental often shows a tax loss while cash-flowing — sheltering income. Rental losses are passive: they offset passive income freely, and up to $25,000/yr can offset ordinary (W-2) income if you actively participate and your MAGI is under $100k (phasing out to $0 by $150k); unused losses carry forward. On sale, claimed depreciation is recaptured at up to 25%, and gains may owe capital-gains tax (a 1031 exchange can defer both). Figures are a year-1 estimate at your 24.0% rate — not tax advice; consult a CPA.
Schools (NCES district)
- District
- Jefferson Parish
- NCES district ID
- 2200840
- Math proficiency
- 24% ▼ -36.00%
- Reading proficiency
- 34% ▼ -30.00%
- Median HH income
- $48,421
- Composite
- 25.19/100
- National rank
- #7511
- State rank
- #44 of 98 in LA
Livability — Marrero
- Score
- 67/100
- State rank
- #104
- US rank
- #10146
Category grades
Schools grade is shown separately in the Schools card above.
Census & demographics
- Census place
- Marrero, LA
- County
- Jefferson Parish · 426,999 people
- City population
- 55,693
- Metro
- New Orleans-Metairie, LA
- Population (ZIP)
- 55,693
- Household income
- $54,885
- Rent vs Own
- Severe rent burden
- 1807.0
Population outlook (Jefferson County) Hauer SSP2
- Today (2025)
- 451,696 people
- By 2030
- 455,451 · +0.8%
- By 2040
- 458,308 · +1.5%
- By 2050
- 461,031 · +2.1%
- By 2075
- 476,351 · +5.5%
- By 2100
- 499,377 · +10.6%
Race, ethnicity, and origin ACS 2023
- Neighborhood character
- Diverse neighborhood (Simpson 0.67)
- Race & ethnicity
- Black 40% White 39% Hispanic / Latino 12% Two or more races 7% Asian 5%
- Hispanic origin (detail)
- Mexican 4% Dominican 1%
- Common ancestry
- Lithuanian 12% Hispanic 1%
- Foreign-born
- 10% · Canada, Vietnam, Jamaica
- Languages at home
- 85% English-only · Spanish 8% Vietnamese 4% French/Haitian/Cajun 2%
Political lean MEDSL · Jefferson
- 2024 margin
- R (+12.9) · D 42.5% · R 55.5% · Other 2.1%
- 2008→2024 swing
- +13.6pp toward D · 2008: -26.6pp · 2024: -12.9pp
- All cycles
- 2024: R+12.9 2020: R+11.1 2016: R+14.8 2012: R+18.4 2008: R+26.6
Not yet ingested
- Civics
- —
Market trends
- HPI YoY
- ▼ -89.87%
- Current HPI
- 161.7477
- Rent YoY
- ▲ 1.05%
- Metro
- New Orleans-Metairie, LA
- State GDP YoY
- ▲ 3.29%
- F500 in state
- 10
Industry mix (Fortune 500 HQ in LA)
| Industry | F500 HQs | Revenue |
|---|---|---|
| Telecommunications | 2 | $23B |
|
||
| Utilities | 1 | $12B |
|
||
| Wholesale / Distribution | 1 | $5B |
|
||
| Advertising | 1 | $2B |
|
||
Price history
-97.9% since first listed10 events — show timeline
- 2026-06-09 Rental Removed $1,500 RAAMLS
- 2026-05-14 Listed for Rent $1,500 RAAMLS
- 2026-05-05 Listed $139,000 AcadianaMLS
- 2023-10-02 Price Changed $150,000 GSREIN
- 2023-09-14 Price Changed $155,000 GSREIN
- 2023-08-21 Price Changed $159,000 GSREIN
- 2023-08-04 Price Changed $160,000 GSREIN
- 2023-07-06 Listed $150,000 AcadianaMLS
- 2023-04-10 Sold (Public Records) $72,500 Public Records
- 1990-12-01 Sold (Public Records) — Public Records
Property tax history
+5.0%/yrLatest (2025): $936 · +0.3% YoY. Source: county tax records.
Cash-flow waterfall
monthlySold comps — $/sqft
last 12 mo · ≤1 miLoading sold comps…