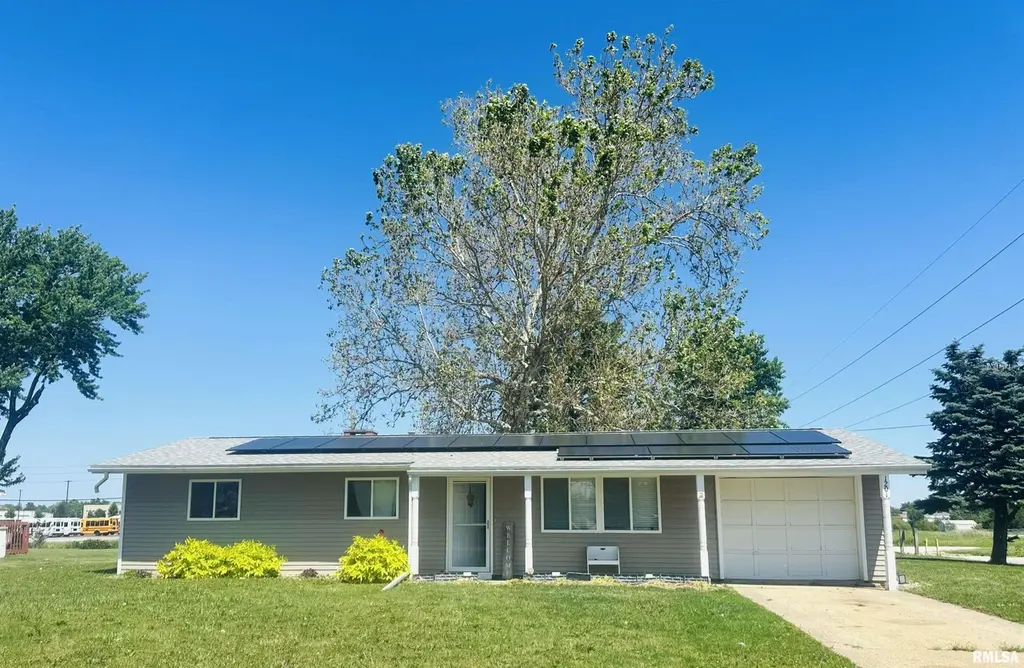
1201 Eagle Ave · Washington, IL
Flood risk 1/10 · Minimal
- FEMA flood zone
- X (unshaded)
- Chance of flooding over 30 yrs
- 0.0%
- Est. flood insurance / yr
- $507 – $1,088
Fire risk 1/10 · Minimal
- Est. fire insurance / yr
- $804 – $1,492
Heat risk 3/10 · Minor
- Hot days now (above 104°F)
- 7 days/yr
- Hot days in 30 yrs
- 18 days/yr
Wind risk 2/10 · Minimal
- Chance of severe wind over 30 yrs
- 1.0%
Air-quality risk 2/10 · Minimal
- Unhealthy air days now
- 1 days/yr
- Unhealthy air days in 30 yrs
- 1 days/yr
Risk factors via First Street. Map © Google.
Why this score? — see what drove the F grade
The composite is a weighted blend of 9 inputs, each scored 0–100. Each bar is that input's sub-score; the figure is the points it added to the 100-point composite (weight × sub-score).
- ARV discount +7.5/15.0
- Cash flow +4.5/30.0
- Schools +3.8/10.0
- Livability +3.7/5.0
- Rent growth +2.5/5.0
- Condition / age +2.5/5.0
- 1% rule +0.0/10.0
- DSCR +0.0/10.0
- Appreciation +0.0/10.0
$199,900
🖨 Deal sheet 📄 Offer letter ✓ Due diligence
Listing remarks
Stellar location for this 4 bedroom cutie that backs right up to the walking trail/bike path! Vaulted ceilings and open concept in the kitchen/living room. Bright and cheery kitchen has breakfast bar and sliders to the back deck. Walkout basement features a family room with fireplace and 4th bedroom. Make your appointment today!
Key facts
- Garage
- Built 1955
- Listed 21 days
Property features AI
Exterior
- Parking: Attached garage (1 car)
- Utilities: Public water; Public sewer
- Home design: Single-family residence; Built in 1955
- Construction: Composition roof
- Exterior features: Level lot; Lot dimensions approximately 129 x 102 x 125
Interior
- Kitchen: Kitchen on main level — hardwood floor, approximately 15 x 10
- Bedrooms: 4 bedrooms total; Bedroom 1 (Main level) — 12 x 10, hardwood floor, egress window; Bedroom 2 (Main level) — 12 x 10, hardwood floor, egress window; Bedroom 3 (Main level) — 10 x 9, hardwood floor, egress window; Bedroom 4 (Basement) — 10 x 10, laminate floor, no egress window
- Flooring: Hardwood flooring in main-level living areas and most bedrooms; Laminate flooring in basement rooms
- Bathrooms: 1 full bathroom
- Heating & cooling: Forced air heating; Central air conditioning
- Interior features: Wood-burning fireplace in the family room; Full basement
- Laundry & utility: Main level laundry room — 6 x 6
Neighborhood map
What this means for you Summary
Snapshot
- This is a 3-bed/1.0-bath single-family listed at $200k.
Deal economics
- At list price, monthly cash flow is $-515 ($-6k/yr) — negative.
- To cash-flow at today's rent, offer at most $109k (45.5% below list).
- To meet the 1% rule (rent ≥ 1% of price), the offer needs to be $95k (52.5% below list).
- Recommended offer: $95k (52.5% below list) — sets the bar for 1% rule.
Location & tenants
- Location reads 73/100 on livability (#272 in IL) — a middle-class / working-renter tenant base. Strengths: crime A+, employment A+, cost of living A+; Watch: amenities F, commute F, health & safety F.
- Washington Chsd 308 (suburban): math 42% / reading 42% proficiency, ranked #112 of 620 in IL (top 18%) — families likely to look elsewhere, expect single-tenant / working-renter base with shorter leases.
- Zoned schools: Washington Comm High School (math 42% / reading 42%, grade F, #76 of 693 statewide, top 12%, 1,484 students, 0% FRL).
- Market conditions: 129 active listings in the ZIP; 1 comparable units currently listed for rent nearby; 77 units permitted in Tazewell County in 2024 (0 in 5+ unit buildings).
Forward outlook
- Local home prices are declining (-3.0%/yr); year-one equity from $1k of loan paydown is wiped out by about $6k of value loss. Plan a longer hold.
- Tazewell County population projected at -15% by 2050 — secular population decline; favor cash flow + early exit over multi-decade hold.
Negotiation context
- It's been on market 21 days — a 2% lower offer ($197k) is reasonable based on typical stale-listing flexibility.
- Current owner paid $131k; list at $200k implies a 53% gain — meaningful room to come down on a strong offer.
Risks & watch-outs
- Watch-outs: built in 1955 — expect roof / HVAC / electrical / plumbing capex.
Questions for the listing agent
- What do current leases actually rent for vs. the listed asking? Can we see a recent rent roll and the last 12 months of T-12 income?
- Built in 1955 — when were the roof, HVAC, electrical panel, plumbing, and water heater last replaced?
- Is there a deadline driving the sale (1031 exchange, divorce, estate, relocation)? That informs how much negotiation room exists.
- The area grade is low — what's the realistic commute time and amenity access for the typical tenant pool here? Any planned neighborhood developments (good or bad) we should know about?
- What's the average days-on-market for RENTAL listings here right now (not sales)? A rising rental-DOM trend means longer vacancies and softer asking-rent achievability than the comps imply.
- What's the recent tenant-quality profile in this submarket — average credit score on applications, eviction rate, late-payment / NSF rate, and stable-employment percentage? A property-management company in the area should have these aggregated.
- How much new for-sale + rental construction is in the pipeline within 1–3 miles? Heavy new supply typically softens prices + rents 12–24 months out; constrained supply supports both.
Investment metrics
- 1% rule
- 0.48% ✗
- Cap rate
- 3.20%
- Cash-on-cash
- -11.03%
- DSCR
- 0.51
- GRM
- 17.5
CMA / ARV
- ARV (on-the-fly)
- $132,594
- Comps found
- 5
Show comp detail 5 sales within ~0.75 mi
| Address | Dist | Beds/Ba | Sqft | Sold | Price | $/sf | Match |
|---|---|---|---|---|---|---|---|
| 1506 Woodbine Dr | 0.38mi | 3/1.0 | 950 (+5%) | 2mo | $140,000 | $147 | 71 |
| 316 Court Dr | 0.63mi | 2/1.0 (-1) | 777 (-14%) | 6mo | $138,000 | $178 | 37 |
| 311 Court Dr | 0.60mi | 2/1.0 (-1) | 989 (+10%) | 18mo | $130,000 | $131 | 36 |
| 601 Spring St | 0.73mi | 2/1.0 (-1) | 768 (-15%) | 0mo | $177,000 | $230 | 36 |
| 400 Hamilton St | 0.67mi | 2/1.5 (-1) | 1,008 (+12%) | 14mo | $148,000 | $147 | 31 |
Match score weights: distance 35% · size 25% · config 20% · recency 20%. Top-matched comps best support the ARV.
Projected returns pro-forma
-3.0% appreciation · 3.0% rent growth · sell at horizon
- IRR
- -36.4%
- Equity multiple
- -0.17×
- Total profit
- $-65,226
- Equity at exit
- $29,806
- IRR
- -51.4%
- Equity multiple
- -0.77×
- Total profit
- $-99,235
- Equity at exit
- $17,284
Cash invested: $55,972 (down + closing). Projections, not guarantees.
Landlord ↔ Tenant lean methodology
- Overall (STATE)
- 43 Moderately Tenant-Leaning
- State Illinois
- 43 Moderately Tenant-Leaning · D+7
- County
- — inherits STATE
- City
- — inherits STATE
ZIP-level market 61571
- Active inventory
- 129
- Price-to-rent
- 17.5×
Monthly cashflow live
- Estimated rent
- $950 medium interval (Pro) →
- Mortgage (P&I)
- −$1,048
- Tax from tax record
- −$134 /mo · $1,602/yr
- Insurance
- −$83
- HOA
- −$0
- Vacancy / Maint / Mgmt
- −$200
- Net cashflow
- $-515
Break-even live
UW: 25.0% down · 7.5% · 30yr · 1.5% tax · 5.0% vac · 8.0% maint · 8.0% mgmt
Financing live
Cash to close
- Down payment
- $49,975
- Closing costs
- $5,997
- Reserves months
- —
- Total cash needed
- —
Loan-product check · same deal, 3 products live
Conventional
25% down · 7.5% · 30yr
- Down + closing
- —
- Monthly P&I
- —
- Monthly cashflow
- —
- DSCR
- —
- Eligible?
- —
Personal DTI + credit; lowest rate.
DSCR
20% down · 8.5% · 30yr
- Down + closing
- —
- Monthly P&I
- —
- Monthly cashflow
- —
- DSCR
- —
- Eligible?
- —
No personal income docs; deal must DSCR.
Hard money
10% down · 12.0% · 12mo
- Down + closing
- —
- Monthly P&I
- —
- Monthly cashflow
- —
- DSCR
- —
- Eligible?
- —
Short-term bridge; refi at stabilization.
Rent comps 1 comps
| Address | Beds | Baths | Sqft | Rent | $/sqft | DOM | Units | Dist |
|---|---|---|---|---|---|---|---|---|
| 1910 Canterbury Dr Washington, IL | 2.0 | 1.0 | 850 | $950 | $1.12 | 13d | 1 | 1.01mi |
Listing history 19 events
-
2026-06-18days on market $199,900 Active 21 DOM
-
2026-06-17days on market $199,900 Active 20 DOM
-
2026-06-16days on market $199,900 Active 19 DOM
-
2026-06-15days on market $199,900 Active 18 DOM
-
2026-06-13days on market $199,900 Active 16 DOM
-
2026-06-12days on market $199,900 Active 15 DOM
-
2026-06-09days on market $199,900 Active 12 DOM
-
2026-06-08days on market $199,900 Active 11 DOM
-
2026-06-07days on market $199,900 Active 10 DOM
-
2026-06-05days on market $199,900 Active 8 DOM
-
2026-06-04days on market $199,900 Active 6 DOM
-
2026-06-02days on market $199,900 Active 5 DOM
-
2026-06-01days on market $199,900 Active 4 DOM
-
2026-05-31days on market $199,900 Active 3 DOM
-
2026-05-31days on market $199,900 Active 2 DOM
-
2026-04-15historical $199,900
-
2017-10-11soldstatus $131,000
-
2017-09-08
-
1995-08-29soldstatus $28,000
ⓘ Source: listings_history table (triggers on properties + properties_extension) + one-shot
backfill from property_details.listing_events for pre-trigger history.
Tax reassessment forecast IL · Partial reset (capped growth)
- Current annual tax
- $1,602 · $134/mo
- Projected year-2 tax
- $3,070 · $256/mo
- Expected delta
- +$1,468/yr (+$122/mo · 91.6%)
ⓘ Screening estimate from a state-policy table — verify with the county assessor before closing.
Climate risk First Street
- Flood 1/10 Low FEMA zone X (unshaded) · 0% chance over 30 yrs
- Wildfire 1/10 Low
- Heat 3/10 Moderate 7 d/yr ≥104°F today · 18 d/yr by 30 yrs out
- Wind 2/10 Low 100% chance of damaging wind over 30 yrs
- Air quality 2/10 Low 1 unhealthy d/yr today · 1 by 30 yrs out
Nearby sold comps map
Loading sold comps map…
Walkable amenities ~0.75 mi
Loading nearby amenities…
Taxation est. · year 1
- Rental income
- $11,400
- − Mortgage interest
- −$11,198
- − Property taxes
- −$1,602
- − Insurance
- −$1,000
- − Repairs & maintenance
- −$912
- − Management
- −$912
- − Depreciation
- −$5,815
- Taxable loss
- −$10,039
- Est. tax savings @ 24.0%
- +$2,409
- After-tax cash flow
- $-3,766/yr
For passive investors: Depreciation is non-cash, so a rental often shows a tax loss while cash-flowing — sheltering income. Rental losses are passive: they offset passive income freely, and up to $25,000/yr can offset ordinary (W-2) income if you actively participate and your MAGI is under $100k (phasing out to $0 by $150k); unused losses carry forward. On sale, claimed depreciation is recaptured at up to 25%, and gains may owe capital-gains tax (a 1031 exchange can defer both). Figures are a year-1 estimate at your 24.0% rate — not tax advice; consult a CPA.
Schools (NCES district)
- District
- Washington Chsd 308
- NCES district ID
- 1740980
- Math proficiency
- 42% ▬ 0.00%
- Reading proficiency
- 42% ▼ -2.00%
- Median HH income
- $66,029
- Composite
- 37.69/100
- National rank
- #4361
- State rank
- #112 of 620 in IL
Livability — Washington
- Score
- 73/100
- State rank
- #272
- US rank
- #5136
Category grades
Schools grade is shown separately in the Schools card above.
Census & demographics
- Census place
- Washington, IL
- City population
- 24,544
- Population (ZIP)
- 24,544
Population outlook (Tazewell County) Hauer SSP2
- Today (2025)
- 131,252 people
- By 2030
- 128,028 · -2.5%
- By 2040
- 120,443 · -8.2%
- By 2050
- 111,872 · -14.8%
- By 2075
- 89,843 · -31.5%
- By 2100
- 66,468 · -49.4%
Race, ethnicity, and origin ACS 2023
- Neighborhood character
- Predominantly White (93%)
- Race & ethnicity
- White 93% Hispanic / Latino 3% Two or more races 3% Asian 1%
- Common ancestry
- Lithuanian 4% Italian 3% Iranian 2%
- Foreign-born
- 2% · Canada, China
- Languages at home
- 97% English-only · Spanish 2%
Political lean MEDSL · Tazewell
- 2024 margin
- Strong R (+26.7) · D 35.8% · R 62.5% · Other 1.8%
- 2008→2024 swing
- -20.6pp toward R · 2008: -6.0pp · 2024: -26.7pp
- All cycles
- 2024: R+26.7 2020: R+25.6 2016: R+28.5 2012: R+17.9 2008: R+6.0
Not yet ingested
- Civics
- —
Market trends
- HPI YoY
- ▼ -135.85%
- Current HPI
- 149.5627
- Rent YoY
- —
- Metro
- —
- State GDP YoY
- ▲ 1.59%
- F500 in state
- 60
Industry mix (Fortune 500 HQ in IL)
| Industry | F500 HQs | Revenue |
|---|---|---|
| Insurance | 4 | $201B |
|
||
| Consumer Goods | 4 | $87B |
|
||
| Industrial Machinery | 3 | $64B |
|
||
| Healthcare | 2 | $55B |
|
||
| Retail / Pharmacy | 1 | $148B |
|
||
| Agriculture / Food | 1 | $86B |
|
||
Price history
+613.9% since first listed4 events — show timeline
- 2026-04-15 Coming Soon $199,900 RMLSA as Distributed by MLS Grid
- 2017-10-11 Sold (Public Records) $131,000 Public Records
- 2017-09-08 Listed — RMLSA as Distributed by MLS Grid
- 1995-08-29 Sold (Public Records) $28,000 Public Records
Property tax history
-4.0%/yrLatest (2023): $1,602 · -55.0% YoY. Source: county tax records.
Cash-flow waterfall
monthlySold comps — $/sqft
last 12 mo · ≤1 miLoading sold comps…