860 W 6th St · St. Augustine, FL
Flood risk 1/10 · Minimal
- FEMA flood zone
- X (unshaded)
- Chance of flooding over 30 yrs
- 0.0%
- Est. flood insurance / yr
- $507 – $1,088
Fire risk 3/10 · Minor
- Est. fire insurance / yr
- $947 – $1,759
Heat risk 9/10 · Severe
- Hot days now (above 106°F)
- 7 days/yr
- Hot days in 30 yrs
- 20 days/yr
Wind risk 10/10 · Severe
- Chance of severe wind over 30 yrs
- 99.0%
Air-quality risk 3/10 · Minor
- Unhealthy air days now
- 3 days/yr
- Unhealthy air days in 30 yrs
- 3 days/yr
Risk factors via First Street. Map © Google.
Why this score? — see what drove the C- grade
The composite is a weighted blend of 9 inputs, each scored 0–100. Each bar is that input's sub-score; the figure is the points it added to the 100-point composite (weight × sub-score).
- Cash flow +16.8/30.0
- ARV discount +12.5/15.0
- Schools +6.4/10.0
- DSCR +5.2/10.0
- 1% rule +4.5/10.0
- Rent growth +2.6/5.0
- Livability +2.5/5.0
- Condition / age +2.5/5.0
- Appreciation +0.0/10.0
$239,000
🖨 Deal sheet (PDF) 📄 Offer letter ✓ Due diligence
Listing remarks MLS
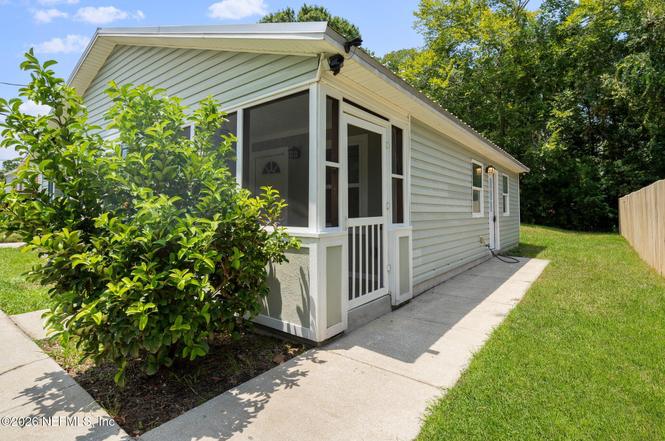
Perfect for first-time buyers or those looking to downsize, this recently updated 3-bedroom, 2-bathroom home is just 5 minutes from downtown St. Augustine. Enjoy easy access to vibrant nightlife, eclectic dining, and unique shopping. With no HOA fees, you have the freedom to make this home truly your own. Experience the best of Florida living with sunny skies, warm breezes, and endless outdoor activities. St. Augustine offers a unique blend of old-world charm and modern amenities, making it an ideal place to call home. Don't miss this opportunity—schedule a viewing today and start your new life in St. Augustine.
Key facts
- Screened front porch
- Private yard
- Updated bathrooms
Tags
Property features AI
Finance
- HOA & community: Not a senior community
Exterior
- Parking: Other parking
- Utilities: Septic tank; Cable available; Electricity connected; Water connected
- Home design: Single-family residence; Residential use
- Exterior features: No private pool; Lot of approximately 0.11 acres
Interior
- Kitchen: Electric range; Microwave; Refrigerator
- Bedrooms: 3 bedrooms
- Bathrooms: 2 full bathrooms
- Interior features: Central heating; Central air
Neighborhood map
What this means for you Summary
Snapshot
- This is a 3-bed/2.0-bath single-family listed at $239k.
Deal economics
- At list price, monthly cash flow is $154 ($2k/yr) — positive.
- The deal already cash-flows at list — no discount required.
- To meet the 1% rule (rent ≥ 1% of price), the offer needs to be $227k (5.2% below list).
- Recommended offer: $227k (5.2% below list) — sets the bar for 1% rule.
- Cap rate 7.1% vs local median 3.1% in St. Augustine — top-decile yield for the area; either an underpriced asset or a hidden risk that comps aren't pricing in. Stress-test before assuming the spread holds.
Location & tenants
- Location reads: area grade C — affects rentability + tenant quality, not the cash-flow math above.
- St. Johns (rural): math 75% / reading 73% proficiency, ranked #2 of 73 in FL (top 3%) — strong family-tenant draw, lease renewals of 3-5y typical; only 20% free/reduced lunch — higher-income household profile.
- Zoned schools: Otis A. Mason Elementary School (math 76% / reading 60%, grade B+, #425 of 2,144 statewide, top 20%, 719 students, 45% FRL); R J Murray Middle School (math 54% / reading 54%, grade B-, #196 of 571 statewide, top 36%, 695 students, 50% FRL); St. Augustine High School (math 54% / reading 62%, grade C, #120 of 667 statewide, top 18%, 1,784 students, 38% FRL) — zoned schools average 44% FRL vs 20% district-wide (24 pts higher); higher-poverty schools than district average — tighter screening recommended.
- Zoned-school proficiency averages 60% at this address vs 74% district-wide (-14 pts) — the specific schools serving this property underperform the St. Johns average; the district grade overstates school quality for this exact location.
- Market conditions: Rents flat; 636 active listings in the ZIP; 32 comparable units currently listed for rent nearby; rentals at typical pace (median 16d on market — plan ~3-4 weeks tenant-placement turnaround); 5,575 units permitted in St. Johns County in 2024 (584 in 5+ unit buildings).
- This rent runs 37% of the median local income ($74k/yr) — at the standard rent-burdened threshold; future hikes will face affordability resistance.
Forward outlook
- Local home prices are declining (-3.0%/yr); year-one equity from $2k of loan paydown is wiped out by about $7k of value loss. Plan a longer hold.
- St. Johns County population projected at +60% by 2050 — long-run rental-demand tailwind backs the buy-and-hold thesis.
Negotiation context
- Only 3 days on market — expect competitive offers; lowballing is unlikely to land.
- 4 sale attempts since 6y ago with the ask held roughly flat each time — persistent listings suggest the price (not the market) is what's stuck; bring a comps-based counter.
- Current owner paid $172k; 39% above their basis — modest negotiation headroom, anchor on the comps not their cost.
Risks & watch-outs
- Climate carrying-cost: severe wind risk, 99% chance of damaging wind over 30y; extreme-heat days projected 7→20/yr by 2055 (HVAC capex compounding) — expect insurance premiums to compound above CPI over the hold.
Questions for the listing agent
- Is there a deadline driving the sale (1031 exchange, divorce, estate, relocation)? That informs how much negotiation room exists.
- What's the average days-on-market for RENTAL listings here right now (not sales)? A rising rental-DOM trend means longer vacancies and softer asking-rent achievability than the comps imply.
- What's the recent tenant-quality profile in this submarket — average credit score on applications, eviction rate, late-payment / NSF rate, and stable-employment percentage? A property-management company in the area should have these aggregated.
- How much new for-sale + rental construction is in the pipeline within 1–3 miles? Heavy new supply typically softens prices + rents 12–24 months out; constrained supply supports both.
Investment metrics
- 1% rule
- 0.95% ✗
- Cap rate
- 7.07%
- Cash-on-cash
- 2.76%
- DSCR
- 1.12
- GRM
- 8.8
CMA / ARV
- ARV (on-the-fly)
- $268,770
- Comps found
- 12
Show comp detail 12 sales within ~0.75 mi
| Address | Dist | Beds/Ba | Sqft | Sold | Price | $/sf | Match |
|---|---|---|---|---|---|---|---|
| 650 S St Johns St | 0.09mi | 3/2.0 | 1,096 (+4%) | 0mo | $275,000 | $251 | 89 |
| 660 S St Johns St | 0.09mi | 3/2.0 | 1,096 (+4%) | 1mo | $275,000 | $251 | 88 |
| 874 Collier Blvd | 0.35mi | 3/2.0 | 1,072 (+2%) | 3mo | $300,000 | $280 | 79 |
| 995 Duval St | 0.35mi | 2/2.0 (-1) | 1,115 (+6%) | 1mo | $305,000 | $274 | 68 |
| 299 Aiken St | 0.34mi | 2/2.0 (-1) | 1,115 (+6%) | 3mo | $280,000 | $251 | 67 |
| 141 Webb St | 0.39mi | 3/2.0 | 1,190 (+13%) | 2mo | $300,000 | $252 | 59 |
| 651 Anderson St | 0.46mi | 3/1.0 | 1,152 (+9%) | 2mo | $200,000 | $174 | 57 |
| 241 Herbert St | 0.40mi | 3/2.0 | 1,200 (+14%) | 3mo | $297,000 | $248 | 56 |
| 56 S Whitney St #D | 0.68mi | 3/2.0 | 1,174 (+11%) | 2mo | $350,000 | $298 | 47 |
| 974 Alexander St | 0.49mi | 2/1.5 (-1) | 1,200 (+14%) | 1mo | $339,000 | $283 | 46 |
| 591 Julia St | 0.74mi | 3/1.0 | 916 (-13%) | 0mo | $234,000 | $255 | 40 |
| 430 S Rodriquez St | 0.56mi | 2/1.0 (-1) | 912 (-14%) | 3mo | $315,000 | $345 | 39 |
Match score weights: distance 35% · size 25% · config 20% · recency 20%. Top-matched comps best support the ARV.
Projected returns pro-forma
-3.0% appreciation · 0.25% rent growth · sell at horizon
- IRR
- -15.0%
- Equity multiple
- 0.48×
- Total profit
- $-35,009
- Equity at exit
- $35,636
- IRR
- -11.9%
- Equity multiple
- 0.38×
- Total profit
- $-41,465
- Equity at exit
- $20,664
Cash invested: $66,920 (down + closing). Projections, not guarantees.
Landlord ↔ Tenant lean methodology
- Overall (STATE)
- 87 Strongly Landlord-Friendly
- State Florida
- 87 Strongly Landlord-Friendly · R+3
- County
- — inherits STATE
- City
- — inherits STATE
ZIP-level market 32084
- Rents YoY
- 0.2%
- Active inventory
- 636
- Price-to-rent
- 8.8×
Monthly cashflow live
- Estimated rent
- $2,265 high interval (Pro) →
- Mortgage (P&I)
- −$1,253
- Tax from tax record
- −$283 /mo · $3,393/yr
- Insurance
- −$100
- HOA
- −$0
- Vacancy / Maint / Mgmt
- −$476
- Net cashflow
- $154
Break-even live
Sensitivity live
| Price | -10% $289 | -5% $221 | +0% $154 | +5% $86 | +10% $18 |
|---|---|---|---|---|---|
| Rent | -10% $-25 | -5% $64 | +0% $154 | +5% $243 | +10% $333 |
| Rate | -1.0pp $274 | -0.5pp $215 | base $154 | +0.5pp $92 | +1.0pp $29 |
UW: 25.0% down · 7.5% · 30yr · 1.5% tax · 5.0% vac · 8.0% maint · 8.0% mgmt
Financing live
Cash to close
- Down payment
- $59,750
- Closing costs
- $7,170
- Reserves months
- —
- Total cash needed
- —
Loan-product check · same deal, 3 products live
Conventional
25% down · 7.5% · 30yr
- Down + closing
- —
- Monthly P&I
- —
- Monthly cashflow
- —
- DSCR
- —
- Eligible?
- —
Personal DTI + credit; lowest rate.
DSCR
20% down · 8.5% · 30yr
- Down + closing
- —
- Monthly P&I
- —
- Monthly cashflow
- —
- DSCR
- —
- Eligible?
- —
No personal income docs; deal must DSCR.
Hard money
10% down · 12.0% · 12mo
- Down + closing
- —
- Monthly P&I
- —
- Monthly cashflow
- —
- DSCR
- —
- Eligible?
- —
Short-term bridge; refi at stabilization.
Rent comps 32 comps
| Address | Beds | Baths | Sqft | Rent | $/sqft | DOM | Units | Dist |
|---|---|---|---|---|---|---|---|---|
| 455 S Volusia St Saint Augustine, FL | 3.0 | 2.0 | 1141 | $1,950 | $1.71 | 25d | 1 | 0.15mi |
| 1040 W 7th St Saint Augustine, FL | 2.0 | 2.0 | 1108 | $2,195 | $1.98 | 3d | 1 | 0.32mi |
| 895 Collier Blvd Saint Augustine, FL | 3.0 | 2.0 | 1359 | $2,000 | $1.47 | 25d | 1 | 0.36mi |
| 535 S Woodlawn St Saint Augustine, FL | 3.0 | 2.5 | 1381 | $2,100 | $1.52 | 15d | 1 | 0.38mi |
| 942 Alexander St St. Augustine, FL | 2.0 | 1.5 | 1200 | $1,925 | $1.60 | 12d | 1 | 0.44mi |
| 1038 Collier Blvd Saint Augustine, FL | 3.0 | 3.0 | 1180 | $2,450 | $2.08 | 25d | 1 | 0.44mi |
| 550 Lena St Unit 1281938P St. Augustine, FL | 3.0 | 2.0 | 1194 | $3,236 | $2.71 | 9d | 1 | 0.64mi |
| 46 Phillips St Unit 1281939P St. Augustine, FL | 3.0 | 2.0 | 1496 | $3,986 | $2.66 | 15d | 1 | 0.71mi |
| 20 Rollins Ave Saint Augustine, FL | 3.0 | 1.0 | 828 | $1,500 | $1.81 | 25d | 1 | 0.76mi |
| 600 Francis St Saint Augustine, FL | 3.0 | 2.0 | 1280 | $2,495 | $1.95 | 5d | 1 | 0.87mi |
| 1000 Josiah St Unit 1281953P St. Augustine, FL | 3.0 | 2.0 | 1097 | $3,526 | $3.21 | 14d | 1 | 0.87mi |
| 1004 Josiah St Unit 1281918P St. Augustine, FL | 3.0 | 2.0 | 1097 | $3,893 | $3.55 | 15d | 1 | 0.87mi |
| 700 Hamilton Ave Saint Augustine, FL | 3.0 | 2.0 | 1302 | $2,035 | $1.56 | 5d | 1 | 0.88mi |
| 950 Sidney St Unit 12 St. Augustine, FL | 2.0 | 1.0 | 900 | $1,300 | $1.44 | 25d | 1 | 0.91mi |
| 1419 San Juline Cir Saint Augustine, FL | 2.0 | 1.5 | 804 | $1,649 | $2.05 | 15d | 1 | 0.95mi |
| 21 Pearl St Unit 1281964P St. Augustine, FL | 3.0 | 2.0 | 1130 | $7,100 | $6.28 | 4d | 1 | 0.95mi |
| 29 Masters Dr Unit B St. Augustine, FL | 3.0 | 2.0 | 1250 | $2,500 | $2.00 | 14d | 1 | 1.02mi |
| 100 Inspire Way St. Augustine, FL | 2.0–3.0 | 2.0 | 1393 | $2,635 | $1.89 | 25d | 120 | 1.04mi |
| 56 Masters Dr Unit D St. Augustine, FL | 2.0 | 1.5 | 900 | $1,300 | $1.44 | 25d | 1 | 1.09mi |
| 1160 N Saint Johns St Saint Augustine, FL | 3.0 | 2.0 | 1426 | $1,900 | $1.33 | 9d | 1 | 1.10mi |
| 60 Masters Dr Unit C St. Augustine, FL | 2.0 | 1.5 | 900 | $1,300 | $1.44 | 25d | 1 | 1.11mi |
| 909 S Ponce de Leon Blvd Saint Augustine, FL | 2.0 | 2.0 | 1120 | $3,150 | $2.81 | 5d | 1 | 1.16mi |
| 289 W Jayce Way Saint Augustine, FL | 3.0 | 2.0 | 1102 | $1,851 | $1.68 | 15d | 1 | 1.17mi |
| 2089 W Lymington Way Saint Augustine, FL | 3.0 | 2.0 | 1318 | $1,976 | $1.50 | 5d | 1 | 1.40mi |
| 130 Shipyard Way St. Augustine, FL | 1.0–3.0 | 1.0–2.0 | 1137 | $3,480 | $3.06 | 3d | 68 | 1.43mi |
| 105 Whitland Way Unit 1 St. Augustine, FL | 3.0 | 2.5 | 1499 | $2,300 | $1.53 | 5d | 1 | 1.43mi |
| 177 Palmer St Unit B St. Augustine, FL | 2.0 | 1.0 | 900 | $1,350 | $1.50 | 25d | 1 | 1.44mi |
| 1845 Old Moultrie Rd #32 Saint Augustine, FL | 2.0 | 1.0 | 870 | $1,650 | $1.90 | 25d | 1 | 1.44mi |
| 228 Nesmith Ave Saint Augustine, FL | 2.0 | 2.0 | 1080 | $2,500 | $2.31 | 16d | 1 | 1.45mi |
| 138 Oviedo St Unit A St. Augustine, FL | 2.0 | 1.0 | 995 | $1,695 | $1.70 | 5d | 1 | 1.46mi |
| 232 Nesmith Ave Saint Augustine, FL | 4.0 | 2.0 | 1405 | $2,795 | $1.99 | 5d | 1 | 1.47mi |
| 29 Buckley Ct Saint Augustine, FL | 2.0 | 2.5 | 1211 | $2,300 | $1.90 | 25d | 1 | 1.48mi |
Listing history 3 events
-
2026-06-13statusdays on market $239,000 Pending 3 DOM
-
2026-06-13remarks 699-char remark
-
2026-06-13$239,000 Active 2 DOM
ⓘ Source: listings_history table (triggers on properties + properties_extension) + one-shot
backfill from property_details.listing_events for pre-trigger history.
Tax reassessment forecast FL · Resets to sale price
- Current annual tax
- $3,393 · $283/mo
- Projected year-2 tax
- $3,393 · $283/mo
- Expected delta
- $0/yr ($0/mo · 0.0%)
ⓘ Screening estimate from a state-policy table — verify with the county assessor before closing.
Climate risk First Street
- Flood 1/10 Low FEMA zone X (unshaded) · 0% chance over 30 yrs
- Wildfire 3/10 Moderate
- Heat 9/10 Extreme 7 d/yr ≥106°F today · 20 d/yr by 30 yrs out
- Wind 10/10 Extreme 99% chance of damaging wind over 30 yrs
- Air quality 3/10 Moderate 3 unhealthy d/yr today · 3 by 30 yrs out
Nearby sold comps map
Loading sold comps map…
Walkable amenities ~0.75 mi
Loading nearby amenities…
Taxation est. · year 1
- Rental income
- $27,181
- − Mortgage interest
- −$13,388
- − Property taxes
- −$3,393
- − Insurance
- −$1,195
- − Repairs & maintenance
- −$2,174
- − Management
- −$2,174
- − Depreciation
- −$6,953
- Taxable loss
- −$2,096
- Est. tax savings @ 24.0%
- +$503
- After-tax cash flow
- $2,348/yr
For passive investors: Depreciation is non-cash, so a rental often shows a tax loss while cash-flowing — sheltering income. Rental losses are passive: they offset passive income freely, and up to $25,000/yr can offset ordinary (W-2) income if you actively participate and your MAGI is under $100k (phasing out to $0 by $150k); unused losses carry forward. On sale, claimed depreciation is recaptured at up to 25%, and gains may owe capital-gains tax (a 1031 exchange can defer both). Figures are a year-1 estimate at your 24.0% rate — not tax advice; consult a CPA.
Schools (NCES district)
- District
- St. Johns
- NCES district ID
- 1201740
- Math proficiency
- 75% ▼ -5.00%
- Reading proficiency
- 73% ▼ -2.00%
- Median HH income
- $66,842
- Composite
- 64.31/100
- National rank
- #556
- State rank
- #2 of 73 in FL
Livability — St. Augustine
No livability data for this city. (Only ~50 U.S. cities are tracked.)
Census & demographics
- County
- Saint Johns County · 301,599 people
- Metro
- Jacksonville, FL
- Population (ZIP)
- 37,291
- Household income
- $73,837
- Rent vs Own
- Severe rent burden
- 1748.0
Population outlook (St. Johns County) Hauer SSP2
- Today (2025)
- 303,941 people
- By 2030
- 342,590 · +12.7%
- By 2040
- 417,328 · +37.3%
- By 2050
- 487,011 · +60.2%
- By 2075
- 635,395 · +109.1%
- By 2100
- 717,469 · +136.1%
Race, ethnicity, and origin ACS 2023
- Neighborhood character
- Predominantly White (73%)
- Race & ethnicity
- White 73% Hispanic / Latino 12% Black 11% Two or more races 8%
- Hispanic origin (detail)
- Mexican 2% Puerto Rican 4% Cuban 1%
- Common ancestry
- Lithuanian 3% Romanian 2% Slovak 2%
- Foreign-born
- 6% · Canada, Jamaica
- Languages at home
- 91% English-only · Spanish 6% Other Indo-European 1%
Political lean MEDSL · St. Johns
- 2024 margin
- Solid R (+31.4) · D 33.9% · R 65.2%
- 2008→2024 swing
- +0.2pp no change · 2008: -31.6pp · 2024: -31.4pp
- All cycles
- 2024: R+31.4 2020: R+26.7 2016: R+33.4 2012: R+37.8 2008: R+31.6
Not yet ingested
- Civics
- —
Market trends
- HPI YoY
- ▼ -287.02%
- Current HPI
- 330.9505
- Rent YoY
- ▲ 0.25%
- Metro
- Jacksonville, FL
- State GDP YoY
- ▲ 3.28%
- F500 in state
- 36
Industry mix (Fortune 500 HQ in FL)
| Industry | F500 HQs | Revenue |
|---|---|---|
| Industrial Technology | 2 | $29B |
|
||
| Insurance | 2 | $17B |
|
||
| Retail | 1 | $60B |
|
||
| Technology Distribution | 1 | $58B |
|
||
| Homebuilding | 1 | $35B |
|
||
| Technology Manufacturing | 1 | $35B |
|
||
Price history
+646.9% since first listed14 events — show timeline
- 2026-06-10 Listed $239,000 realMLS
- 2024-10-17 Rental Removed $2,000 NEFLMLS
- 2024-10-17 Listing Removed — realMLS
- 2024-10-03 Listed for Rent $2,000 NEFLMLS
- 2024-09-05 Price Changed $249,000 realMLS
- 2024-08-29 Price Changed $258,900 realMLS
- 2024-08-19 Price Changed $264,999 realMLS
- 2024-08-02 Listed $269,900 realMLS
- 2020-12-29 Sold (Public Records) $171,500 Public Records
- 2020-12-28 Sold (MLS) $171,500 St. Augustine and St. Johns County Board of REALTORS®
- 2020-08-06 Contingent — St. Augustine and St. Johns County Board of REALTORS®
- 2020-07-03 Listed $165,900 St. Augustine and St. Johns County Board of REALTORS®
- 2019-09-20 Sold (Public Records) $88,200 Public Records
- 2006-10-06 Sold (Public Records) $32,000 Public Records
Property tax history
+16.7%/yrLatest (2025): $3,393 · +106.2% YoY. Source: county tax records.
Cash-flow waterfall
monthlySold comps — $/sqft
last 12 mo · ≤1 miLoading sold comps…