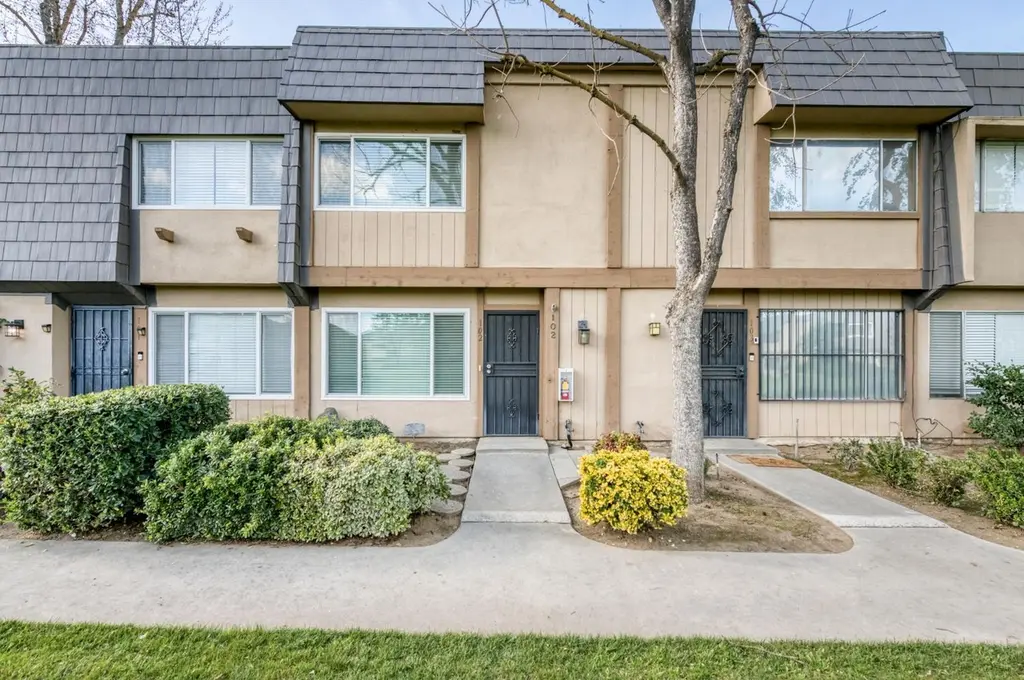
5118 E Ashlan Ave #102 · Fresno, CA
Flood risk No data
- FEMA flood zone
- —
- Chance of flooding over 30 yrs
- —
- Est. flood insurance / yr
- —
Fire risk No data
- Est. fire insurance / yr
- —
Heat risk No data
- Hot days now (above threshold)
- —
- Hot days in 30 yrs
- —
Wind risk No data
- Chance of severe wind over 30 yrs
- —
Air-quality risk No data
- Unhealthy air days now
- —
- Unhealthy air days in 30 yrs
- —
Risk factors via First Street. Map © Google.
Why this score? — see what drove the D grade
The composite is a weighted blend of 9 inputs, each scored 0–100. Each bar is that input's sub-score; the figure is the points it added to the 100-point composite (weight × sub-score).
- ARV discount +12.4/15.0
- Cash flow +9.1/30.0
- 1% rule +5.3/10.0
- Condition / age +4.0/5.0
- Rent growth +3.2/5.0
- Livability +3.1/5.0
- Schools +2.7/10.0
- DSCR +2.5/10.0
- Appreciation +0.0/10.0
$197,500
🖨 Deal sheet 📄 Offer letter ✓ Due diligence
Listing remarks
Beautiful and highly desirable Palm Lakes 2 story PUD with 3 bedroom and 2 bath. Recently remodeled with new interior paint, new carpet, new bottom kitchen cabinet, new kitchen counter tops, new appliances and much more. Go and Sell!!
Key facts
- 2 story pud
- Recently remodeled
- New carpet
Tags
Property features AI
Finance
- HOA & community: Homeowners association with community pool; Association fee approximately $400 monthly
Exterior
- Utilities: Electric service on; Public sewer; Public utilities
- Home design: Single family residence
- Construction: Stucco and wood siding exterior; Composition roof; Concrete foundation
- Exterior features: Two levels; Urban lot; Private in-ground pool (community); Lot dimensions approximately 16 x 45
Interior
- Kitchen: Range/oven (full-size); Dishwasher; Microwave
- Bathrooms: 2 bathrooms
- Heating & cooling: Central heat and central cool
- Interior features: Tub/shower and separate shower in bathrooms; Furnace and central air conditioning
- Laundry & utility: Laundry located inside
Neighborhood map
What this means for you Summary
Snapshot
- This is a 3-bed/2.0-bath single-family listed at $198k. Condition is rated good.
Deal economics
- At list price, monthly cash flow is $-153 ($-2k/yr) — negative.
- To cash-flow at today's rent, offer at most $175k (11.2% below list).
- Meets the 1% rule at list price ($2k rent vs $198k).
- Recommended offer: $175k (11.2% below list) — sets the bar for cash-flow.
- Cap rate 5.4% vs local median 3.7% in Fresno — top-decile yield for the area; either an underpriced asset or a hidden risk that comps aren't pricing in. Stress-test before assuming the spread holds.
Location & tenants
- Location reads 62/100 on livability (#469 in CA) — a middle-class / working-renter tenant base. Strengths: commute A+, housing A+; Watch: amenities D+, employment D+, crime F.
- Fresno Unified (urban): math 18% / reading 47% proficiency, ranked #327 of 517 in CA (top 63%) — families likely to look elsewhere, expect single-tenant / working-renter base with shorter leases; 77% free/reduced lunch — lower-income household profile, screen leases tightly.
- Zoned schools: Viking Elementary (712 students, 91% FRL); Ahwahnee Middle (639 students, 86% FRL); Herbert Hoover High (math 14% / reading 39%, grade F, #804 of 1,170 statewide, top 69%, 2,005 students, 81% FRL).
- Market conditions: Rents rising (+3.0%/yr); 327 active listings in the ZIP; 24 comparable units currently listed for rent nearby; rentals at typical pace (median 24d on market — plan ~3-4 weeks tenant-placement turnaround); solid renter incomes; 2,426 units permitted in Fresno County in 2024 (296 in 5+ unit buildings).
Forward outlook
- Local home prices are declining (-3.0%/yr); year-one equity from $1k of loan paydown is wiped out by about $6k of value loss. Plan a longer hold.
- Fresno County population projected at +11% by 2050 — modest demand growth; plan on rents tracking national, not racing it.
Negotiation context
- Only 1 days on market — expect competitive offers; lowballing is unlikely to land.
- 3 sale attempts with the ask held roughly flat each time — persistent listings suggest the price (not the market) is what's stuck; bring a comps-based counter.
Questions for the listing agent
- What do current leases actually rent for vs. the listed asking? Can we see a recent rent roll and the last 12 months of T-12 income?
- Built in 1973 — when were the roof, HVAC, electrical panel, plumbing, and water heater last replaced?
- What does the HOA fee cover, when was the last increase, and are there any pending special assessments or reserve-fund shortfalls?
- Is there a deadline driving the sale (1031 exchange, divorce, estate, relocation)? That informs how much negotiation room exists.
- Schools are D-rated, which usually means shorter tenancies and higher turnover. Who's the typical renter profile here, and what's been the actual vacancy rate?
- Crime grade is F in this area — have there been break-ins, vandalism, or insurance claims at this property in the last 3 years? What carrier currently insures it and at what premium?
- The area grade is low — what's the realistic commute time and amenity access for the typical tenant pool here? Any planned neighborhood developments (good or bad) we should know about?
- What's the average days-on-market for RENTAL listings here right now (not sales)? A rising rental-DOM trend means longer vacancies and softer asking-rent achievability than the comps imply.
- What's the recent tenant-quality profile in this submarket — average credit score on applications, eviction rate, late-payment / NSF rate, and stable-employment percentage? A property-management company in the area should have these aggregated.
- How much new for-sale + rental construction is in the pipeline within 1–3 miles? Heavy new supply typically softens prices + rents 12–24 months out; constrained supply supports both.
Investment metrics
- 1% rule
- 1.03% ✓
- Cap rate
- 5.36%
- Cash-on-cash
- -3.33%
- DSCR
- 0.85
- GRM
- 8.1
CMA / ARV
- ARV (median comp)
- $221,576
- List price
- $197,500
- Delta
- -10.41%
- Verdict
- UNDERPRICED
- Comps
- 20 within 1.0 mi
Show comp detail 10 sales within ~0.75 mi
| Address | Dist | Beds/Ba | Sqft | Sold | Price | $/sf | Match |
|---|---|---|---|---|---|---|---|
| 5118 E Ashlan Ave #112 | 0.00mi | 2/1.5 (-1) | 977 (0%) | 17mo | $206,000 | $211 | 78 |
| 5138 E Ashlan Ave #102 | 0.05mi | 2/1.5 (-1) | 977 (0%) | 22mo | $198,000 | $203 | 72 |
| 741 W Holland | 0.40mi | 3/1.8 | 1,100 (+13%) | 2mo | $350,000 | $318 | 58 |
| 896 W Holland Ave | 0.52mi | 3/1.8 | 1,100 (+13%) | 0mo | $375,000 | $341 | 54 |
| 916 W Holland Ave | 0.54mi | 3/1.8 | 1,100 (+13%) | 0mo | $365,000 | $332 | 53 |
| 621 W Pat Dr W | 0.63mi | 3/1.8 | 1,100 (+13%) | 0mo | $325,000 | $295 | 48 |
| 2923 Fine Ave | 0.60mi | 3/2.0 | 1,100 (+13%) | 4mo | $345,000 | $314 | 48 |
| 414 W Rialto Ave | 0.72mi | 3/1.8 | 1,100 (+13%) | 0mo | $345,000 | $314 | 44 |
| 650 W Norwich Ave | 0.51mi | 3/1.8 | 1,100 (+13%) | 16mo | $373,500 | $340 | 42 |
| 905 W National Ave | 0.52mi | 3/2.0 | 1,100 (+13%) | 22mo | $370,000 | $336 | 36 |
Match score weights: distance 35% · size 25% · config 20% · recency 20%. Top-matched comps best support the ARV.
Projected returns pro-forma
-3.0% appreciation · 2.95% rent growth · sell at horizon
- IRR
- -21.7%
- Equity multiple
- 0.25×
- Total profit
- $-41,592
- Equity at exit
- $29,448
- IRR
- -15.3%
- Equity multiple
- 0.13×
- Total profit
- $-48,085
- Equity at exit
- $17,076
Cash invested: $55,300 (down + closing). Projections, not guarantees.
Landlord ↔ Tenant lean methodology
- Overall (STATE)
- 18 Strongly Tenant-Friendly
- State California
- 18 Strongly Tenant-Friendly · D+13
- County
- — inherits STATE
- City
- — inherits STATE
ZIP-level market 93727
- Rents YoY
- 3.0%
- Active inventory
- 327
- Price-to-rent
- 8.1×
Monthly cashflow live
- Estimated rent
- $2,040 high interval (Pro) →
- Mortgage (P&I)
- −$1,036
- Tax est. 1.5%
- −$247 /mo · $2,962/yr
- Insurance
- −$82
- HOA
- −$400
- Vacancy / Maint / Mgmt
- −$428
- Net cashflow
- $-153
Break-even live
UW: 25.0% down · 7.5% · 30yr · 1.5% tax · 5.0% vac · 8.0% maint · 8.0% mgmt
Financing live
Cash to close
- Down payment
- $49,375
- Closing costs
- $5,925
- Reserves months
- —
- Total cash needed
- —
Loan-product check · same deal, 3 products live
Conventional
25% down · 7.5% · 30yr
- Down + closing
- —
- Monthly P&I
- —
- Monthly cashflow
- —
- DSCR
- —
- Eligible?
- —
Personal DTI + credit; lowest rate.
DSCR
20% down · 8.5% · 30yr
- Down + closing
- —
- Monthly P&I
- —
- Monthly cashflow
- —
- DSCR
- —
- Eligible?
- —
No personal income docs; deal must DSCR.
Hard money
10% down · 12.0% · 12mo
- Down + closing
- —
- Monthly P&I
- —
- Monthly cashflow
- —
- DSCR
- —
- Eligible?
- —
Short-term bridge; refi at stabilization.
Rent comps 24 comps
| Address | Beds | Baths | Sqft | Rent | $/sqft | DOM | Units | Dist |
|---|---|---|---|---|---|---|---|---|
| 5138 E Ashlan Ave Fresno, CA | 2.0 | 1.5 | 977 | $2,469 | $2.53 | 43d | 1 | 0.07mi |
| 551 W Ashlan Ave Unit 101 858 Clovis, CA | 2.0 | 2.0 | 1000 | $1,450 | $1.45 | 43d | 1 | 0.10mi |
| 2967 Terry Ave Clovis, CA | 3.0 | 1.5 | 1099 | $2,095 | $1.91 | 23d | 1 | 0.42mi |
| 400 W Gettysburg Ave Unit 243A Clovis, CA | 2.0 | 1.0 | 904 | $1,500 | $1.66 | 2d | 1 | 0.56mi |
| 400 W Gettysburg Ave Unit 116B Clovis, CA | 2.0 | 2.0 | 994 | $1,795 | $1.81 | 43d | 1 | 0.56mi |
| 400 W Gettysburg Ave Unit 206B Clovis, CA | 2.0 | 1.0 | 904 | $1,500 | $1.66 | 23d | 1 | 0.56mi |
| 400 W Gettysburg Ave Apt 223A Clovis, CA | 2.0 | 2.0 | 994 | $1,700 | $1.71 | 43d | 1 | 0.56mi |
| 400 W Gettysburg Ave Apt 204A Clovis, CA | 2.0 | 1.0 | 904 | $1,600 | $1.77 | 43d | 1 | 0.56mi |
| 400 W Gettysburg Ave Unit 215B Clovis, CA | 2.0 | 2.0 | 994 | $1,780 | $1.79 | 43d | 1 | 0.56mi |
| 400 W Gettysburg Ave Apt 208A Clovis, CA | 2.0 | 1.0 | 904 | $1,500 | $1.66 | 43d | 1 | 0.56mi |
| 400 W Gettysburg Ave Unit 143A Clovis, CA | 2.0 | 1.0 | 904 | $1,650 | $1.83 | 21d | 1 | 0.56mi |
| 400 W Gettysburg Ave Unit 101A Clovis, CA | 2.0 | 1.0 | 904 | $1,580 | $1.75 | 23d | 1 | 0.56mi |
| 2800 Willow Ave Clovis, CA | 1.0–2.0 | 1.0–2.0 | 774 | $1,633 | $2.11 | 1d | 7 | 0.65mi |
| 2777 Willow Ave Clovis, CA | 1.0–2.0 | 1.0 | 812 | $1,769 | $2.18 | 1d | 8 | 0.68mi |
| 2810 Willow Ave Clovis, CA | 2.0 | 2.0 | 928 | $1,623 | $1.75 | 23d | 1 | 0.71mi |
| 2810 Willow Ave Clovis, CA | 2.0 | 2.0 | 890 | $1,572 | $1.77 | 10d | 1 | 0.71mi |
| 835 W Pico Ave Clovis, CA | 1.0–2.0 | 1.0 | 761 | $1,595 | $2.10 | 2d | 3 | 0.76mi |
| 2243 Helm Ave Unit 102 Clovis, CA | 2.0 | 2.0 | 1100 | $1,925 | $1.75 | 21d | 1 | 0.89mi |
| 189 W Santa Ana Ave Apt F Clovis, CA | 2.0 | 1.0 | 800 | $1,450 | $1.81 | 2d | 1 | 0.96mi |
| 33 W Santa Ana Ave Apt A Clovis, CA | 2.0 | 1.5 | 900 | $1,450 | $1.61 | 2d | 1 | 1.07mi |
| 4885 N Chestnut Ave Fresno, CA | 2.0 | 1.5 | 1125 | $1,565 | $1.39 | 43d | 1 | 1.27mi |
| 3143 Matoian Way Fresno, CA | 1.0–2.0 | 1.0–2.0 | 971 | $1,960 | $2.02 | 43d | 1 | 1.34mi |
| 5082 Primitivo Way Fresno, CA | 1.0–2.0 | 1.0 | 847 | $1,945 | $2.30 | 11d | 2 | 1.37mi |
| 4745 E Cornell Ave Fresno, CA | 2.0 | 1.0 | 1000 | $1,695 | $1.70 | 23d | 1 | 1.39mi |
HOA detail
- Monthly dues
- $400 · $4,800/yr
Listing history 23 events
-
2026-06-19pricedays on market $197,500 Active 1 DOM
-
2026-06-18days on market $198,500 Active 70 DOM
-
2026-06-17days on market $198,500 Active 69 DOM
-
2026-06-16days on market $198,500 Active 68 DOM
-
2026-06-15days on market $198,500 Active 67 DOM
-
2026-06-13pricedays on market $198,500 Active 65 DOM
-
2026-06-10days on market $199,500 Active 62 DOM
-
2026-06-09days on market $199,500 Active 61 DOM
-
2026-06-08days on market $199,500 Active 60 DOM
-
2026-06-07days on market $199,500 Active 59 DOM
-
2026-06-05days on market $199,500 Active 56 DOM
-
2026-06-03days on market $199,500 Active 55 DOM
-
2026-06-02days on market $199,500 Active 54 DOM
-
2026-06-01days on market $199,500 Active 53 DOM
-
2026-05-31days on market $199,500 Active 52 DOM
-
2026-05-15price $199,500 234-char remark
-
2026-05-13price $208,000 234-char remark
-
2026-04-24price $209,000 234-char remark
-
2026-04-09$214,500 Active 234-char remark
-
2026-03-29price $219,500
-
2026-03-26price $224,900
-
2026-03-12price $227,900
-
2026-02-26$229,000 Active
ⓘ Source: listings_history table (triggers on properties + properties_extension) + one-shot
backfill from property_details.listing_events for pre-trigger history.
Nearby sold comps map
Loading sold comps map…
Walkable amenities ~0.75 mi
Loading nearby amenities…
Taxation est. · year 1
- Rental income
- $24,480
- − Mortgage interest
- −$11,063
- − Property taxes
- −$2,962
- − Insurance
- −$988
- − Repairs & maintenance
- −$1,958
- − Management
- −$1,958
- − HOA
- −$4,800
- − Depreciation
- −$5,745
- Taxable loss
- −$4,995
- Est. tax savings @ 24.0%
- +$1,199
- After-tax cash flow
- $-640/yr
For passive investors: Depreciation is non-cash, so a rental often shows a tax loss while cash-flowing — sheltering income. Rental losses are passive: they offset passive income freely, and up to $25,000/yr can offset ordinary (W-2) income if you actively participate and your MAGI is under $100k (phasing out to $0 by $150k); unused losses carry forward. On sale, claimed depreciation is recaptured at up to 25%, and gains may owe capital-gains tax (a 1031 exchange can defer both). Figures are a year-1 estimate at your 24.0% rate — not tax advice; consult a CPA.
Condition & rehab AI · 12 photos
This well-maintained, recently remodeled townhome is move-in ready with a good condition score and potential for further value enhancement.
Value-add opportunities
- Both Paint exterior siding — Enhances curb appeal and value
- Both Replace carpet with hardwood flooring — Improves aesthetics and increases value
- Both Install smart home devices — Enhances convenience and adds modern appeal
Renovation cost estimate screening
Value-add ROI direction
- Both Paint exterior siding — Enhances curb appeal and value ↑
- Both Replace carpet with hardwood flooring — Improves aesthetics and increases value ↑
- Both Install smart home devices — Enhances convenience and adds modern appeal ↑
ⓘ Cost ranges are severity-bucket heuristics (US national rule-of-thumb). Get contractor quotes + a written scope before underwriting a rehab budget.
Schools (NCES district)
- District
- Fresno Unified
- NCES district ID
- 0614550
- Math proficiency
- 18% ▼ -12.00%
- Reading proficiency
- 47% ▲ 9.00%
- Median HH income
- $36,095
- Composite
- 26.83/100
- National rank
- #7111
- State rank
- #327 of 517 in CA
Livability — Fresno
- Score
- 62/100
- State rank
- #469
- US rank
- #15907
Category grades
Schools grade is shown separately in the Schools card above.
Census & demographics
- Census place
- Fresno, CA
- County
- Fresno County · 834,801 people
- City population
- 593,114
- Metro
- Fresno, CA
- Population (ZIP)
- 84,107
- Household income
- $87,466
- Rent vs Own
- Severe rent burden
- 2745.0
Population outlook (Fresno County) Hauer SSP2
- Today (2025)
- 1,042,971 people
- By 2030
- 1,072,198 · +2.8%
- By 2040
- 1,122,408 · +7.6%
- By 2050
- 1,157,251 · +11.0%
- By 2075
- 1,182,575 · +13.4%
- By 2100
- 1,105,899 · +6.0%
Race, ethnicity, and origin ACS 2023
- Neighborhood character
- Diverse neighborhood (Simpson 0.68)
- Race & ethnicity
- Hispanic / Latino 46% Asian 27% Two or more races 22% White 18% Black 5% Native American 2%
- Hispanic origin (detail)
- Mexican 42%
- Common ancestry
- Russian 1% Slovak 1% Portuguese 1%
- Foreign-born
- 22% · Canada, China, Vietnam
- Languages at home
- 54% English-only · Spanish 25% Other Asian/Pacific 13% Other Indo-European 6%
Political lean MEDSL · Fresno
- 2024 margin
- Toss-up / Even · D 46.5% · R 50.9% · Other 2.6%
- 2008→2024 swing
- -6.5pp toward R · 2008: 2.1pp · 2024: -4.4pp
- All cycles
- 2024: R+4.4 2020: D+7.8 2016: D+3.9 2012: R+2.9 2008: D+2.1
Not yet ingested
- Civics
- —
Market trends
- HPI YoY
- ▼ -317.54%
- Current HPI
- 379.1959
- Rent YoY
- ▲ 2.95%
- Metro
- Fresno, CA
- State GDP YoY
- ▲ 3.21%
- F500 in state
- 116
Industry mix (Fortune 500 HQ in CA)
| Industry | F500 HQs | Revenue |
|---|---|---|
| Technology | 27 | $1,492B |
|
||
| Financial Services | 3 | $174B |
|
||
| Retail | 3 | $44B |
|
||
| Insurance | 3 | $26B |
|
||
| Media / Entertainment | 2 | $115B |
|
||
| Pharmaceuticals / Biotech | 2 | $62B |
|
||
Price history
-13.8% since first listed10 events — show timeline
- 2026-06-18 Listed $197,500 FRESNOMLS
- 2026-06-11 Price Changed $198,500 FRESNOMLS
- 2026-05-15 Price Changed $199,500 FRESNOMLS
- 2026-05-13 Price Changed $208,000 FRESNOMLS
- 2026-04-24 Price Changed $209,000 FRESNOMLS
- 2026-04-09 Listed $214,500 FRESNOMLS
- 2026-03-29 Price Changed $219,500 FRESNOMLS
- 2026-03-26 Price Changed $224,900 FRESNOMLS
- 2026-03-12 Price Changed $227,900 FRESNOMLS
- 2026-02-26 Listed $229,000 FRESNOMLS
Cash-flow waterfall
monthlySold comps — $/sqft
last 12 mo · ≤1 miLoading sold comps…