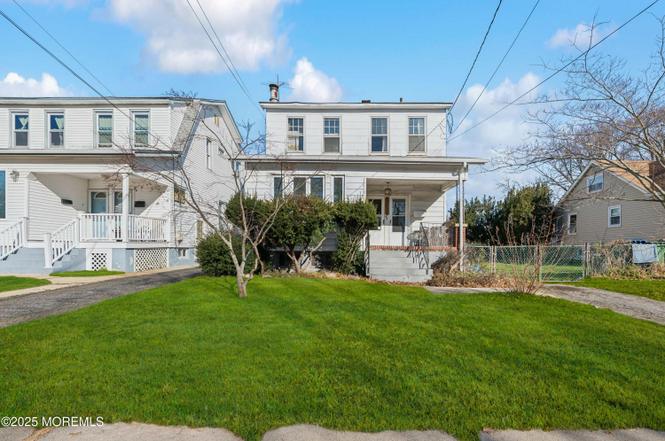
1417 7th Ave · Neptune City, NJ
Flood risk 1/10 · Minimal
- FEMA flood zone
- X (unshaded)
- Chance of flooding over 30 yrs
- 0.0%
- Est. flood insurance / yr
- $473 – $860
Fire risk 1/10 · Minimal
- Est. fire insurance / yr
- $526 – $976
Heat risk 8/10 · Major
- Hot days now (above 95°F)
- 7 days/yr
- Hot days in 30 yrs
- 15 days/yr
Wind risk 8/10 · Major
- Chance of severe wind over 30 yrs
- 80.0%
Air-quality risk 3/10 · Minor
- Unhealthy air days now
- 2 days/yr
- Unhealthy air days in 30 yrs
- 3 days/yr
Risk factors via First Street. Map © Google.
Why this score? — see what drove the C- grade
The composite is a weighted blend of 9 inputs, each scored 0–100. Each bar is that input's sub-score; the figure is the points it added to the 100-point composite (weight × sub-score).
- Cash flow +21.3/30.0
- ARV discount +7.5/15.0
- DSCR +6.8/10.0
- 1% rule +6.0/10.0
- Rent growth +3.6/5.0
- Livability +3.4/5.0
- Condition / age +2.5/5.0
- Schools +2.1/10.0
- Appreciation +0.0/10.0
$535,000
🖨 Deal sheet 📄 Offer letter ✓ Due diligence
Listing remarks
Welcome to this charming 6Bed/2Bath duplex, where potential and personality collide! This is your golden ticket to turning dreams into dollars-an income-generating gem just waiting for your magic touch. Boasting 3 spacious bedrooms +a full bath in EACH unit, you can easily accommodate your future tenants (or, you know, the in-laws on a short stay. .. no pressure!). The first level is already sporting a newer roof, and even though the interior needs a little TLC, think of the fun you'll have restoring those classic features like the stunning 9-foot ceilings and original hardwood floors! And don't forget about the wood-stove with a brick hearth-it's not functional right now, but with a little
Key facts
- Newer roof
- 9 foot ceilings
- Huge fenced yard
Tags
Neighborhood map
What this means for you Summary
Snapshot
- This is a 6-bed/2.0-bath single-family listed at $535k.
Deal economics
- At list price, monthly cash flow is $787 ($9k/yr) — positive.
- The deal already cash-flows at list — no discount required.
- Meets the 1% rule at list price ($6k rent vs $535k).
- Cap rate 8.1% vs local median 1.4% in Neptune City — top-decile yield for the area; either an underpriced asset or a hidden risk that comps aren't pricing in. Stress-test before assuming the spread holds.
Location & tenants
- Location reads 67/100 on livability (#332 in NJ) — a middle-class / working-renter tenant base. Strengths: housing A+, employment A-, health & safety A-; Watch: schools D+, amenities D, commute F.
- Neptune Township School District (suburban): math 12% / reading 33% proficiency, ranked #404 of 472 in NJ (top 86%) — low school quality limits family demand, transient renter base, plan for 1-2y turnover.
- Market conditions: Rents rising fast (+4.6%/yr); 267 active listings in the ZIP; 24 comparable units currently listed for rent nearby; rentals at typical pace (median 19d on market — plan ~3-4 weeks tenant-placement turnaround); solid renter incomes; 2,840 units permitted in Monmouth County in 2024 (484 in 5+ unit buildings).
- At $5,866/mo this rent would consume 74% of the median local household income ($96k/yr) (locally 1263% of renters already pay >50% of income on rent) — very limited rent-growth headroom before tenants either downsize or default.
Forward outlook
- Local home prices are declining (-3.0%/yr); year-one equity from $4k of loan paydown is wiped out by about $16k of value loss. Plan a longer hold.
- Monmouth County population projected at -11% by 2050 — secular population decline; favor cash flow + early exit over multi-decade hold.
Negotiation context
- Only 11 days on market — expect competitive offers; lowballing is unlikely to land.
- Current owner paid $425k; 26% above their basis — modest negotiation headroom, anchor on the comps not their cost.
Risks & watch-outs
- Watch-outs: built in 1942 — expect roof / HVAC / electrical / plumbing capex.
- Climate carrying-cost: severe wind risk, 80% chance of damaging wind over 30y; extreme-heat days projected 7→15/yr by 2055 (HVAC capex compounding) — expect insurance premiums to compound above CPI over the hold.
Questions for the listing agent
- Built in 1942 — when were the roof, HVAC, electrical panel, plumbing, and water heater last replaced?
- Is there a deadline driving the sale (1031 exchange, divorce, estate, relocation)? That informs how much negotiation room exists.
- Schools are D-rated, which usually means shorter tenancies and higher turnover. Who's the typical renter profile here, and what's been the actual vacancy rate?
- What's the average days-on-market for RENTAL listings here right now (not sales)? A rising rental-DOM trend means longer vacancies and softer asking-rent achievability than the comps imply.
- What's the recent tenant-quality profile in this submarket — average credit score on applications, eviction rate, late-payment / NSF rate, and stable-employment percentage? A property-management company in the area should have these aggregated.
- How much new for-sale + rental construction is in the pipeline within 1–3 miles? Heavy new supply typically softens prices + rents 12–24 months out; constrained supply supports both.
Investment metrics
- 1% rule
- 1.10% ✓
- Cap rate
- 8.06%
- Cash-on-cash
- 6.31%
- DSCR
- 1.28
- GRM
- 7.6
CMA / ARV
- ARV (on-the-fly)
- $1,165,800
- Comps found
- 1
Show comp detail 1 sale within ~0.75 mi
| Address | Dist | Beds/Ba | Sqft | Sold | Price | $/sf | Match |
|---|---|---|---|---|---|---|---|
| 606 Mccabe Ave | 0.63mi | 5/4.5 (-1) | 2,085 (+4%) | 14mo | $1,210,000 | $580 | 37 |
Match score weights: distance 35% · size 25% · config 20% · recency 20%. Top-matched comps best support the ARV.
Projected returns pro-forma
-3.0% appreciation · 4.58% rent growth · sell at horizon
- IRR
- -4.7%
- Equity multiple
- 0.82×
- Total profit
- $-26,908
- Equity at exit
- $79,770
- IRR
- 6.8%
- Equity multiple
- 1.55×
- Total profit
- $81,997
- Equity at exit
- $46,257
Cash invested: $149,800 (down + closing). Projections, not guarantees.
Landlord ↔ Tenant lean methodology
- Overall (STATE)
- 21 Tenant-Leaning
- State New Jersey
- 21 Tenant-Leaning · D+6
- County
- — inherits STATE
- City
- — inherits STATE
ZIP-level market 07753
- Rents YoY
- 4.6%
- Active inventory
- 267
- Price-to-rent
- 7.6×
Monthly cashflow live
- Estimated rent
- $5,866 high interval (Pro) →
- Mortgage (P&I)
- −$2,806
- Tax from tax record
- −$818 /mo · $9,820/yr
- Insurance
- −$223
- HOA
- −$0
- Vacancy / Maint / Mgmt
- −$1,232
- Net cashflow
- $787
Break-even live
UW: 25.0% down · 7.5% · 30yr · 1.5% tax · 5.0% vac · 8.0% maint · 8.0% mgmt
Financing live
Cash to close
- Down payment
- $133,750
- Closing costs
- $16,050
- Reserves months
- —
- Total cash needed
- —
Loan-product check · same deal, 3 products live
Conventional
25% down · 7.5% · 30yr
- Down + closing
- —
- Monthly P&I
- —
- Monthly cashflow
- —
- DSCR
- —
- Eligible?
- —
Personal DTI + credit; lowest rate.
DSCR
20% down · 8.5% · 30yr
- Down + closing
- —
- Monthly P&I
- —
- Monthly cashflow
- —
- DSCR
- —
- Eligible?
- —
No personal income docs; deal must DSCR.
Hard money
10% down · 12.0% · 12mo
- Down + closing
- —
- Monthly P&I
- —
- Monthly cashflow
- —
- DSCR
- —
- Eligible?
- —
Short-term bridge; refi at stabilization.
Rent comps 24 comps
| Address | Beds | Baths | Sqft | Rent | $/sqft | DOM | Units | Dist |
|---|---|---|---|---|---|---|---|---|
| 513 Ocean Park Ave Bradley Beach, NJ | 5.0 | 4.0 | 2944 | $6,000 | $2.04 | 1d | 1 | 0.69mi |
| 316 Park Place Ave Bradley Beach, NJ | 5.0 | 3.0 | 1797 | $5,500 | $3.06 | 1d | 1 | 0.88mi |
| 148 Heck Ave Ocean Grove, NJ | 5.0 | 3.5 | 1946 | $2,500 | $1.28 | 43d | 1 | 0.90mi |
| 96 Cookman Ave Ocean Grove, NJ | 5.0 | 3.0 | 1982 | $3,500 | $1.77 | 43d | 1 | 0.93mi |
| 214 Brinley Ave Bradley Beach, NJ | 5.0 | 3.5 | 1752 | $5,500 | $3.14 | 1d | 1 | 0.97mi |
| 69 Franklin Ave Unit 1 Ocean Grove, NJ | 5.0 | 2.0 | 2096 | $4,700 | $2.24 | 43d | 1 | 0.99mi |
| 333 Woodland Ave Avon by the Sea, NJ | 5.0 | 2.5 | 2531 | $9,000 | $3.56 | 1d | 1 | 1.04mi |
| 204 4th Ave Bradley Beach, NJ | 7.0 | 2.0 | 2224 | $4,200 | $1.89 | 24d | 1 | 1.04mi |
| 1219 Washington Ave Asbury Park, NJ | 6.0 | 2.0 | 1510 | $3,700 | $2.45 | 4d | 1 | 1.06mi |
| 75 Webb Ave Unit FULL Ocean Grove, NJ | 5.0 | 3.0 | 2084 | $5,350 | $2.57 | 43d | 1 | 1.06mi |
| 110 Mount Tabor Way Unit C Ocean Grove, NJ | 5.0 | 2.0 | 2690 | $3,000 | $1.12 | 24d | 1 | 1.07mi |
| 62 Webb Ave Ocean Grove, NJ | 5.0 | 2.5 | 2107 | $25,000 | $11.87 | 1d | 1 | 1.09mi |
| 512 Lincoln Ave Avon by the Sea, NJ | 5.0 | 3.5 | 2958 | $10,000 | $3.38 | 44d | 1 | 1.10mi |
| 83 Main Ave Ocean Grove, NJ | 5.0 | 2.5 | 1981 | $3,400 | $1.72 | 43d | 1 | 1.11mi |
| 311 Garfield Ave Avon by the Sea, NJ | 5.0 | 2.0 | 1508 | $21,000 | $13.93 | 43d | 1 | 1.19mi |
| 16 Abbott Ave Ocean Grove, NJ | 5.0 | 3.5 | 2817 | $5,600 | $1.99 | 1d | 1 | 1.21mi |
| 26 Heck Ave Ocean Grove, NJ | 5.0 | 2.5 | 1856 | $5,900 | $3.18 | 1d | 1 | 1.23mi |
| 44 Ocean Pathway Ocean Grove, NJ | 6.0 | 3.5 | 2425 | $7,000 | $2.89 | 4d | 1 | 1.29mi |
| 15 Pitman Ave Ocean Grove, NJ | 5.0 | 3.0 | 2184 | $7,500 | $3.43 | 43d | 1 | 1.34mi |
| 11 Pitman Ave Ocean Grove, NJ | 7.0 | 4.5 | 2974 | $9,700 | $3.26 | 19d | 1 | 1.35mi |
| 9 Pitman Ave Ocean Grove, NJ | 6.0 | 3.5 | 2221 | $7,500 | $3.38 | 17d | 1 | 1.36mi |
| 12 Surf Ave Ocean Grove, NJ | 5.0 | 2.5 | 1450 | $7,500 | $5.17 | 1d | 1 | 1.43mi |
| 305 Ocean Ave Avon by the Sea, NJ | 5.0 | 3.0 | 2064 | $10,000 | $4.84 | 11d | 1 | 1.44mi |
| 3 Bath Ave Ocean Grove, NJ | 5.0 | 2.5 | 2154 | $5,500 | $2.55 | 43d | 1 | 1.44mi |
Listing history 3 events
-
2025-12-19status Pending
-
2025-12-08$535,000 Active
-
2004-09-13soldstatus $425,000
ⓘ Source: listings_history table (triggers on properties + properties_extension) + one-shot
backfill from property_details.listing_events for pre-trigger history.
Tax reassessment forecast NJ · Partial reset (capped growth)
- Current annual tax
- $9,820 · $818/mo
- Projected year-2 tax
- $11,571 · $964/mo
- Expected delta
- +$1,751/yr (+$146/mo · 17.8%)
ⓘ Screening estimate from a state-policy table — verify with the county assessor before closing.
Climate risk First Street
- Flood 1/10 Low FEMA zone X (unshaded) · 0% chance over 30 yrs
- Wildfire 1/10 Low
- Heat 8/10 Severe 7 d/yr ≥95°F today · 15 d/yr by 30 yrs out
- Wind 8/10 Severe 80% chance of damaging wind over 30 yrs
- Air quality 3/10 Moderate 2 unhealthy d/yr today · 3 by 30 yrs out
Nearby sold comps map
Loading sold comps map…
Walkable amenities ~0.75 mi
Loading nearby amenities…
Taxation est. · year 1
- Rental income
- $70,390
- − Mortgage interest
- −$29,968
- − Property taxes
- −$9,820
- − Insurance
- −$2,675
- − Repairs & maintenance
- −$5,631
- − Management
- −$5,631
- − Depreciation
- −$15,564
- Taxable income
- $1,100
- Est. tax owed @ 24.0%
- −$264
- After-tax cash flow
- $9,182/yr
For passive investors: Depreciation is non-cash, so a rental often shows a tax loss while cash-flowing — sheltering income. Rental losses are passive: they offset passive income freely, and up to $25,000/yr can offset ordinary (W-2) income if you actively participate and your MAGI is under $100k (phasing out to $0 by $150k); unused losses carry forward. On sale, claimed depreciation is recaptured at up to 25%, and gains may owe capital-gains tax (a 1031 exchange can defer both). Figures are a year-1 estimate at your 24.0% rate — not tax advice; consult a CPA.
Schools (NCES district)
- District
- Neptune Township School District
- NCES district ID
- 3411160
- Math proficiency
- 12% ▼ -8.00%
- Reading proficiency
- 33% ▼ -1.00%
- Median HH income
- $63,016
- Composite
- 21.14/100
- National rank
- #8432
- State rank
- #404 of 472 in NJ
Livability — Neptune City
- Score
- 67/100
- State rank
- #332
- US rank
- #10607
Category grades
Schools grade is shown separately in the Schools card above.
Census & demographics
- County
- Monmouth County · 505,557 people
- Metro
- New York-Newark-Jersey City, NY-NJ-PA
- Population (ZIP)
- 37,297
- Household income
- $95,712
- Rent vs Own
- Severe rent burden
- 1263.0
Population outlook (Monmouth County) Hauer SSP2
- Today (2025)
- 620,308 people
- By 2030
- 612,309 · -1.3%
- By 2040
- 587,297 · -5.3%
- By 2050
- 551,342 · -11.1%
- By 2075
- 472,934 · -23.8%
- By 2100
- 381,534 · -38.5%
Race, ethnicity, and origin ACS 2023
- Neighborhood character
- Diverse neighborhood (Simpson 0.65)
- Race & ethnicity
- White 51% Black 26% Hispanic / Latino 16% Two or more races 9% Asian 3% Native American 1%
- Hispanic origin (detail)
- Mexican 5% Puerto Rican 5%
- Common ancestry
- Romanian 4% Hispanic 3% Scotch-Irish 1%
- Foreign-born
- 14% · Canada, Guatemala, South Korea
- Languages at home
- 80% English-only · Spanish 11% French/Haitian/Cajun 4% Other Indo-European 2%
Political lean MEDSL · Monmouth
- 2024 margin
- R (+11.4) · D 43.4% · R 54.8% · Other 1.8%
- 2008→2024 swing
- -7.7pp toward R · 2008: -3.7pp · 2024: -11.4pp
- All cycles
- 2024: R+11.4 2020: R+2.8 2016: R+9.5 2012: R+5.5 2008: R+3.7
Not yet ingested
- Civics
- —
Market trends
- HPI YoY
- ▼ -432.73%
- Current HPI
- 391.3411
- Rent YoY
- ▲ 4.58%
- Metro
- New York-Newark-Jersey City, NY-NJ-PA
- State GDP YoY
- ▲ 2.05%
- F500 in state
- 34
Industry mix (Fortune 500 HQ in NJ)
| Industry | F500 HQs | Revenue |
|---|---|---|
| Consumer Goods | 3 | $31B |
|
||
| Pharmaceuticals | 2 | $153B |
|
||
| Technology | 2 | $21B |
|
||
| Insurance | 2 | $20B |
|
||
| Healthcare | 2 | $19B |
|
||
| Financial Services | 1 | $70B |
|
||
Price history
+25.9% since first listed3 events — show timeline
- 2025-12-19 Pending — MOMLS
- 2025-12-08 Listed $535,000 MOMLS
- 2004-09-13 Sold (Public Records) $425,000 Public Records
Property tax history
+1.2%/yrLatest (2025): $9,820 · +12.5% YoY. Source: county tax records.
Cash-flow waterfall
monthlySold comps — $/sqft
last 12 mo · ≤1 miLoading sold comps…