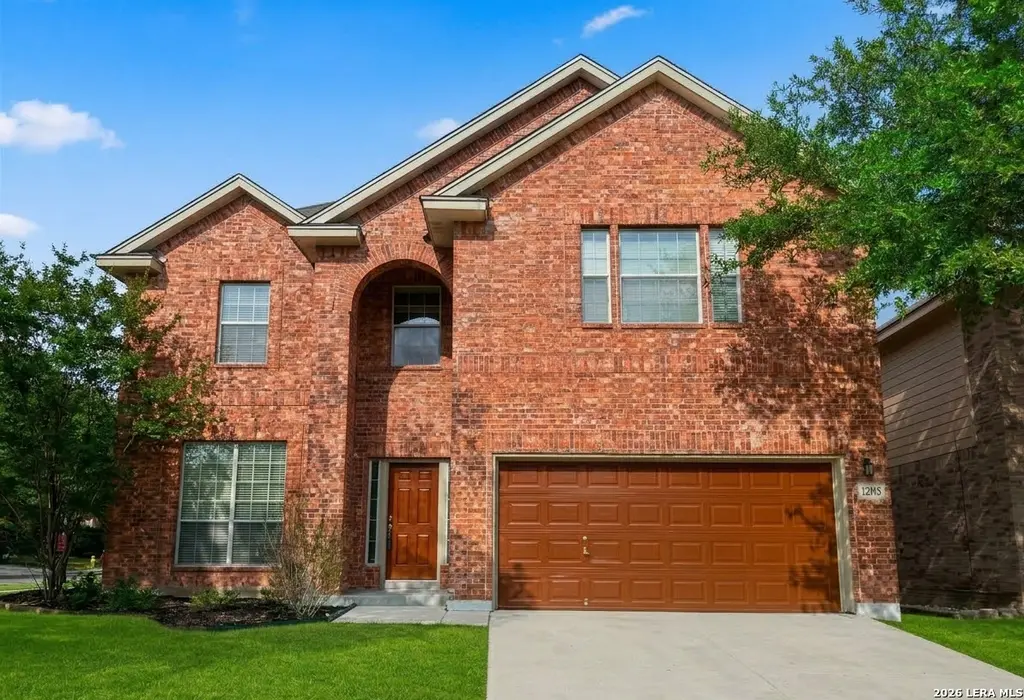
1203 Ganton Ln · Timberwood Park, TX
Flood risk 1/10 · Minimal
- FEMA flood zone
- X (unshaded)
- Chance of flooding over 30 yrs
- 0.0%
- Est. flood insurance / yr
- $507 – $1,088
Fire risk 3/10 · Minor
- Est. fire insurance / yr
- $1,222 – $2,270
Heat risk 7/10 · Major
- Hot days now (above 106°F)
- 7 days/yr
- Hot days in 30 yrs
- 22 days/yr
Wind risk 6/10 · Moderate
- Chance of severe wind over 30 yrs
- 70.0%
Air-quality risk 2/10 · Minimal
- Unhealthy air days now
- 1 days/yr
- Unhealthy air days in 30 yrs
- 1 days/yr
Risk factors via First Street. Map © Google.
Why this score? — see what drove the D- grade
The composite is a weighted blend of 9 inputs, each scored 0–100. Each bar is that input's sub-score; the figure is the points it added to the 100-point composite (weight × sub-score).
- ARV discount +10.8/15.0
- Cash flow +9.6/30.0
- Schools +5.2/10.0
- Rent growth +3.3/5.0
- Livability +3.3/5.0
- 1% rule +2.7/10.0
- DSCR +2.7/10.0
- Condition / age +2.5/5.0
- Appreciation +0.0/10.0
$374,900
🖨 Deal sheet 📄 Offer letter ✓ Due diligence
Listing remarks MLS
Located within a smaller gated section of Canyon Springs Cove, this corner-lot home offers a quiet, low-traffic setting with added privacy and a peaceful living environment. With over 3,000 square feet of well-designed living space, the home has been recently refreshed and is move-in ready. Recent updates include a newer roof, fresh interior and exterior paint, and updated kitchen appliances including a refrigerator, oven, and microwave. The main level features formal living and dining areas, a welcoming family room with fireplace, and a kitchen with a bright breakfast nook-ideal for both everyday living and entertaining. The primary suite is conveniently located downstairs, complete with a full bathroom featuring a separate tub and shower. Upstairs offers a large game room, three spacious secondary bedrooms, and a small study/office, providing flexible space for work, study, or additional living needs. Priced at $379,900-below the BCAD appraised value of approximately $403,700-this home presents a compelling opportunity for buyers seeking space, location, and value. Conveniently located near shopping, dining, major roadways, and highly regarded Comal ISD schools, this home is ideal for families or those relocating to the area.
Key facts
- Gated community
- Recent updates
- Corner-lot
Tags
Neighborhood map
What this means for you Summary
Snapshot
- This is a 4-bed/2.5-bath single-family listed at $375k.
Deal economics
- At list price, monthly cash flow is $-255 ($-3k/yr) — negative.
- To cash-flow at today's rent, offer at most $330k (12.0% below list).
- To meet the 1% rule (rent ≥ 1% of price), the offer needs to be $288k (23.3% below list).
- Recommended offer: $288k (23.3% below list) — sets the bar for 1% rule.
- Cap rate 5.5% vs local median 2.8% in Timberwood Park — top-decile yield for the area; either an underpriced asset or a hidden risk that comps aren't pricing in. Stress-test before assuming the spread holds.
Location & tenants
- Location reads 66/100 on livability (#607 in TX) — a middle-class / working-renter tenant base. Strengths: employment A+, housing A+, crime A; Watch: schools D+, cost of living D, amenities F.
- Comal ISD (rural): math 57% / reading 59% proficiency, ranked #58 of 826 in TX (top 7%) — acceptable for families but not a draw, mixed tenant base, ~2y average lease.
- Market conditions: Rents rising (+3.0%/yr); 388 active listings in the ZIP; 24 comparable units currently listed for rent nearby; rentals leasing fast (median 13d on market — plan ~1-2 weeks tenant-placement turnaround); high-income renter base; 8,308 units permitted in Bexar County in 2024 (2,506 in 5+ unit buildings).
Forward outlook
- Local home prices are declining (-3.0%/yr); year-one equity from $3k of loan paydown is wiped out by about $11k of value loss. Plan a longer hold.
- Bexar County population projected at +50% by 2050 — long-run rental-demand tailwind backs the buy-and-hold thesis.
Negotiation context
- It's been on market 152 days — a 12% lower offer ($330k) is reasonable based on typical stale-listing flexibility.
- 8 sale attempts since 20y ago with the ask held roughly flat each time — persistent listings suggest the price (not the market) is what's stuck; bring a comps-based counter.
Risks & watch-outs
- Climate carrying-cost: major wind risk, 70% chance of damaging wind over 30y; extreme-heat days projected 7→22/yr by 2055 (HVAC capex compounding) — expect insurance premiums to compound above CPI over the hold.
Questions for the listing agent
- What do current leases actually rent for vs. the listed asking? Can we see a recent rent roll and the last 12 months of T-12 income?
- It's been on market 152 days. Have you received any prior offers? Is the seller open to a 23% concession, seller financing, or rate buy-down credit?
- What does the HOA fee cover, when was the last increase, and are there any pending special assessments or reserve-fund shortfalls?
- Why hasn't it sold? Are there any deal-killer items the seller is aware of (foundation, flood, title, zoning, code violations)?
- Is there a deadline driving the sale (1031 exchange, divorce, estate, relocation)? That informs how much negotiation room exists.
- Schools are D-rated, which usually means shorter tenancies and higher turnover. Who's the typical renter profile here, and what's been the actual vacancy rate?
- The area grade is low — what's the realistic commute time and amenity access for the typical tenant pool here? Any planned neighborhood developments (good or bad) we should know about?
- What's the average days-on-market for RENTAL listings here right now (not sales)? A rising rental-DOM trend means longer vacancies and softer asking-rent achievability than the comps imply.
- What's the recent tenant-quality profile in this submarket — average credit score on applications, eviction rate, late-payment / NSF rate, and stable-employment percentage? A property-management company in the area should have these aggregated.
- How much new for-sale + rental construction is in the pipeline within 1–3 miles? Heavy new supply typically softens prices + rents 12–24 months out; constrained supply supports both.
Investment metrics
- 1% rule
- 0.77% ✗
- Cap rate
- 5.48%
- Cash-on-cash
- -2.92%
- DSCR
- 0.87
- GRM
- 10.9
CMA / ARV
- ARV (median comp)
- $404,150
- List price
- $374,900
- Delta
- -7.24%
- Verdict
- FAIR
- Comps
- 20 within 1.0 mi
Show comp detail 12 sales within ~0.75 mi
| Address | Dist | Beds/Ba | Sqft | Sold | Price | $/sf | Match |
|---|---|---|---|---|---|---|---|
| 1203 Ganton Ln | 0.00mi | 4/3.0 | 3,036 (0%) | 0mo | $374,900 | $123 | 98 |
| 25916 Stone Cyn | 0.20mi | 4/2.5 | 3,087 (+2%) | 2mo | $490,000 | $159 | 86 |
| 1417 Tanager Ct | 0.30mi | 4/3.0 | 3,007 (-1%) | 3mo | $510,000 | $170 | 80 |
| 1007 Misty Water | 0.33mi | 3/2.5 (-1) | 2,831 (-7%) | 2mo | $695,000 | $245 | 66 |
| 1606 Lookout Frst | 0.54mi | 4/3.5 | 3,141 (+4%) | 0mo | $459,000 | $146 | 65 |
| 1450 Sparrow Song | 0.47mi | 4/2.5 | 2,776 (-9%) | 1mo | $440,000 | $159 | 63 |
| 1706 Lilac Mist | 0.60mi | 4/2.5 | 2,861 (-6%) | 2mo | $315,000 | $110 | 61 |
| 26111 Starling Hl | 0.33mi | 4/3.0 | 2,699 (-11%) | 4mo | $460,000 | $170 | 60 |
| 955 Vista Serena | 0.35mi | 4/3.0 | 2,597 (-14%) | 5mo | $525,000 | $202 | 53 |
| 1852 Lookout Frst | 0.75mi | 4/3.5 | 3,209 (+6%) | 1mo | $530,000 | $165 | 51 |
| 1807 Cambridge Blue | 0.68mi | 4/3.0 | 2,776 (-9%) | 3mo | $320,000 | $115 | 49 |
| 930 Dulce Vis | 0.48mi | 4/4.0 | 3,472 (+14%) | 5mo | $685,000 | $197 | 44 |
Match score weights: distance 35% · size 25% · config 20% · recency 20%. Top-matched comps best support the ARV.
Projected returns pro-forma
-3.0% appreciation · 3.01% rent growth · sell at horizon
- IRR
- -21.2%
- Equity multiple
- 0.27×
- Total profit
- $-76,988
- Equity at exit
- $55,899
- IRR
- -14.6%
- Equity multiple
- 0.16×
- Total profit
- $-87,855
- Equity at exit
- $32,415
Cash invested: $104,972 (down + closing). Projections, not guarantees.
Landlord ↔ Tenant lean methodology
- Overall (STATE)
- 87 Strongly Landlord-Friendly
- State Texas
- 87 Strongly Landlord-Friendly · R+5
- County
- — inherits STATE
- City
- — inherits STATE
ZIP-level market 78260
- Home prices YoY
- -20.1%
- Rents YoY
- 3.0%
- Active inventory
- 388
- Price-to-rent
- 10.9×
Monthly cashflow live
- Estimated rent
- $2,876 high interval (Pro) →
- Mortgage (P&I)
- −$1,966
- Tax from tax record
- −$273 /mo · $3,278/yr
- Insurance
- −$156
- HOA
- −$132
- Vacancy / Maint / Mgmt
- −$604
- Net cashflow
- $-255
Break-even live
UW: 25.0% down · 7.5% · 30yr · 1.5% tax · 5.0% vac · 8.0% maint · 8.0% mgmt
Financing live
Cash to close
- Down payment
- $93,725
- Closing costs
- $11,247
- Reserves months
- —
- Total cash needed
- —
Loan-product check · same deal, 3 products live
Conventional
25% down · 7.5% · 30yr
- Down + closing
- —
- Monthly P&I
- —
- Monthly cashflow
- —
- DSCR
- —
- Eligible?
- —
Personal DTI + credit; lowest rate.
DSCR
20% down · 8.5% · 30yr
- Down + closing
- —
- Monthly P&I
- —
- Monthly cashflow
- —
- DSCR
- —
- Eligible?
- —
No personal income docs; deal must DSCR.
Hard money
10% down · 12.0% · 12mo
- Down + closing
- —
- Monthly P&I
- —
- Monthly cashflow
- —
- DSCR
- —
- Eligible?
- —
Short-term bridge; refi at stabilization.
Rent comps 24 comps
| Address | Beds | Baths | Sqft | Rent | $/sqft | DOM | Units | Dist |
|---|---|---|---|---|---|---|---|---|
| 1014 Mineral Hls San Antonio, TX | 4.0 | 3.5 | 2549 | $2,750 | $1.08 | 3d | 1 | 0.25mi |
| 26002 Meadowlark Bay San Antonio, TX | 4.0 | 2.5 | 2642 | $2,950 | $1.12 | 18d | 1 | 0.26mi |
| 26123 Destiny Rdg Unit Labs San Antonio, TX | 5.0 | 3.5 | 3074 | $2,999 | $0.98 | 11d | 1 | 0.37mi |
| 25427 Bunker Dr San Antonio, TX | 5.0 | 4.0 | 3842 | $3,650 | $0.95 | 12d | 1 | 0.40mi |
| 1514 Mallard Hvn San Antonio, TX | 3.0 | 3.0 | 3007 | $2,900 | $0.96 | 44d | 1 | 0.40mi |
| 1619 Spice Spg San Antonio, TX | 4.0 | 2.5 | 2336 | $2,430 | $1.04 | 3d | 1 | 0.55mi |
| 25803 Torch Lily San Antonio, TX | 3.0 | 2.5 | 2403 | $2,095 | $0.87 | 12d | 1 | 0.56mi |
| 1507 Lookout Pt San Antonio, TX | 4.0 | 3.0 | 3193 | $2,800 | $0.88 | 24d | 1 | 0.65mi |
| 1730 Twilight Blf San Antonio, TX | 3.0 | 2.5 | 2403 | $2,150 | $0.89 | 4d | 1 | 0.68mi |
| 25210 Battle Lk San Antonio, TX | 3.0 | 2.5 | 2634 | $2,650 | $1.01 | 44d | 1 | 0.70mi |
| 25610 Crimson Beauty San Antonio, TX | 4.0 | 3.0 | 2740 | $2,125 | $0.78 | 3d | 1 | 0.70mi |
| 24922 Shinnecock Trl San Antonio, TX | 4.0 | 2.0 | 2495 | $2,900 | $1.16 | 4d | 1 | 0.71mi |
| 723 Sendera St San Antonio, TX | 3.0 | 2.0 | 2401 | $2,500 | $1.04 | 4d | 1 | 0.77mi |
| 714 Misty Water Ln San Antonio, TX | 4.0 | 3.5 | 3004 | $4,150 | $1.38 | 44d | 1 | 0.77mi |
| 24919 Birdie Rdg San Antonio, TX | 4.0 | 4.5 | 4364 | $5,400 | $1.24 | 4d | 1 | 0.90mi |
| 1215 Via Se Villa San Antonio, TX | 5.0 | 4.0 | 3595 | $5,000 | $1.39 | 3d | 1 | 0.99mi |
| 26714 Sunstream Way San Antonio, TX | 4.0 | 2.5 | 2454 | $2,800 | $1.14 | 22d | 1 | 1.01mi |
| 26144 Amber Sky San Antonio, TX | 4.0 | 3.5 | 3744 | $2,795 | $0.75 | 44d | 1 | 1.13mi |
| 24345 Wilderness Oak San Antonio, TX | 1.0–4.0 | 1.0–3.0 | 1623 | $2,995 | $1.85 | 4d | 29 | 1.18mi |
| 602 Trinity Mdw San Antonio, TX | 4.0 | 2.5 | 2390 | $2,500 | $1.05 | 3d | 1 | 1.38mi |
| 24418 Canyon Row San Antonio, TX | 4.0 | 3.5 | 3042 | $2,995 | $0.98 | 24d | 1 | 1.39mi |
| 27327 Lasso Bnd San Antonio, TX | 4.0 | 3.0 | 2686 | $2,100 | $0.78 | 24d | 1 | 1.44mi |
| 24730 Chianti Way San Antonio, TX | 5.0 | 3.5 | 3700 | $4,500 | $1.22 | 44d | 1 | 1.46mi |
| 23902 Alpine Ldg San Antonio, TX | 5.0 | 3.5 | 3266 | $3,350 | $1.03 | 44d | 1 | 1.49mi |
HOA detail
- Monthly dues
- $132 · $1,584/yr
- Likely covers
- security
Listing history 36 events
-
2026-06-07statusdays on market $374,900 Pending 152 DOM
-
2026-06-04days on market $374,900 Active Option 151 DOM
-
2026-06-03days on market $374,900 Active Option 150 DOM
-
2026-06-02days on market $374,900 Active Option 149 DOM
-
2026-06-02days on market $374,900 Active Option 148 DOM
-
2026-05-31days on market $374,900 Active Option 147 DOM
-
2026-05-05historical Active Option 1262-char remark
Show marketing remark (1262 chars)
Located within a smaller gated section of Canyon Springs Cove, this corner-lot home offers a quiet, low-traffic setting with added privacy and a peaceful living environment. With over 3,000 square feet of well-designed living space, the home has been recently refreshed and is move-in ready. Recent updates include a newer roof, fresh interior and exterior paint, and updated kitchen appliances including a refrigerator, oven, and microwave. The main level features formal living and dining areas, a welcoming family room with fireplace, and a kitchen with a bright breakfast nook-ideal for both everyday living and entertaining. The primary suite is conveniently located downstairs, complete with a full bathroom featuring a separate tub and shower. Upstairs offers a large game room, three spacious secondary bedrooms, and a small study/office, providing flexible space for work, study, or additional living needs. Priced at $379,900-below the BCAD appraised value of approximately $403,700-this home presents a compelling opportunity for buyers seeking space, location, and value. Conveniently located near shopping, dining, major roadways, and highly regarded Comal ISD schools, this home is ideal for families or those relocating to the area.
-
2026-04-04price $374,900 1262-char remark
Show marketing remark (1262 chars)
Located within a smaller gated section of Canyon Springs Cove, this corner-lot home offers a quiet, low-traffic setting with added privacy and a peaceful living environment. With over 3,000 square feet of well-designed living space, the home has been recently refreshed and is move-in ready. Recent updates include a newer roof, fresh interior and exterior paint, and updated kitchen appliances including a refrigerator, oven, and microwave. The main level features formal living and dining areas, a welcoming family room with fireplace, and a kitchen with a bright breakfast nook-ideal for both everyday living and entertaining. The primary suite is conveniently located downstairs, complete with a full bathroom featuring a separate tub and shower. Upstairs offers a large game room, three spacious secondary bedrooms, and a small study/office, providing flexible space for work, study, or additional living needs. Priced at $379,900-below the BCAD appraised value of approximately $403,700-this home presents a compelling opportunity for buyers seeking space, location, and value. Conveniently located near shopping, dining, major roadways, and highly regarded Comal ISD schools, this home is ideal for families or those relocating to the area.
-
2026-03-17price $379,900 1262-char remark
Show marketing remark (1262 chars)
Located within a smaller gated section of Canyon Springs Cove, this corner-lot home offers a quiet, low-traffic setting with added privacy and a peaceful living environment. With over 3,000 square feet of well-designed living space, the home has been recently refreshed and is move-in ready. Recent updates include a newer roof, fresh interior and exterior paint, and updated kitchen appliances including a refrigerator, oven, and microwave. The main level features formal living and dining areas, a welcoming family room with fireplace, and a kitchen with a bright breakfast nook-ideal for both everyday living and entertaining. The primary suite is conveniently located downstairs, complete with a full bathroom featuring a separate tub and shower. Upstairs offers a large game room, three spacious secondary bedrooms, and a small study/office, providing flexible space for work, study, or additional living needs. Priced at $379,900-below the BCAD appraised value of approximately $403,700-this home presents a compelling opportunity for buyers seeking space, location, and value. Conveniently located near shopping, dining, major roadways, and highly regarded Comal ISD schools, this home is ideal for families or those relocating to the area.
-
2026-01-25historical $2,500
-
2026-01-04$384,900 New 1262-char remark
Show marketing remark (1262 chars)
Located within a smaller gated section of Canyon Springs Cove, this corner-lot home offers a quiet, low-traffic setting with added privacy and a peaceful living environment. With over 3,000 square feet of well-designed living space, the home has been recently refreshed and is move-in ready. Recent updates include a newer roof, fresh interior and exterior paint, and updated kitchen appliances including a refrigerator, oven, and microwave. The main level features formal living and dining areas, a welcoming family room with fireplace, and a kitchen with a bright breakfast nook-ideal for both everyday living and entertaining. The primary suite is conveniently located downstairs, complete with a full bathroom featuring a separate tub and shower. Upstairs offers a large game room, three spacious secondary bedrooms, and a small study/office, providing flexible space for work, study, or additional living needs. Priced at $379,900-below the BCAD appraised value of approximately $403,700-this home presents a compelling opportunity for buyers seeking space, location, and value. Conveniently located near shopping, dining, major roadways, and highly regarded Comal ISD schools, this home is ideal for families or those relocating to the area.
-
2025-12-23$2,500
-
2025-12-23historical $2,500
-
2025-11-01price $2,500
-
2025-10-26historical
-
2025-10-11price $384,900
-
2025-10-11price $2,600
-
2025-10-06price $389,990
-
2025-09-23$2,700
-
2025-09-19price $395,900
-
2025-08-27price $399,900
-
2025-08-17price $404,900
-
2025-08-09status Back on Market
-
2025-07-20status Pending
-
2025-07-10historical Active Option
-
2025-06-26$409,900 New
-
2019-04-22soldstatus Sold
-
2019-04-22soldstatus
-
2019-03-27historical Active Option
-
2019-03-23$265,000 New
-
2013-04-22soldstatus
-
2013-04-19soldstatus
-
2013-03-23historical
-
2012-09-08$224,900
-
2006-12-03soldstatus
-
2006-09-15$227,426
ⓘ Source: listings_history table (triggers on properties + properties_extension) + one-shot
backfill from property_details.listing_events for pre-trigger history.
Tax reassessment forecast TX · Resets to sale price
- Current annual tax
- $3,278 · $273/mo
- Projected year-2 tax
- $6,861 · $572/mo
- Expected delta
- +$3,583/yr (+$299/mo · 109.3%)
ⓘ Screening estimate from a state-policy table — verify with the county assessor before closing.
Climate risk First Street
- Flood 1/10 Low FEMA zone X (unshaded) · 0% chance over 30 yrs
- Wildfire 3/10 Moderate
- Heat 7/10 Severe 7 d/yr ≥106°F today · 22 d/yr by 30 yrs out
- Wind 6/10 Major 70% chance of damaging wind over 30 yrs
- Air quality 2/10 Low 1 unhealthy d/yr today · 1 by 30 yrs out
Nearby sold comps map
Loading sold comps map…
Walkable amenities ~0.75 mi
Loading nearby amenities…
Taxation est. · year 1
- Rental income
- $34,510
- − Mortgage interest
- −$21,000
- − Property taxes
- −$3,278
- − Insurance
- −$1,874
- − Repairs & maintenance
- −$2,761
- − Management
- −$2,761
- − HOA
- −$1,584
- − Depreciation
- −$10,906
- Taxable loss
- −$9,654
- Est. tax savings @ 24.0%
- +$2,317
- After-tax cash flow
- $-749/yr
For passive investors: Depreciation is non-cash, so a rental often shows a tax loss while cash-flowing — sheltering income. Rental losses are passive: they offset passive income freely, and up to $25,000/yr can offset ordinary (W-2) income if you actively participate and your MAGI is under $100k (phasing out to $0 by $150k); unused losses carry forward. On sale, claimed depreciation is recaptured at up to 25%, and gains may owe capital-gains tax (a 1031 exchange can defer both). Figures are a year-1 estimate at your 24.0% rate — not tax advice; consult a CPA.
Schools (NCES district)
- District
- Comal ISD
- NCES district ID
- 4814730
- Math proficiency
- 57% ▼ -9.00%
- Reading proficiency
- 59% ▼ -2.00%
- Median HH income
- $74,792
- Composite
- 51.79/100
- National rank
- #1671
- State rank
- #58 of 826 in TX
Livability — Timberwood Park
- Score
- 66/100
- State rank
- #607
- US rank
- #11535
Category grades
Schools grade is shown separately in the Schools card above.
Census & demographics
- Census place
- Timberwood Park, TX
- County
- Bexar County · 1,990,555 people
- City population
- 37,389
- Metro
- San Antonio-New Braunfels, TX
- Population (ZIP)
- 38,023
- Household income
- $154,590
- Rent vs Own
- Severe rent burden
- 347.0
Population outlook (Bexar County) Hauer SSP2
- Today (2025)
- 2,336,851 people
- By 2030
- 2,560,728 · +9.6%
- By 2040
- 3,020,569 · +29.3%
- By 2050
- 3,493,522 · +49.5%
- By 2075
- 4,668,459 · +99.8%
- By 2100
- 5,533,242 · +136.8%
Race, ethnicity, and origin ACS 2023
- Neighborhood character
- Diverse neighborhood (Simpson 0.63)
- Race & ethnicity
- White 49% Hispanic / Latino 35% Two or more races 21% Asian 6% Black 5%
- Hispanic origin (detail)
- Mexican 27% Puerto Rican 1%
- Common ancestry
- Romanian 3% Lithuanian 2% Slovak 2%
- Foreign-born
- 15% · Canada, China, Guatemala
- Languages at home
- 75% English-only · Spanish 17% Other Indo-European 3% Other Asian/Pacific 2%
Political lean MEDSL · Bexar
- 2024 margin
- Lean D (+9.8) · D 54.3% · R 44.6% · Other 1.1%
- 2008→2024 swing
- +4.2pp toward D · 2008: 5.6pp · 2024: 9.8pp
- All cycles
- 2024: D+9.8 2020: D+18.2 2016: D+13.5 2012: D+4.6 2008: D+5.6
Not yet ingested
- Civics
- —
Market trends
- HPI YoY
- ▼ -60.42%
- Current HPI
- 240.044
- Rent YoY
- ▲ 3.01%
- Metro
- San Antonio-New Braunfels, TX
- State GDP YoY
- ▲ 3.95%
- F500 in state
- 110
Industry mix (Fortune 500 HQ in TX)
| Industry | F500 HQs | Revenue |
|---|---|---|
| Energy | 16 | $1,198B |
|
||
| Technology | 5 | $198B |
|
||
| Engineering / Construction | 4 | $72B |
|
||
| Energy Services | 3 | $60B |
|
||
| Utilities | 3 | $41B |
|
||
| Healthcare | 2 | $330B |
|
||
Price history
+64.8% since first listed30 events — show timeline
- 2026-05-05 Contingent — LERA
- 2026-04-04 Price Changed $374,900 LERA
- 2026-03-17 Price Changed $379,900 LERA
- 2026-01-25 Rental Removed $2,500 RENTSPREE
- 2026-01-04 Listed $384,900 LERA
- 2025-12-23 Listed for Rent $2,500 RENTSPREE
- 2025-12-23 Rental Removed $2,500 SABOR
- 2025-11-01 Price Changed $2,500 SABOR
- 2025-10-26 Listing Removed — LERA
- 2025-10-11 Price Changed $384,900 LERA
- 2025-10-11 Price Changed $2,600 SABOR
- 2025-10-06 Price Changed $389,990 LERA
- 2025-09-23 Listed for Rent $2,700 SABOR
- 2025-09-19 Price Changed $395,900 LERA
- 2025-08-27 Price Changed $399,900 LERA
- 2025-08-17 Price Changed $404,900 LERA
- 2025-08-09 Relisted — LERA
- 2025-07-20 Pending — LERA
- 2025-07-10 Contingent — LERA
- 2025-06-26 Listed $409,900 LERA
- 2019-04-22 Sold (MLS) — LERA
- 2019-04-22 Sold (Public Records) — Public Records
- 2019-03-27 Contingent — LERA
- 2019-03-23 Listed $265,000 LERA
- 2013-04-22 Sold (Public Records) — Public Records
- 2013-04-19 Sold (MLS) — LERA
- 2013-03-23 Listing Removed — LERA
- 2012-09-08 Listed $224,900 LERA
- 2006-12-03 Sold (MLS) — LERA
- 2006-09-15 Listed $227,426 LERA
Property tax history
+5.9%/yrLatest (2025): $3,278 · -57.2% YoY. Source: county tax records.
Cash-flow waterfall
monthlySold comps — $/sqft
last 12 mo · ≤1 miLoading sold comps…