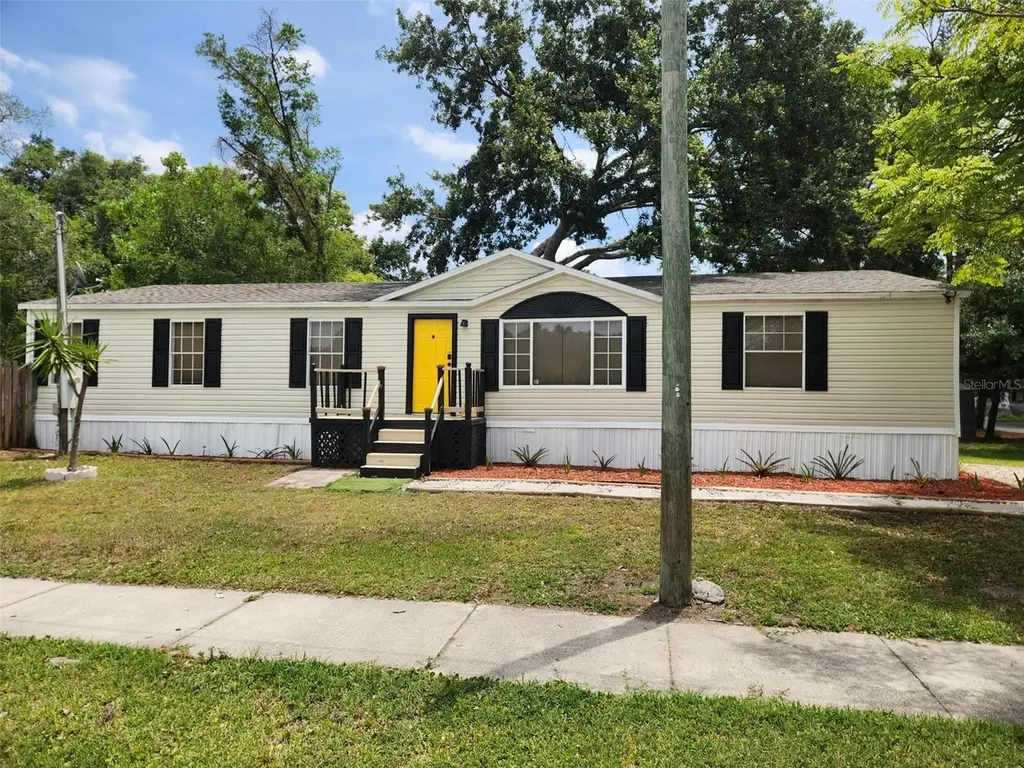
9653 4th Ave · Taft, FL
Flood risk 1/10 · Minimal
- FEMA flood zone
- X (unshaded)
- Chance of flooding over 30 yrs
- 0.0%
- Est. flood insurance / yr
- $507 – $1,088
Fire risk 3/10 · Minor
- Est. fire insurance / yr
- $947 – $1,759
Heat risk 9/10 · Severe
- Hot days now (above 108°F)
- 7 days/yr
- Hot days in 30 yrs
- 21 days/yr
Wind risk 9/10 · Severe
- Chance of severe wind over 30 yrs
- 99.0%
Air-quality risk 1/10 · Minimal
- Unhealthy air days now
- 0 days/yr
- Unhealthy air days in 30 yrs
- 0 days/yr
Risk factors via First Street. Map © Google.
Why this score? — see what drove the D- grade
The composite is a weighted blend of 9 inputs, each scored 0–100. Each bar is that input's sub-score; the figure is the points it added to the 100-point composite (weight × sub-score).
- Cash flow +12.5/30.0
- ARV discount +7.5/15.0
- Schools +4.1/10.0
- DSCR +3.7/10.0
- Livability +3.7/5.0
- 1% rule +2.9/10.0
- Condition / age +2.5/5.0
- Rent growth +2.4/5.0
- Appreciation +0.0/10.0
$299,990
🖨 Deal sheet (PDF) 📄 Offer letter ✓ Due diligence
Listing remarks MLS
Short Sale; This 3 bedroom 2 bath manufactured home is located on a large corner lot. Built in 2003, this property features a formal dining room, living/great room that over looks the kitchen, breakfast bar, inside utility room and more!The master bathroom offers a large garden and seperate shower stall. This location offers easy access to airport, atractions, dining, and shopping.
Key facts
- Sizable yard
- Spacious kitchen
- 7,887 sq ft lot
Tags
Property features AI
Finance
- Other: Property classified as residential (manufactured home); Zoning: R-T-1; Total living area reported as 1,620 square feet
- Financial info: No lease restrictions; Annual taxes listed (see full listing for amount)
- HOA & community: No association; No association approval required
Exterior
- Utilities: Electricity connected; Water connected; Septic tank; Cable available; Broadband/high-speed internet available
- Home design: Manufactured double-wide home; One story; East-facing entry
- Construction: Metal frame with metal siding; Shingle roof; Crawlspace foundation; Built on a 0.18-acre lot
- Exterior features: Asphalt-paved road access
Interior
- Kitchen: Range; Refrigerator
- Bedrooms: Three bedrooms
- Flooring: Laminate
- Bathrooms: Two full bathrooms
- Heating & cooling: Central heating; Central air conditioning
- Interior features: Range and refrigerator included; Laminate flooring; Six total rooms
- Laundry & utility: Laundry inside
Neighborhood map
What this means for you Summary
Snapshot
- This is a 3-bed/2.0-bath manufactured listed at $300k.
Deal economics
- At list price, monthly cash flow is $-45 ($-542/yr) — negative.
- To cash-flow at today's rent, offer at most $292k (2.7% below list).
- To meet the 1% rule (rent ≥ 1% of price), the offer needs to be $237k (20.9% below list).
- Recommended offer: $237k (20.9% below list) — sets the bar for 1% rule.
Location & tenants
- Location reads 74/100 on livability (#275 in FL, #4,431 nationally) — a middle-class / working-renter tenant base. Strengths: crime A+, cost of living A+, housing A+; Watch: schools F, amenities F, employment D-.
- Orange (suburban): math 46% / reading 51% proficiency, ranked #43 of 73 in FL (top 59%) — families likely to look elsewhere, expect single-tenant / working-renter base with shorter leases.
- Market conditions: Rents soft (-0.2%/yr); 344 active listings in the ZIP; 6 comparable units currently listed for rent nearby; rentals at typical pace (median 22d on market — plan ~3-4 weeks tenant-placement turnaround); solid renter incomes; 8,053 units permitted in Orange County in 2024 (3,133 in 5+ unit buildings).
- This rent runs 34% of the median local income ($85k/yr) — at the standard rent-burdened threshold; future hikes will face affordability resistance.
Forward outlook
- Local home prices are declining (-3.0%/yr); year-one equity from $2k of loan paydown is wiped out by about $9k of value loss. Plan a longer hold.
- Orange County population projected at +52% by 2050 — long-run rental-demand tailwind backs the buy-and-hold thesis.
Negotiation context
- It's been on market 39 days — a 3% lower offer ($291k) is reasonable based on typical stale-listing flexibility.
- 3 sale attempts since 19y ago with the ask held roughly flat each time — persistent listings suggest the price (not the market) is what's stuck; bring a comps-based counter.
- Current owner paid $115k; list at $300k implies a 161% gain — meaningful room to come down on a strong offer.
Risks & watch-outs
- Climate carrying-cost: severe wind risk, 99% chance of damaging wind over 30y; extreme-heat days projected 7→21/yr by 2055 (HVAC capex compounding) — expect insurance premiums to compound above CPI over the hold.
Questions for the listing agent
- What do current leases actually rent for vs. the listed asking? Can we see a recent rent roll and the last 12 months of T-12 income?
- It's been on market 39 days. Have you received any prior offers? Is the seller open to a 21% concession, seller financing, or rate buy-down credit?
- Is there a deadline driving the sale (1031 exchange, divorce, estate, relocation)? That informs how much negotiation room exists.
- Schools are F-rated, which usually means shorter tenancies and higher turnover. Who's the typical renter profile here, and what's been the actual vacancy rate?
- The area grade is low — what's the realistic commute time and amenity access for the typical tenant pool here? Any planned neighborhood developments (good or bad) we should know about?
- What's the average days-on-market for RENTAL listings here right now (not sales)? A rising rental-DOM trend means longer vacancies and softer asking-rent achievability than the comps imply.
- What's the recent tenant-quality profile in this submarket — average credit score on applications, eviction rate, late-payment / NSF rate, and stable-employment percentage? A property-management company in the area should have these aggregated.
- How much new for-sale + rental construction is in the pipeline within 1–3 miles? Heavy new supply typically softens prices + rents 12–24 months out; constrained supply supports both.
Investment metrics
- 1% rule
- 0.79% ✗
- Cap rate
- 6.11%
- Cash-on-cash
- -0.65%
- DSCR
- 0.97
- GRM
- 10.5
CMA / ARV
No comps found within radius.
Projected returns pro-forma
-3.0% appreciation · 0.0% rent growth · sell at horizon
- IRR
- -20.5%
- Equity multiple
- 0.30×
- Total profit
- $-58,499
- Equity at exit
- $44,729
- IRR
- -21.6%
- Equity multiple
- 0.03×
- Total profit
- $-81,750
- Equity at exit
- $25,938
Cash invested: $83,997 (down + closing). Projections, not guarantees.
Landlord ↔ Tenant lean methodology
- Overall (STATE)
- 87 Strongly Landlord-Friendly
- State Florida
- 87 Strongly Landlord-Friendly · R+3
- County
- — inherits STATE
- City
- — inherits STATE
ZIP-level market 32824
- Rents YoY
- -0.2%
- Active inventory
- 344
- Price-to-rent
- 10.5×
Monthly cashflow live
- Estimated rent
- $2,372 high interval (Pro) →
- Mortgage (P&I)
- −$1,573
- Tax from tax record
- −$221 /mo · $2,652/yr
- Insurance
- −$125
- HOA
- −$0
- Vacancy / Maint / Mgmt
- −$498
- Net cashflow
- $-45
Break-even live
Sensitivity live
| Price | -10% $125 | -5% $40 | +0% $-45 | +5% $-130 | +10% $-215 |
|---|---|---|---|---|---|
| Rent | -10% $-233 | -5% $-139 | +0% $-45 | +5% $49 | +10% $142 |
| Rate | -1.0pp $106 | -0.5pp $31 | base $-45 | +0.5pp $-123 | +1.0pp $-202 |
UW: 25.0% down · 7.5% · 30yr · 1.5% tax · 5.0% vac · 8.0% maint · 8.0% mgmt
Financing live
Cash to close
- Down payment
- $74,998
- Closing costs
- $9,000
- Reserves months
- —
- Total cash needed
- —
Loan-product check · same deal, 3 products live
Conventional
25% down · 7.5% · 30yr
- Down + closing
- —
- Monthly P&I
- —
- Monthly cashflow
- —
- DSCR
- —
- Eligible?
- —
Personal DTI + credit; lowest rate.
DSCR
20% down · 8.5% · 30yr
- Down + closing
- —
- Monthly P&I
- —
- Monthly cashflow
- —
- DSCR
- —
- Eligible?
- —
No personal income docs; deal must DSCR.
Hard money
10% down · 12.0% · 12mo
- Down + closing
- —
- Monthly P&I
- —
- Monthly cashflow
- —
- DSCR
- —
- Eligible?
- —
Short-term bridge; refi at stabilization.
Rent comps 6 comps
| Address | Beds | Baths | Sqft | Rent | $/sqft | DOM | Units | Dist |
|---|---|---|---|---|---|---|---|---|
| 9854 5th Ave Orlando, FL | 3.0 | 2.0 | 1346 | $2,100 | $1.56 | 9d | 1 | 0.22mi |
| 9663 Cypress Park Dr Unit m9663c Orlando, FL | 3.0 | 2.0 | 1056 | $1,750 | $1.66 | 19d | 1 | 0.31mi |
| 1534 Sage Creek Ct Orlando, FL | 4.0 | 2.5 | 1901 | $2,435 | $1.28 | 21d | 1 | 0.49mi |
| 9751 Red Clover Ave Orlando, FL | 3.0 | 2.0 | 1224 | $2,210 | $1.81 | 21d | 1 | 0.53mi |
| 1914 Teaberry Ct Orlando, FL | 4.0 | 2.0 | 1177 | $2,550 | $2.17 | 23d | 1 | 0.56mi |
| 9599 Lupine Ave Orlando, FL | 3.0 | 2.0 | 1248 | $2,235 | $1.79 | 3d | 1 | 0.64mi |
Listing history 20 events
-
2026-06-21days on market $299,990 Active 39 DOM
-
2026-06-18days on market $299,990 Active 36 DOM
-
2026-06-17days on market $299,990 Active 35 DOM
-
2026-06-16days on market $299,990 Active 34 DOM
-
2026-06-15days on market $299,990 Active 33 DOM
-
2026-06-13days on market $299,990 Active 31 DOM
-
2026-06-13days on market $299,990 Active 30 DOM
-
2026-06-09days on market $299,990 Active 27 DOM
-
2026-06-08days on market $299,990 Active 26 DOM
-
2026-06-07days on market $299,990 Active 25 DOM
-
2026-06-04days on market $299,990 Active 22 DOM
-
2026-06-03days on market $299,990 Active 21 DOM
-
2026-06-02days on market $299,990 Active 20 DOM
-
2026-06-01days on market $299,990 Active 19 DOM
-
2026-05-31days on market $299,990 Active 18 DOM
-
2026-05-13$299,990 Active
-
2022-12-05soldstatus $115,000
-
2011-08-26soldstatus $23,000 384-char remark
Show marketing remark (384 chars)
Short Sale; This 3 bedroom 2 bath manufactured home is located on a large corner lot. Built in 2003, this property features a formal dining room, living/great room that over looks the kitchen, breakfast bar, inside utility room and more!The master bathroom offers a large garden and seperate shower stall. This location offers easy access to airport, atractions, dining, and shopping.
-
2011-02-04$24,900 384-char remark
Show marketing remark (384 chars)
Short Sale; This 3 bedroom 2 bath manufactured home is located on a large corner lot. Built in 2003, this property features a formal dining room, living/great room that over looks the kitchen, breakfast bar, inside utility room and more!The master bathroom offers a large garden and seperate shower stall. This location offers easy access to airport, atractions, dining, and shopping.
-
2007-06-19$159,900
ⓘ Source: listings_history table (triggers on properties + properties_extension) + one-shot
backfill from property_details.listing_events for pre-trigger history.
Tax reassessment forecast FL · Resets to sale price
- Current annual tax
- $2,652 · $221/mo
- Projected year-2 tax
- $2,652 · $221/mo
- Expected delta
- $0/yr ($0/mo · 0.0%)
ⓘ Screening estimate from a state-policy table — verify with the county assessor before closing.
Climate risk First Street
- Flood 1/10 Low FEMA zone X (unshaded) · 0% chance over 30 yrs
- Wildfire 3/10 Moderate
- Heat 9/10 Extreme 7 d/yr ≥108°F today · 21 d/yr by 30 yrs out
- Wind 9/10 Extreme 99% chance of damaging wind over 30 yrs
- Air quality 1/10 Low 0 unhealthy d/yr today · 0 by 30 yrs out
Nearby sold comps map
Loading sold comps map…
Walkable amenities ~0.75 mi
Loading nearby amenities…
Taxation est. · year 1
- Rental income
- $28,466
- − Mortgage interest
- −$16,804
- − Property taxes
- −$2,652
- − Insurance
- −$1,500
- − Repairs & maintenance
- −$2,277
- − Management
- −$2,277
- − Depreciation
- −$8,727
- Taxable loss
- −$5,772
- Est. tax savings @ 24.0%
- +$1,385
- After-tax cash flow
- $843/yr
For passive investors: Depreciation is non-cash, so a rental often shows a tax loss while cash-flowing — sheltering income. Rental losses are passive: they offset passive income freely, and up to $25,000/yr can offset ordinary (W-2) income if you actively participate and your MAGI is under $100k (phasing out to $0 by $150k); unused losses carry forward. On sale, claimed depreciation is recaptured at up to 25%, and gains may owe capital-gains tax (a 1031 exchange can defer both). Figures are a year-1 estimate at your 24.0% rate — not tax advice; consult a CPA.
Schools (NCES district)
- District
- Orange
- NCES district ID
- 1201440
- Math proficiency
- 46% ▼ -9.00%
- Reading proficiency
- 51% ▼ -2.00%
- Median HH income
- $49,350
- Composite
- 41.47/100
- National rank
- #3461
- State rank
- #43 of 73 in FL
Livability — Taft
- Score
- 74/100
- State rank
- #275
- US rank
- #4431
Category grades
Schools grade is shown separately in the Schools card above.
Census & demographics
- Census place
- Taft, FL
- County
- Orange County · 1,471,359 people
- Metro
- Orlando-Kissimmee-Sanford, FL
- Population (ZIP)
- 58,368
- Household income
- $84,841
- Rent vs Own
- Severe rent burden
- 1015.0
Population outlook (Orange County) Hauer SSP2
- Today (2025)
- 1,618,226 people
- By 2030
- 1,787,404 · +10.5%
- By 2040
- 2,125,621 · +31.4%
- By 2050
- 2,454,016 · +51.6%
- By 2075
- 3,173,711 · +96.1%
- By 2100
- 3,607,781 · +122.9%
Race, ethnicity, and origin ACS 2023
- Neighborhood character
- Diverse neighborhood (Simpson 0.57)
- Race & ethnicity
- Hispanic / Latino 62% Two or more races 34% White 15% Black 13% Asian 6%
- Hispanic origin (detail)
- Mexican 2% Puerto Rican 26% Cuban 2% Dominican 6%
- Common ancestry
- Romanian 1% Hispanic 1% Russian 1%
- Foreign-born
- 32% · Canada, Jamaica, Vietnam
- Languages at home
- 36% English-only · Spanish 54% Other Indo-European 3% French/Haitian/Cajun 2%
Political lean MEDSL · Orange
- 2024 margin
- D (+13.6) · D 56.1% · R 42.5% · Other 1.3%
- 2008→2024 swing
- -5.0pp toward R · 2008: 18.6pp · 2024: 13.6pp
- All cycles
- 2024: D+13.6 2020: D+23.1 2016: D+24.6 2012: D+18.2 2008: D+18.6
Not yet ingested
- Civics
- —
Market trends
- HPI YoY
- ▼ -165.20%
- Current HPI
- 280.977
- Rent YoY
- ▼ -0.21%
- Metro
- Orlando-Kissimmee-Sanford, FL
- State GDP YoY
- ▲ 3.28%
- F500 in state
- 36
Industry mix (Fortune 500 HQ in FL)
| Industry | F500 HQs | Revenue |
|---|---|---|
| Industrial Technology | 2 | $29B |
|
||
| Insurance | 2 | $17B |
|
||
| Retail | 1 | $60B |
|
||
| Technology Distribution | 1 | $58B |
|
||
| Homebuilding | 1 | $35B |
|
||
| Technology Manufacturing | 1 | $35B |
|
||
Price history
+87.6% since first listed5 events — show timeline
- 2026-05-13 Listed $299,990 Stellar MLS as Distributed by MLS Grid
- 2022-12-05 Sold (Public Records) $115,000 Public Records
- 2011-08-26 Sold (MLS) $23,000 Stellar MLS as Distributed by MLS Grid
- 2011-02-04 Listed $24,900 Stellar MLS as Distributed by MLS Grid
- 2007-06-19 Listed $159,900 Stellar MLS as Distributed by MLS Grid
Property tax history
+10.6%/yrLatest (2025): $2,652 · +16.5% YoY. Source: county tax records.
Cash-flow waterfall
monthlySold comps — $/sqft
last 12 mo · ≤1 miLoading sold comps…