 🌊 Lakefront
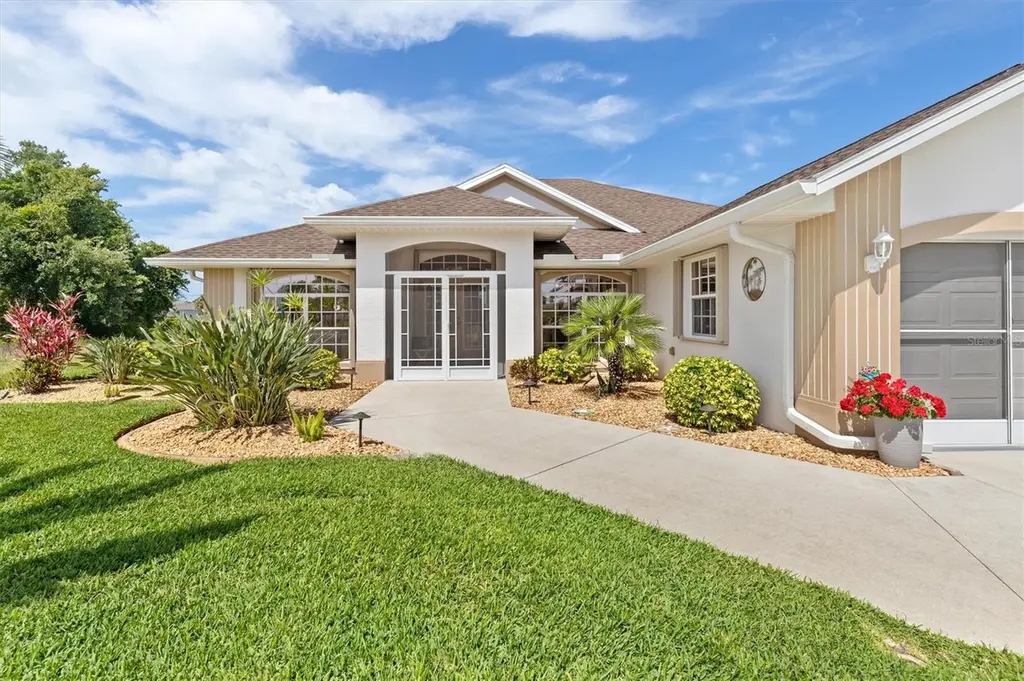
176 Mariner Ln · Rotonda, FL
Flood risk 6/10 · Moderate
- FEMA flood zone
- X (shaded)
- Chance of flooding over 30 yrs
- 0.57%
- Est. flood insurance / yr
- $507 – $1,088
Fire risk 3/10 · Minor
- Est. fire insurance / yr
- $947 – $1,759
Heat risk 10/10 · Severe
- Hot days now (above 107°F)
- 7 days/yr
- Hot days in 30 yrs
- 28 days/yr
Wind risk 10/10 · Severe
- Chance of severe wind over 30 yrs
- 99.0%
Air-quality risk 2/10 · Minimal
- Unhealthy air days now
- 1 days/yr
- Unhealthy air days in 30 yrs
- 1 days/yr
Risk factors via First Street. Map © Google.
Why this score? — see what drove the F grade
The composite is a weighted blend of 9 inputs, each scored 0–100. Each bar is that input's sub-score; the figure is the points it added to the 100-point composite (weight × sub-score).
- Cash flow +9.4/30.0
- Appreciation +5.6/10.0
- Schools +4.6/10.0
- Livability +3.4/5.0
- DSCR +2.6/10.0
- Condition / age +2.5/5.0
- Rent growth +2.4/5.0
- 1% rule +2.1/10.0
- ARV discount +1.5/15.0
$447,900
🖨 Deal sheet 📄 Offer letter ✓ Due diligence
Listing remarks MLS
Lovely 3/3/2 home with heated pool. Oversized lanai over looks freshwater canal. Tastefully furnished and waiting your arrival.
Key facts
- New pool cage
- Updated pool
- Hurricane shutters
Tags
Property features AI
Finance
- Other: Homestead exempt; Living area reported as approximately 1,830 square feet (estimated)
- Financial info: Lease restrictions apply
- HOA & community: Homeowners association (annual fee $190; monthly approx. $15.83) - association approval required; Pets allowed
Exterior
- Parking: Attached 2-car garage
- Utilities: Public water (canal/lake available for irrigation); Public sewer; Cable connected; Natural gas connected; Public utilities
- Home design: Single family residence; One-story; South-facing; Residential zoning (RSF5)
- Construction: Block construction; Shingle roof; Slab foundation; Built on one level
- Exterior features: Enclosed porch; Screened porch; Hurricane shutters; Private heated in-ground gunite pool with tile finish, solar heat and solar cover, and outside bath access; On freshwater canal with water access and approximately 50 feet of canal frontage; Asphalt road access
Interior
- Kitchen: Convection oven; Dishwasher; Garbage disposal; Microwave; Range; Refrigerator
- Bedrooms: 3 bedrooms
- Flooring: Carpet; Ceramic tile
- Bathrooms: 3 full bathrooms
- Heating & cooling: Electric heating; Central air conditioning
- Interior features: Ceiling fans; Eat-in kitchen; High ceilings; Open floorplan; Solid surface counters; Split bedroom floorplan; Walk-in closets; Window treatments
- Laundry & utility: Laundry room with inside washer/dryer connections; Dryer included
Neighborhood map
What this means for you Summary
Snapshot
- This is a 3-bed/3.0-bath single-family listed at $448k.
Deal economics
- At list price, monthly cash flow is $-321 ($-4k/yr) — negative.
- To cash-flow at today's rent, offer at most $391k (12.7% below list).
- To meet the 1% rule (rent ≥ 1% of price), the offer needs to be $317k (29.2% below list).
- Recommended offer: $317k (29.2% below list) — sets the bar for 1% rule.
- Cap rate 5.4% vs local median 3.1% in Rotonda — top-decile yield for the area; either an underpriced asset or a hidden risk that comps aren't pricing in. Stress-test before assuming the spread holds.
Location & tenants
- Location reads 67/100 on livability (#548 in FL) — a middle-class / working-renter tenant base. Strengths: crime A+, housing A-, cost of living B+; Watch: schools D, amenities F, commute F.
- Charlotte (suburban): math 54% / reading 54% proficiency, ranked #22 of 73 in FL (top 30%) — acceptable for families but not a draw, mixed tenant base, ~2y average lease.
- Market conditions: Rents soft (-0.2%/yr); 863 active listings in the ZIP; 33 comparable units currently listed for rent nearby; rentals at typical pace (median 21d on market — plan ~3-4 weeks tenant-placement turnaround); solid renter incomes; 4,585 units permitted in Charlotte County in 2024 (703 in 5+ unit buildings).
- At $3,173/mo this rent would consume 48% of the median local household income ($80k/yr) (locally 91% of renters already pay >50% of income on rent) — very limited rent-growth headroom before tenants either downsize or default.
Forward outlook
- In year one you build about $9k of equity ($3k loan paydown + $6k appreciation (1.2% local appreciation)).
- Charlotte County population projected at +24% by 2050 — long-run rental-demand tailwind backs the buy-and-hold thesis.
- By year 4, paydown + projected appreciation supports a ~$31k cash-out refi (75% LTV) — recoverable capital for the next deal without selling this one.
Negotiation context
- It's been on market 60 days — a 3% lower offer ($434k) is reasonable based on typical stale-listing flexibility.
- 3 sale attempts since 20y ago with the ask held roughly flat each time — persistent listings suggest the price (not the market) is what's stuck; bring a comps-based counter.
- Current owner paid $220k; list at $448k implies a 104% gain — meaningful room to come down on a strong offer.
Risks & watch-outs
- Climate carrying-cost: major flood risk; severe wind risk, 99% chance of damaging wind over 30y; extreme-heat days projected 7→28/yr by 2055 (HVAC capex compounding) — expect insurance premiums to compound above CPI over the hold.
Questions for the listing agent
- What do current leases actually rent for vs. the listed asking? Can we see a recent rent roll and the last 12 months of T-12 income?
- It's been on market 60 days. Have you received any prior offers? Is the seller open to a 29% concession, seller financing, or rate buy-down credit?
- What does the HOA fee cover, when was the last increase, and are there any pending special assessments or reserve-fund shortfalls?
- Is there a deadline driving the sale (1031 exchange, divorce, estate, relocation)? That informs how much negotiation room exists.
- Schools are D-rated, which usually means shorter tenancies and higher turnover. Who's the typical renter profile here, and what's been the actual vacancy rate?
- The area grade is low — what's the realistic commute time and amenity access for the typical tenant pool here? Any planned neighborhood developments (good or bad) we should know about?
- This sits on a lake — are riparian / water-frontage rights deeded with the parcel? Any dock permits, shoreline easements, or HOA water-use restrictions?
- What's the documented flood / surge / shoreline-erosion history here (FEMA AND non-FEMA — e.g., storm surge, creek backup, septic-field saturation)?
- Any water-quality or seasonal algae-bloom issues that affect tenant satisfaction or short-term-rental demand?
- What's the average days-on-market for RENTAL listings here right now (not sales)? A rising rental-DOM trend means longer vacancies and softer asking-rent achievability than the comps imply.
- What's the recent tenant-quality profile in this submarket — average credit score on applications, eviction rate, late-payment / NSF rate, and stable-employment percentage? A property-management company in the area should have these aggregated.
- How much new for-sale + rental construction is in the pipeline within 1–3 miles? Heavy new supply typically softens prices + rents 12–24 months out; constrained supply supports both.
Investment metrics
- 1% rule
- 0.71% ✗
- Cap rate
- 5.43%
- Cash-on-cash
- -3.07%
- DSCR
- 0.86
- GRM
- 11.8
CMA / ARV
- ARV (on-the-fly)
- $395,280
- Comps found
- 12
Show comp detail 12 sales within ~0.75 mi
| Address | Dist | Beds/Ba | Sqft | Sold | Price | $/sf | Match |
|---|---|---|---|---|---|---|---|
| 7 Sportsman Ter | 0.41mi | 3/2.5 | 1,776 (-3%) | 1mo | $405,000 | $228 | 73 |
| 74 Broadmoor Ln | 0.40mi | 3/2.0 | 1,866 (+2%) | 2mo | $425,000 | $228 | 72 |
| 181 Broadmoor Ln | 0.52mi | 3/2.0 | 1,885 (+3%) | 3mo | $350,000 | $186 | 64 |
| 137 Mariner Ln | 0.26mi | 3/2.0 | 2,027 (+11%) | 4mo | $365,900 | $181 | 63 |
| 78 Broadmoor Ln | 0.37mi | 3/2.0 | 1,706 (-7%) | 8mo | $610,370 | $358 | 61 |
| 251 Rotonda Blvd N | 0.60mi | 3/2.0 | 1,906 (+4%) | 1mo | $401,000 | $210 | 60 |
| 188 Broadmoor Ln | 0.53mi | 3/2.0 | 1,910 (+4%) | 5mo | $390,000 | $204 | 60 |
| 158 Mark Twain Ln | 0.42mi | 3/2.0 | 1,670 (-9%) | 5mo | $359,000 | $215 | 58 |
| 101 Fairway Rd | 0.31mi | 3/2.5 | 2,085 (+14%) | 8mo | $450,000 | $216 | 54 |
| 36 Pinehurst Ct | 0.69mi | 3/2.0 | 1,720 (-6%) | 2mo | $390,000 | $227 | 52 |
| 209 Mark Twain Ln | 0.47mi | 3/2.0 | 1,588 (-13%) | 4mo | $306,100 | $193 | 48 |
| 35 Sportsman Pl | 0.55mi | 3/2.5 | 1,615 (-12%) | 7mo | $380,000 | $235 | 47 |
Match score weights: distance 35% · size 25% · config 20% · recency 20%. Top-matched comps best support the ARV.
Projected returns pro-forma
1.25% appreciation · 0.0% rent growth · sell at horizon
- IRR
- -2.5%
- Equity multiple
- 0.87×
- Total profit
- $-15,963
- Equity at exit
- $158,761
- IRR
- 1.0%
- Equity multiple
- 1.11×
- Total profit
- $14,345
- Equity at exit
- $215,583
Cash invested: $125,412 (down + closing). Projections, not guarantees.
Landlord ↔ Tenant lean methodology
- Overall (STATE)
- 87 Strongly Landlord-Friendly
- State Florida
- 87 Strongly Landlord-Friendly · R+3
- County
- — inherits STATE
- City
- — inherits STATE
ZIP-level market 33947
- Home prices YoY
- 0.4%
- Rents YoY
- -0.2%
- Active inventory
- 863
- Price-to-rent
- 11.8×
Monthly cashflow live
- Estimated rent
- $3,173 high interval (Pro) →
- Mortgage (P&I)
- −$2,349
- Tax from tax record
- −$277 /mo · $3,321/yr
- Insurance
- −$187
- HOA
- −$15
- Vacancy / Maint / Mgmt
- −$666
- Net cashflow
- $-321
Break-even live
UW: 25.0% down · 7.5% · 30yr · 1.5% tax · 5.0% vac · 8.0% maint · 8.0% mgmt
Financing live
Cash to close
- Down payment
- $111,975
- Closing costs
- $13,437
- Reserves months
- —
- Total cash needed
- —
Loan-product check · same deal, 3 products live
Conventional
25% down · 7.5% · 30yr
- Down + closing
- —
- Monthly P&I
- —
- Monthly cashflow
- —
- DSCR
- —
- Eligible?
- —
Personal DTI + credit; lowest rate.
DSCR
20% down · 8.5% · 30yr
- Down + closing
- —
- Monthly P&I
- —
- Monthly cashflow
- —
- DSCR
- —
- Eligible?
- —
No personal income docs; deal must DSCR.
Hard money
10% down · 12.0% · 12mo
- Down + closing
- —
- Monthly P&I
- —
- Monthly cashflow
- —
- DSCR
- —
- Eligible?
- —
Short-term bridge; refi at stabilization.
Rent comps 33 comps
| Address | Beds | Baths | Sqft | Rent | $/sqft | DOM | Units | Dist |
|---|---|---|---|---|---|---|---|---|
| 12 Broadmoor Rd Unit 1 Rotonda West, FL | 3.0 | 2.0 | 2065 | $3,500 | $1.69 | 20d | 1 | 0.34mi |
| 80 Mariner Ln Rotonda West, FL | 3.0 | 2.0 | 2052 | $4,800 | $2.34 | 20d | 1 | 0.46mi |
| 181 Bunker Rd Rotonda West, FL | 2.0 | 2.0 | 1355 | $4,600 | $3.39 | 20d | 1 | 0.52mi |
| 65 Fairway Rd Rotonda West, FL | 3.0 | 2.0 | 1865 | $2,700 | $1.45 | 20d | 1 | 0.53mi |
| 123 Marker Rd Rotonda West, FL | 3.0 | 2.0 | 2006 | $2,400 | $1.20 | 13d | 1 | 0.60mi |
| 30 Pinehurst Pl Rotonda West, FL | 3.0 | 3.0 | 2461 | $3,900 | $1.58 | 20d | 1 | 0.63mi |
| 155 Long Meadow Ln Rotonda West, FL | 3.0 | 2.0 | 1598 | $4,500 | $2.82 | 20d | 1 | 0.67mi |
| 36 Bunker Cir Rotonda West, FL | 2.0 | 2.0 | 1533 | $3,999 | $2.61 | 20d | 1 | 0.77mi |
| 72 Long Meadow Ln Rotonda West, FL | 3.0 | 2.0 | 1945 | $1,920 | $0.99 | 13d | 1 | 0.77mi |
| 25 Fairway Rd Rotonda West, FL | 3.0 | 2.0 | 2068 | $2,375 | $1.15 | 20d | 1 | 0.81mi |
| 22 Mariner Ln Rotonda West, FL | 3.0 | 2.0 | 2015 | $4,200 | $2.08 | 20d | 1 | 0.85mi |
| 87 Mark Twain Ln Rotonda West, FL | 3.0 | 2.0 | 1235 | $2,500 | $2.02 | 20d | 1 | 0.85mi |
| 127 White Marsh Ln Rotonda West, FL | 3.0 | 2.0 | 2216 | $2,700 | $1.22 | 20d | 1 | 0.87mi |
| 72 Long Meadow Ct Rotonda West, FL | 3.0 | 2.0 | 1570 | $5,200 | $3.31 | 20d | 1 | 0.89mi |
| 527 Rotonda Cir Rotonda West, FL | 3.0 | 2.0 | 1586 | $2,375 | $1.50 | 20d | 1 | 0.90mi |
| 118 Caddy Rd Rotonda West, FL | 3.0 | 2.0 | 1828 | $2,795 | $1.53 | 20d | 1 | 0.95mi |
| 285 Mark Twain Ln Rotonda West, FL | 3.0 | 2.0 | 1759 | $1,750 | $0.99 | 20d | 1 | 0.96mi |
| 589 Rotonda Cir Rotonda West, FL | 3.0 | 2.5 | 2190 | $4,200 | $1.92 | 20d | 1 | 0.96mi |
| 613 Boundary Blvd Rotonda West, FL | 3.0 | 2.0 | 2469 | $2,900 | $1.17 | 20d | 1 | 1.07mi |
| 230 Annapolis Ln Rotonda West, FL | 3.0 | 2.0 | 1768 | $1,800 | $1.02 | 20d | 1 | 1.09mi |
| 114 Albatross Rd Rotonda West, FL | 3.0 | 2.0 | 1648 | $5,300 | $3.22 | 20d | 1 | 1.10mi |
| 239 Annapolis Ln Rotonda West, FL | 3.0 | 2.0 | 1747 | $2,000 | $1.14 | 20d | 1 | 1.12mi |
| 42 Mark Twain Ln Rotonda West, FL | 3.0 | 2.5 | 1677 | $2,800 | $1.67 | 20d | 1 | 1.14mi |
| 107 Cottage Pl Rotonda West, FL | 3.0 | 2.0 | 1397 | $5,000 | $3.58 | 20d | 1 | 1.18mi |
| 65 Oakland Hills Pl Rotonda West, FL | 2.0 | 2.0 | 1444 | $4,500 | $3.12 | 20d | 1 | 1.18mi |
| 686 Boundary Blvd Rotonda West, FL | 3.0 | 2.5 | 2282 | $2,800 | $1.23 | 20d | 1 | 1.19mi |
| 48 Par View Ct Rotonda West, FL | 3.0 | 2.0 | 2000 | $3,500 | $1.75 | 20d | 1 | 1.21mi |
| 511 Sweetwater Dr Rotonda West, FL | 4.0 | 2.5 | 2160 | $2,200 | $1.02 | 20d | 1 | 1.33mi |
| 37 Oakland Hills Pl Rotonda West, FL | 3.0 | 2.0 | 1321 | $4,000 | $3.03 | 20d | 1 | 1.34mi |
| 60 Golfview Rd Rotonda West, FL | 3.0 | 2.0 | 1336 | $5,550 | $4.15 | 20d | 1 | 1.35mi |
| 64 Golfview Rd Rotonda West, FL | 4.0 | 2.0 | 1697 | $1,795 | $1.06 | 13d | 1 | 1.38mi |
| 45 Oakland Hills Ct Rotonda West, FL | 4.0 | 2.0 | 1536 | $2,700 | $1.76 | 20d | 1 | 1.44mi |
| 138 Jade St Rotonda West, FL | 3.0 | 2.0 | 1564 | $1,869 | $1.20 | 20d | 1 | 1.50mi |
HOA detail
- Monthly dues
- $15 · $180/yr
- Likely covers
- waterpool
Listing history 24 events
-
2026-06-18days on market $447,900 Active 60 DOM
-
2026-06-17days on market $447,900 Active 59 DOM
-
2026-06-16days on market $447,900 Active 58 DOM
-
2026-06-15days on market $447,900 Active 57 DOM
-
2026-06-14days on market $447,900 Active 55 DOM
-
2026-06-13days on market $447,900 Active 54 DOM
-
2026-06-10days on market $447,900 Active 52 DOM
-
2026-06-09days on market $447,900 Active 51 DOM
-
2026-06-08days on market $447,900 Active 50 DOM
-
2026-06-07days on market $447,900 Active 49 DOM
-
2026-06-05days on market $447,900 Active 46 DOM
-
2026-06-03days on market $447,900 Active 45 DOM
-
2026-06-02days on market $447,900 Active 44 DOM
-
2026-06-01days on market $447,900 Active 43 DOM
-
2026-05-31days on market $447,900 Active 42 DOM
-
2026-05-30days on market $447,900 Active 41 DOM
-
2026-05-07price $447,900
-
2026-05-07price $4,447,900
-
2026-04-19$465,000 Active
-
2009-08-31soldstatus $220,000
-
2009-08-28soldstatus $220,000 127-char remark
Show marketing remark (127 chars)
Lovely 3/3/2 home with heated pool. Oversized lanai over looks freshwater canal. Tastefully furnished and waiting your arrival.
-
2009-05-06$239,000 127-char remark
Show marketing remark (127 chars)
Lovely 3/3/2 home with heated pool. Oversized lanai over looks freshwater canal. Tastefully furnished and waiting your arrival.
-
2007-05-20historical
-
2006-04-14$329,900
ⓘ Source: listings_history table (triggers on properties + properties_extension) + one-shot
backfill from property_details.listing_events for pre-trigger history.
Tax reassessment forecast FL · Resets to sale price
- Current annual tax
- $3,321 · $277/mo
- Projected year-2 tax
- $3,718 · $310/mo
- Expected delta
- +$396/yr (+$33/mo · 11.9%)
ⓘ Screening estimate from a state-policy table — verify with the county assessor before closing.
Climate risk First Street
- Flood 6/10 Major FEMA zone X (shaded) · 57% chance over 30 yrs
- Wildfire 3/10 Moderate
- Heat 10/10 Extreme 7 d/yr ≥107°F today · 28 d/yr by 30 yrs out
- Wind 10/10 Extreme 99% chance of damaging wind over 30 yrs
- Air quality 2/10 Low 1 unhealthy d/yr today · 1 by 30 yrs out
Nearby sold comps map
Loading sold comps map…
Walkable amenities ~0.75 mi
Loading nearby amenities…
Taxation est. · year 1
- Rental income
- $38,073
- − Mortgage interest
- −$25,089
- − Property taxes
- −$3,321
- − Insurance
- −$2,240
- − Repairs & maintenance
- −$3,046
- − Management
- −$3,046
- − HOA
- −$180
- − Depreciation
- −$13,030
- Taxable loss
- −$11,878
- Est. tax savings @ 24.0%
- +$2,851
- After-tax cash flow
- $-998/yr
For passive investors: Depreciation is non-cash, so a rental often shows a tax loss while cash-flowing — sheltering income. Rental losses are passive: they offset passive income freely, and up to $25,000/yr can offset ordinary (W-2) income if you actively participate and your MAGI is under $100k (phasing out to $0 by $150k); unused losses carry forward. On sale, claimed depreciation is recaptured at up to 25%, and gains may owe capital-gains tax (a 1031 exchange can defer both). Figures are a year-1 estimate at your 24.0% rate — not tax advice; consult a CPA.
Schools (NCES district)
- District
- Charlotte
- NCES district ID
- 1200240
- Math proficiency
- 54% ▼ -6.00%
- Reading proficiency
- 54% ▼ -1.00%
- Median HH income
- $44,864
- Composite
- 45.62/100
- National rank
- #2586
- State rank
- #22 of 73 in FL
Livability — Rotonda
- Score
- 67/100
- State rank
- #548
- US rank
- #10359
Category grades
Schools grade is shown separately in the Schools card above.
Census & demographics
- Census place
- Rotonda, FL
- County
- Charlotte County · 196,994 people
- City population
- 10,490
- Metro
- Punta Gorda, FL
- Population (ZIP)
- 10,447
- Household income
- $80,091
- Rent vs Own
- Severe rent burden
- 91.0
Population outlook (Charlotte County) Hauer SSP2
- Today (2025)
- 198,646 people
- By 2030
- 210,507 · +6.0%
- By 2040
- 230,857 · +16.2%
- By 2050
- 247,148 · +24.4%
- By 2075
- 281,777 · +41.8%
- By 2100
- 293,609 · +47.8%
Race, ethnicity, and origin ACS 2023
- Neighborhood character
- Predominantly White (96%)
- Race & ethnicity
- White 96% Hispanic / Latino 2% Two or more races 2%
- Common ancestry
- Romanian 5% Lithuanian 4% Slovak 4%
- Foreign-born
- 8% · Canada, Vietnam
- Languages at home
- 93% English-only · Russian/Polish/Slavic 3% Spanish 2% German/W. Germanic 1%
Political lean MEDSL · Charlotte
- 2024 margin
- Solid R (+34.0) · D 32.7% · R 66.7%
- 2008→2024 swing
- -26.7pp toward R · 2008: -7.2pp · 2024: -34.0pp
- All cycles
- 2024: R+34.0 2020: R+26.6 2016: R+27.8 2012: R+14.3 2008: R+7.2
Not yet ingested
- Civics
- —
Market trends
- HPI YoY
- ▲ 1.25%
- Current HPI
- 311.3231
- Rent YoY
- ▼ -0.22%
- Metro
- Punta Gorda, FL
- State GDP YoY
- ▲ 3.28%
- F500 in state
- 36
Industry mix (Fortune 500 HQ in FL)
| Industry | F500 HQs | Revenue |
|---|---|---|
| Industrial Technology | 2 | $29B |
|
||
| Insurance | 2 | $17B |
|
||
| Retail | 1 | $60B |
|
||
| Technology Distribution | 1 | $58B |
|
||
| Homebuilding | 1 | $35B |
|
||
| Technology Manufacturing | 1 | $35B |
|
||
Price history
+35.8% since first listed8 events — show timeline
- 2026-05-07 Price Changed $447,900 Stellar MLS as Distributed by MLS Grid
- 2026-05-07 Price Changed $4,447,900 Stellar MLS as Distributed by MLS Grid
- 2026-04-19 Listed $465,000 Stellar MLS as Distributed by MLS Grid
- 2009-08-31 Sold (Public Records) $220,000 Public Records
- 2009-08-28 Sold (MLS) $220,000 Stellar MLS as Distributed by MLS Grid
- 2009-05-06 Listed $239,000 Stellar MLS as Distributed by MLS Grid
- 2007-05-20 Listing Removed — Stellar MLS as Distributed by MLS Grid
- 2006-04-14 Listed $329,900 Stellar MLS as Distributed by MLS Grid
Property tax history
+3.2%/yrLatest (2025): $3,321 · +3.3% YoY. Source: county tax records.
Cash-flow waterfall
monthlySold comps — $/sqft
last 12 mo · ≤1 miLoading sold comps…