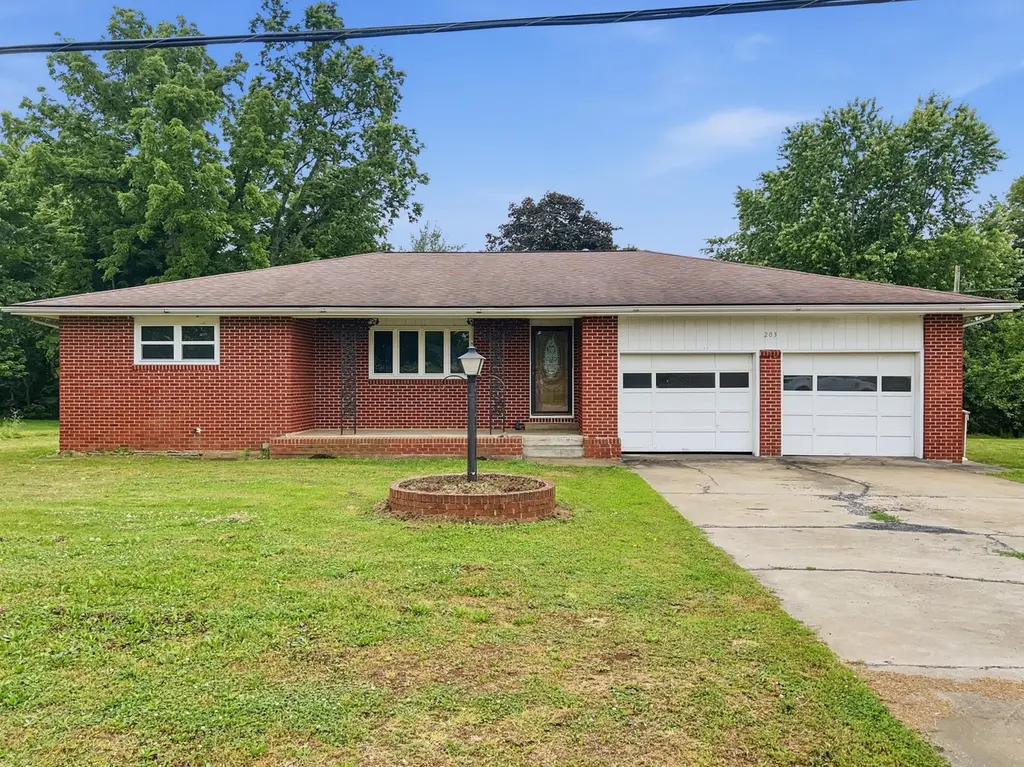
203 E College St · Ash Grove, MO
Flood risk 1/10 · Minimal
- FEMA flood zone
- X (unshaded)
- Chance of flooding over 30 yrs
- 0.0%
- Est. flood insurance / yr
- $507 – $1,088
Fire risk 3/10 · Minor
- Est. fire insurance / yr
- $1,054 – $1,958
Heat risk 5/10 · Moderate
- Hot days now (above 106°F)
- 7 days/yr
- Hot days in 30 yrs
- 20 days/yr
Wind risk 2/10 · Minimal
- Chance of severe wind over 30 yrs
- 2.0%
Air-quality risk 2/10 · Minimal
- Unhealthy air days now
- 1 days/yr
- Unhealthy air days in 30 yrs
- 1 days/yr
Risk factors via First Street. Map © Google.
Why this score? — see what drove the B+ grade
The composite is a weighted blend of 9 inputs, each scored 0–100. Each bar is that input's sub-score; the figure is the points it added to the 100-point composite (weight × sub-score).
- Cash flow +30.0/30.0
- ARV discount +14.1/15.0
- 1% rule +10.0/10.0
- DSCR +10.0/10.0
- Schools +3.5/10.0
- Livability +3.1/5.0
- Rent growth +2.5/5.0
- Condition / age +2.5/5.0
- Appreciation +0.0/10.0
$168,900
🖨 Deal sheet 📄 Offer letter ✓ Due diligence
Listing remarks
Classic 1960's all- brick ranch on a 1 acre lot with a partiial basement in Ash Grove needs some updating. This 1785 (m/l) sqare foot home has 3 bedrooms 2 large bathrooms, and lots of built-in storage and a storage shed. This home has a 2-car attached garage with a pole barn on a concrete pad sitting on an L-shaped 1 acre lot in the city limits of Ash Grove just one block from Hwy 160 and the Muncy's Supermarket. Heat Pump is approx 2-3 years old. Call your realtor today to view this all brick home with a partial basement and an aceesibiity ramp.
Key facts
- Built in storage
- Pole barn
- Attached garage
Tags
Property features AI
Finance
- Other: Lot approximately 1.01 acres; Road surface: asphalt and concrete; Publicly maintained road
Exterior
- Parking: 2-car garage; Driveway; Paved parking; Garage door opener
- Utilities: Public water; Public sewer
- Home design: Single-family residence; One level; Accessible entrance with ramp; Irregular lot shape; City street frontage
- Construction: Frame and brick construction; Composition roof; Block foundation; Built on one level
- Exterior features: Rain gutters; Covered front porch and patio; Storm door(s); Wire fencing; Shed(s) / outbuilding
Interior
- Kitchen: Electric oven; Free-standing electric oven; Dishwasher
- Flooring: Carpet; Tile; Hardwood
- Bathrooms: 2 full bathrooms
- Heating & cooling: Heat pump heating and cooling; Electric heating
- Interior features: Laminate countertops; Insulated double-pane windows; Water softener (owned); Disposal
- Laundry & utility: Laundry in basement; Electric water heater
Neighborhood map
What this means for you Summary
Snapshot
- This is a 3-bed/1.5-bath single-family listed at $169k.
Deal economics
- At list price, monthly cash flow is $949 ($11k/yr) — positive.
- The deal already cash-flows at list — no discount required.
- Meets the 1% rule at list price ($3k rent vs $169k).
- Cap rate 13.0% vs local median 5.4% in Ash Grove — top-decile yield for the area; either an underpriced asset or a hidden risk that comps aren't pricing in. Stress-test before assuming the spread holds.
Location & tenants
- Location reads 61/100 on livability (#435 in MO) — a middle-class / working-renter tenant base. Strengths: cost of living A+, housing A+; Watch: crime C-, amenities F, commute F.
- Ash Grove R-IV (rural): math 33% / reading 50% proficiency, ranked #121 of 324 in MO (top 37%) — families likely to look elsewhere, expect single-tenant / working-renter base with shorter leases.
- Zoned schools: Ash Grove Elem. (math 34% / reading 44%, grade F, #537 of 1,115 statewide, top 53%, 259 students, 47% FRL); Ash Grove High (math 22% / reading 52%, grade F, #291 of 521 statewide, top 60%, 329 students, 37% FRL).
- Market conditions: 60 active listings in the ZIP; 1 comparable units currently listed for rent nearby; 1,302 units permitted in Greene County in 2024 (250 in 5+ unit buildings).
Forward outlook
- Local home prices are declining (-3.0%/yr); year-one equity from $1k of loan paydown is wiped out by about $5k of value loss. Plan a longer hold.
- Greene County population projected at +25% by 2050 — long-run rental-demand tailwind backs the buy-and-hold thesis.
- At projected returns (-3.0% appreciation + 3.0% rent growth), your $47k cash investment doubles in ~6 years — after that, you're playing with house money.
Negotiation context
- Only 7 days on market — expect competitive offers; lowballing is unlikely to land.
Risks & watch-outs
- Climate carrying-cost: extreme-heat days projected 7→20/yr by 2055 (HVAC capex compounding) — expect insurance premiums to compound above CPI over the hold.
Questions for the listing agent
- Built in 1967 — when were the roof, HVAC, electrical panel, plumbing, and water heater last replaced?
- Is there a deadline driving the sale (1031 exchange, divorce, estate, relocation)? That informs how much negotiation room exists.
- What's the average days-on-market for RENTAL listings here right now (not sales)? A rising rental-DOM trend means longer vacancies and softer asking-rent achievability than the comps imply.
- What's the recent tenant-quality profile in this submarket — average credit score on applications, eviction rate, late-payment / NSF rate, and stable-employment percentage? A property-management company in the area should have these aggregated.
- How much new for-sale + rental construction is in the pipeline within 1–3 miles? Heavy new supply typically softens prices + rents 12–24 months out; constrained supply supports both.
Investment metrics
- 1% rule
- 1.51% ✓
- Cap rate
- 13.04%
- Cash-on-cash
- 24.09%
- DSCR
- 2.07
- GRM
- 5.5
CMA / ARV
- ARV (on-the-fly)
- $197,810
- Comps found
- 12
Show comp detail 12 sales within ~0.75 mi
| Address | Dist | Beds/Ba | Sqft | Sold | Price | $/sf | Match |
|---|---|---|---|---|---|---|---|
| 206 N Webster Ave | 0.26mi | 4/2.0 (+1) | 1,500 (-1%) | 2mo | $109,900 | $73 | 78 |
| 106 W College St | 0.23mi | 3/2.0 | 1,549 (+3%) | 12mo | $198,500 | $128 | 73 |
| 206 E Cawlfield St | 0.22mi | 3/2.5 | 1,411 (-7%) | 6mo | $185,000 | $131 | 69 |
| 902 E Auburn Dr | 0.49mi | 3/2.0 | 1,515 (+0%) | 14mo | $249,900 | $165 | 63 |
| 606 E Prairie Ln | 0.52mi | 3/2.0 | 1,456 (-4%) | 8mo | $186,000 | $128 | 62 |
| 806 E Grant St | 0.71mi | 3/2.0 | 1,551 (+3%) | 3mo | $235,000 | $152 | 58 |
| 404 N Mcqueary Ave | 0.25mi | 3/2.0 | 1,723 (+14%) | 10mo | $239,900 | $139 | 54 |
| 600 W Cave St | 0.68mi | 2/1.0 (-1) | 1,426 (-6%) | 1mo | $59,900 | $42 | 51 |
| 103 Northview Ter | 0.33mi | 3/2.0 | 1,724 (+14%) | 11mo | $245,000 | $142 | 50 |
| 412 E Walker St | 0.43mi | 3/2.0 | 1,722 (+14%) | 6mo | $125,000 | $73 | 49 |
| 101 W Murray St | 0.70mi | 3/1.0 | 1,380 (-9%) | 12mo | $145,000 | $105 | 41 |
| 204 S Calhoun Ave | 0.65mi | 3/1.5 | 1,637 (+8%) | 19mo | $217,700 | $133 | 40 |
Match score weights: distance 35% · size 25% · config 20% · recency 20%. Top-matched comps best support the ARV.
Projected returns pro-forma
-3.0% appreciation · 3.0% rent growth · sell at horizon
- IRR
- 17.3%
- Equity multiple
- 1.70×
- Total profit
- $33,068
- Equity at exit
- $25,184
- IRR
- 25.8%
- Equity multiple
- 3.25×
- Total profit
- $106,551
- Equity at exit
- $14,603
Cash invested: $47,292 (down + closing). Projections, not guarantees.
Landlord ↔ Tenant lean methodology
- Overall (STATE)
- 81 Strongly Landlord-Friendly
- State Missouri
- 81 Strongly Landlord-Friendly · R+10
- County
- — inherits STATE
- City
- — inherits STATE
ZIP-level market 65604
- Home prices YoY
- -13.1%
- Active inventory
- 60
- Price-to-rent
- 5.5×
Monthly cashflow live
- Estimated rent
- $2,550 medium interval (Pro) →
- Mortgage (P&I)
- −$886
- Tax from tax record
- −$109 /mo · $1,309/yr
- Insurance
- −$70
- HOA
- −$0
- Vacancy / Maint / Mgmt
- −$536
- Net cashflow
- $949
Break-even live
UW: 25.0% down · 7.5% · 30yr · 1.5% tax · 5.0% vac · 8.0% maint · 8.0% mgmt
Financing live
Cash to close
- Down payment
- $42,225
- Closing costs
- $5,067
- Reserves months
- —
- Total cash needed
- —
Loan-product check · same deal, 3 products live
Conventional
25% down · 7.5% · 30yr
- Down + closing
- —
- Monthly P&I
- —
- Monthly cashflow
- —
- DSCR
- —
- Eligible?
- —
Personal DTI + credit; lowest rate.
DSCR
20% down · 8.5% · 30yr
- Down + closing
- —
- Monthly P&I
- —
- Monthly cashflow
- —
- DSCR
- —
- Eligible?
- —
No personal income docs; deal must DSCR.
Hard money
10% down · 12.0% · 12mo
- Down + closing
- —
- Monthly P&I
- —
- Monthly cashflow
- —
- DSCR
- —
- Eligible?
- —
Short-term bridge; refi at stabilization.
Rent comps 1 comps
| Address | Beds | Baths | Sqft | Rent | $/sqft | DOM | Units | Dist |
|---|---|---|---|---|---|---|---|---|
| 402 Coyote Pass Ash Grove, MO | 4.0 | 2.0 | 2157 | $2,550 | $1.18 | 13d | 1 | 0.42mi |
Listing history 1 events
-
2026-05-21$168,900 Active
ⓘ Source: listings_history table (triggers on properties + properties_extension) + one-shot
backfill from property_details.listing_events for pre-trigger history.
Tax reassessment forecast MO · Resets to sale price
- Current annual tax
- $1,309 · $109/mo
- Projected year-2 tax
- $1,638 · $137/mo
- Expected delta
- +$329/yr (+$27/mo · 25.1%)
ⓘ Screening estimate from a state-policy table — verify with the county assessor before closing.
Climate risk First Street
- Flood 1/10 Low FEMA zone X (unshaded) · 0% chance over 30 yrs
- Wildfire 3/10 Moderate
- Heat 5/10 Major 7 d/yr ≥106°F today · 20 d/yr by 30 yrs out
- Wind 2/10 Low 2% chance of damaging wind over 30 yrs
- Air quality 2/10 Low 1 unhealthy d/yr today · 1 by 30 yrs out
Nearby sold comps map
Loading sold comps map…
Walkable amenities ~0.75 mi
Loading nearby amenities…
Taxation est. · year 1
- Rental income
- $30,600
- − Mortgage interest
- −$9,461
- − Property taxes
- −$1,309
- − Insurance
- −$844
- − Repairs & maintenance
- −$2,448
- − Management
- −$2,448
- − Depreciation
- −$4,913
- Taxable income
- $9,176
- Est. tax owed @ 24.0%
- −$2,202
- After-tax cash flow
- $9,189/yr
For passive investors: Depreciation is non-cash, so a rental often shows a tax loss while cash-flowing — sheltering income. Rental losses are passive: they offset passive income freely, and up to $25,000/yr can offset ordinary (W-2) income if you actively participate and your MAGI is under $100k (phasing out to $0 by $150k); unused losses carry forward. On sale, claimed depreciation is recaptured at up to 25%, and gains may owe capital-gains tax (a 1031 exchange can defer both). Figures are a year-1 estimate at your 24.0% rate — not tax advice; consult a CPA.
Schools (NCES district)
- District
- Ash Grove R-IV
- NCES district ID
- 2903270
- Math proficiency
- 33% ▼ -7.00%
- Reading proficiency
- 50% ▲ 1.00%
- Median HH income
- $47,679
- Composite
- 35.45/100
- National rank
- #4929
- State rank
- #121 of 324 in MO
Livability — Ash Grove
- Score
- 61/100
- State rank
- #435
- US rank
- #17867
Category grades
Schools grade is shown separately in the Schools card above.
Census & demographics
- Census place
- Ash Grove, MO
- Population (ZIP)
- 3,909
Population outlook (Greene County) Hauer SSP2
- Today (2025)
- 319,054 people
- By 2030
- 335,135 · +5.0%
- By 2040
- 366,186 · +14.8%
- By 2050
- 397,431 · +24.6%
- By 2075
- 477,035 · +49.5%
- By 2100
- 520,828 · +63.2%
Race, ethnicity, and origin ACS 2023
- Neighborhood character
- Predominantly White (91%)
- Race & ethnicity
- White 91% Two or more races 7% Hispanic / Latino 5%
- Hispanic origin (detail)
- Mexican 3% Puerto Rican 2%
- Common ancestry
- Italian 2% Lithuanian 2% Romanian 2%
- Foreign-born
- 0%
- Languages at home
- 98% English-only · Spanish 2%
Political lean MEDSL · Greene
- 2024 margin
- Strong R (+20.8) · D 38.9% · R 59.7% · Other 1.4%
- 2008→2024 swing
- -5.0pp toward R · 2008: -15.8pp · 2024: -20.8pp
- All cycles
- 2024: R+20.8 2020: R+20.1 2016: R+27.4 2012: R+24.4 2008: R+15.8
Not yet ingested
- Civics
- —
Market trends
- HPI YoY
- ▼ -34.86%
- Current HPI
- 231.5643
- Rent YoY
- —
- Metro
- —
- State GDP YoY
- ▲ 1.84%
- F500 in state
- 20
Industry mix (Fortune 500 HQ in MO)
| Industry | F500 HQs | Revenue |
|---|---|---|
| Healthcare | 1 | $163B |
|
||
| Insurance | 1 | $21B |
|
||
| Industrial Technology | 1 | $17B |
|
||
| Retail | 1 | $16B |
|
||
| Industrial Distribution | 1 | $10B |
|
||
| Utilities | 1 | $9B |
|
||
Price history
1 event — show timeline
- 2026-05-21 Listed $168,900 SOMO
Property tax history
+3.8%/yrLatest (2025): $1,309 · +8.8% YoY. Source: county tax records.
Cash-flow waterfall
monthlySold comps — $/sqft
last 12 mo · ≤1 miLoading sold comps…