 🏗️ New Construction
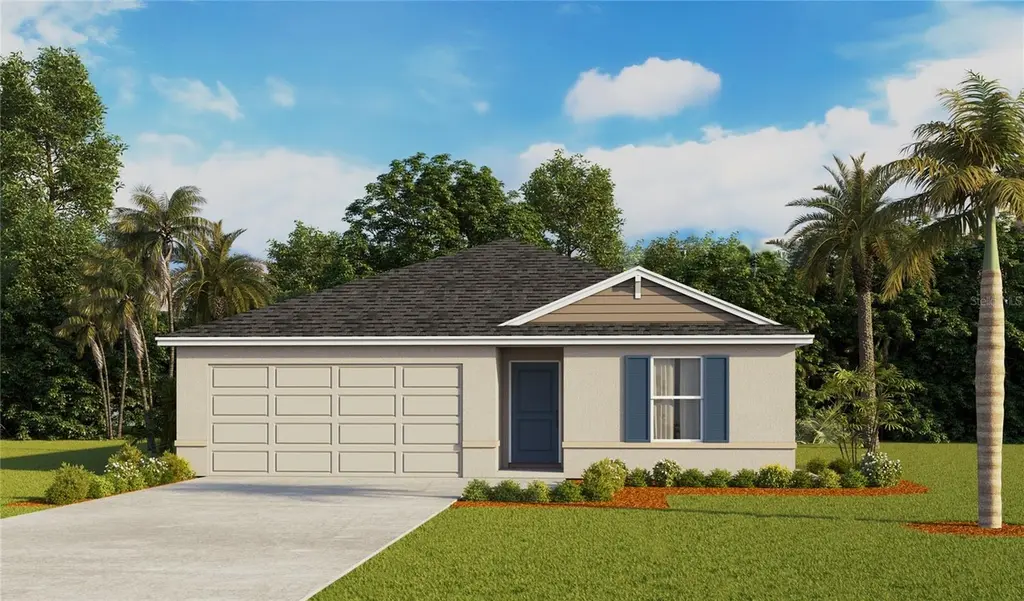
1116 Wild Clover Way · Plant City, FL
Flood risk No data
- FEMA flood zone
- —
- Chance of flooding over 30 yrs
- —
- Est. flood insurance / yr
- —
Fire risk No data
- Est. fire insurance / yr
- —
Heat risk No data
- Hot days now (above threshold)
- —
- Hot days in 30 yrs
- —
Wind risk No data
- Chance of severe wind over 30 yrs
- —
Air-quality risk No data
- Unhealthy air days now
- —
- Unhealthy air days in 30 yrs
- —
Risk factors via First Street. Map © Google.
Why this score? — see what drove the F grade
The composite is a weighted blend of 9 inputs, each scored 0–100. Each bar is that input's sub-score; the figure is the points it added to the 100-point composite (weight × sub-score).
- ARV discount +7.5/15.0
- Cash flow +6.8/30.0
- Schools +4.2/10.0
- Rent growth +3.8/5.0
- Livability +3.8/5.0
- Condition / age +2.5/5.0
- 1% rule +2.2/10.0
- DSCR +1.0/10.0
- Appreciation +0.0/10.0
$299,990
🖨 Deal sheet (PDF) 📄 Offer letter ✓ Due diligence
Listing remarks
One or more photo(s) has been virtually staged. Under Construction. Holloway Landing is new NO CDD Fees community in Plant City, Florida. Situated conveniently near major roads, which’s offers easy access to Tampa, Orlando, and Lakeland, making it an ideal location for commuters and families alike. Holloway Landing features a variety of single-family homes, each constructed with all concrete block on both the first and second stories, ensuring durability and peace of mind. Holloway landing has oversized homesites and the community does not have a CDD. Additionally, every home comes equipped with Smart Home System, providing residents with the latest in-home technology for enhanced con
Key facts
- No cdd fees
- Oversized homesites
- New community
Tags
Property features AI
Finance
- Other: Lot approximately 0.18 acres; Permit number 0326-01029; Zoned R-1
- HOA & community: HOA: Homeriver Group; Monthly HOA fee $112 (association approval required); Pets allowed
Exterior
- Parking: Attached garage with 2 spaces
- Utilities: Public water; Public sewer; Public utilities
- Home design: Single family residence; Under construction (projected completion: November 30, 2026); One-story home; South-facing
- Construction: Block and stucco construction; Shingle roof; Slab foundation; New construction by D.R. Horton (Builder model: Archer II)
- Exterior features: Irrigation equipment; Paved road access; Pool (other features)
Interior
- Kitchen: Dishwasher; Microwave; Range; Refrigerator; Solid surface countertops
- Bedrooms: 3 bedrooms (all on one level)
- Flooring: Carpet
- Bathrooms: 2 full bathrooms
- Heating & cooling: Electric heating; Central air conditioning
- Interior features: Open floorplan; Solid surface counters; Blinds; Double pane windows; Home warranty included
- Laundry & utility: Washer and dryer included; Laundry located inside
Neighborhood map
What this means for you Summary
Snapshot
- This is a 3-bed/2.0-bath land listed at $300k.
Deal economics
- At list price, monthly cash flow is $-470 ($-6k/yr) — negative.
- To cash-flow at today's rent, offer at most $232k (22.7% below list).
- To meet the 1% rule (rent ≥ 1% of price), the offer needs to be $217k (27.6% below list).
- Recommended offer: $217k (27.6% below list) — sets the bar for 1% rule.
Location & tenants
- Location reads 76/100 on livability (#227 in FL, #3,587 nationally) — a middle-class / working-renter tenant base. Strengths: amenities A+, cost of living A+, housing A+; Watch: employment C-, commute F.
- Hillsborough (suburban): math 47% / reading 50% proficiency, ranked #41 of 73 in FL (top 56%) — families likely to look elsewhere, expect single-tenant / working-renter base with shorter leases.
- Zoned schools: Springhead Elementary School (math 55% / reading 39%, grade D-, #1,191 of 2,144 statewide, top 57%, 735 students, 76% FRL); Marshall Middle Magnet School (math 28% / reading 31%, grade F, #469 of 571 statewide, top 84%, 1,089 students, 69% FRL); Plant City High School (math 38% / reading 40%, grade F, #312 of 667 statewide, top 48%, 2,474 students, 58% FRL) — zoned schools average 68% FRL vs 52% district-wide (16 pts higher); higher-poverty schools than district average — tighter screening recommended.
- Market conditions: Rents rising fast (+5.1%/yr); 166 active listings in the ZIP; 6 comparable units currently listed for rent nearby; rentals leasing fast (median 7d on market — plan ~1-2 weeks tenant-placement turnaround); 9,053 units permitted in Hillsborough County in 2024 (4,555 in 5+ unit buildings).
- This rent runs 36% of the median local income ($72k/yr) — at the standard rent-burdened threshold; future hikes will face affordability resistance.
Forward outlook
- Local home prices are declining (-3.0%/yr); year-one equity from $2k of loan paydown is wiped out by about $9k of value loss. Plan a longer hold.
- Hillsborough County population projected at +37% by 2050 — long-run rental-demand tailwind backs the buy-and-hold thesis.
Negotiation context
- It's been on market 21 days — a 2% lower offer ($295k) is reasonable based on typical stale-listing flexibility.
Questions for the listing agent
- What do current leases actually rent for vs. the listed asking? Can we see a recent rent roll and the last 12 months of T-12 income?
- What does the HOA fee cover, when was the last increase, and are there any pending special assessments or reserve-fund shortfalls?
- Is there a deadline driving the sale (1031 exchange, divorce, estate, relocation)? That informs how much negotiation room exists.
- Schools are D-rated, which usually means shorter tenancies and higher turnover. Who's the typical renter profile here, and what's been the actual vacancy rate?
- The area grade is low — what's the realistic commute time and amenity access for the typical tenant pool here? Any planned neighborhood developments (good or bad) we should know about?
- What's the average days-on-market for RENTAL listings here right now (not sales)? A rising rental-DOM trend means longer vacancies and softer asking-rent achievability than the comps imply.
- What's the recent tenant-quality profile in this submarket — average credit score on applications, eviction rate, late-payment / NSF rate, and stable-employment percentage? A property-management company in the area should have these aggregated.
- How much new for-sale + rental construction is in the pipeline within 1–3 miles? Heavy new supply typically softens prices + rents 12–24 months out; constrained supply supports both.
Investment metrics
- 1% rule
- 0.72% ✗
- Cap rate
- 4.41%
- Cash-on-cash
- -6.72%
- DSCR
- 0.70
- GRM
- 11.5
CMA / ARV
No comps found within radius.
Projected returns pro-forma
-3.0% appreciation · 5.09% rent growth · sell at horizon
- IRR
- -25.4%
- Equity multiple
- 0.12×
- Total profit
- $-73,815
- Equity at exit
- $44,729
- IRR
- -16.0%
- Equity multiple
- 0.02×
- Total profit
- $-82,494
- Equity at exit
- $25,938
Cash invested: $83,997 (down + closing). Projections, not guarantees.
Landlord ↔ Tenant lean methodology
- Overall (STATE)
- 87 Strongly Landlord-Friendly
- State Florida
- 87 Strongly Landlord-Friendly · R+3
- County
- — inherits STATE
- City
- — inherits STATE
ZIP-level market 33566
- Home prices YoY
- -18.9%
- Rents YoY
- 5.1%
- Active inventory
- 166
- Price-to-rent
- 11.5×
Monthly cashflow live
- Estimated rent
- $2,170 high interval (Pro) →
- Mortgage (P&I)
- −$1,573
- Tax est. 1.5%
- −$375 /mo · $4,500/yr
- Insurance
- −$125
- HOA
- −$112
- Vacancy / Maint / Mgmt
- −$456
- Net cashflow
- $-470
Break-even live
Sensitivity live
| Price | -10% $-263 | -5% $-367 | +0% $-470 | +5% $-574 | +10% $-678 |
|---|---|---|---|---|---|
| Rent | -10% $-642 | -5% $-556 | +0% $-470 | +5% $-385 | +10% $-299 |
| Rate | -1.0pp $-319 | -0.5pp $-394 | base $-470 | +0.5pp $-548 | +1.0pp $-627 |
UW: 25.0% down · 7.5% · 30yr · 1.5% tax · 5.0% vac · 8.0% maint · 8.0% mgmt
Financing live
Cash to close
- Down payment
- $74,998
- Closing costs
- $9,000
- Reserves months
- —
- Total cash needed
- —
Loan-product check · same deal, 3 products live
Conventional
25% down · 7.5% · 30yr
- Down + closing
- —
- Monthly P&I
- —
- Monthly cashflow
- —
- DSCR
- —
- Eligible?
- —
Personal DTI + credit; lowest rate.
DSCR
20% down · 8.5% · 30yr
- Down + closing
- —
- Monthly P&I
- —
- Monthly cashflow
- —
- DSCR
- —
- Eligible?
- —
No personal income docs; deal must DSCR.
Hard money
10% down · 12.0% · 12mo
- Down + closing
- —
- Monthly P&I
- —
- Monthly cashflow
- —
- DSCR
- —
- Eligible?
- —
Short-term bridge; refi at stabilization.
Rent comps 6 comps
| Address | Beds | Baths | Sqft | Rent | $/sqft | DOM | Units | Dist |
|---|---|---|---|---|---|---|---|---|
| 2012 Live Oak Dr Plant City, FL | 3.0 | 1.0 | 1385 | $1,890 | $1.36 | 0d | 1 | 0.93mi |
| 3021 Bush Row Loop Plant City, FL | 2.0 | 2.0 | 1170 | $1,702 | $1.45 | 6d | 15 | 1.06mi |
| 3202 Elsanta St Plant City, FL | 1.0–2.0 | 1.0–2.0 | 912 | $2,030 | $2.23 | 1d | 36 | 1.11mi |
| 817 Ashentree Dr Plant City, FL | 3.0 | 2.5 | 1820 | $2,200 | $1.21 | 22d | 1 | 1.19mi |
| 813 Wiltonway Dr Plant City, FL | 3.0 | 2.0 | 1521 | $1,995 | $1.31 | 26d | 1 | 1.34mi |
| 300 Park Springs Cir Plant City, FL | 3.0 | 2.0 | 1140 | $1,617 | $1.42 | 4d | 8 | 1.40mi |
HOA detail
- Monthly dues
- $112 · $1,344/yr
Listing history 9 events
-
2026-06-08statusdays on market $299,990 Pending 21 DOM
-
2026-06-07days on market $299,990 Active 20 DOM
-
2026-06-04days on market $299,990 Active 17 DOM
-
2026-06-03days on market $299,990 Active 16 DOM
-
2026-06-02days on market $299,990 Active 15 DOM
-
2026-06-01days on market $299,990 Active 14 DOM
-
2026-05-31days on market $299,990 Active 13 DOM
-
2026-05-21price $299,990
-
2026-05-18$325,990 Active
ⓘ Source: listings_history table (triggers on properties + properties_extension) + one-shot
backfill from property_details.listing_events for pre-trigger history.
Nearby sold comps map
Loading sold comps map…
Walkable amenities ~0.75 mi
Loading nearby amenities…
Taxation est. · year 1
- Rental income
- $26,046
- − Mortgage interest
- −$16,804
- − Property taxes
- −$4,500
- − Insurance
- −$1,500
- − Repairs & maintenance
- −$2,084
- − Management
- −$2,084
- − HOA
- −$1,344
- − Depreciation
- −$8,727
- Taxable loss
- −$10,996
- Est. tax savings @ 24.0%
- +$2,639
- After-tax cash flow
- $-3,007/yr
For passive investors: Depreciation is non-cash, so a rental often shows a tax loss while cash-flowing — sheltering income. Rental losses are passive: they offset passive income freely, and up to $25,000/yr can offset ordinary (W-2) income if you actively participate and your MAGI is under $100k (phasing out to $0 by $150k); unused losses carry forward. On sale, claimed depreciation is recaptured at up to 25%, and gains may owe capital-gains tax (a 1031 exchange can defer both). Figures are a year-1 estimate at your 24.0% rate — not tax advice; consult a CPA.
Schools (NCES district)
- District
- Hillsborough
- NCES district ID
- 1200870
- Math proficiency
- 47% ▼ -8.00%
- Reading proficiency
- 50% ▼ -4.00%
- Median HH income
- $50,622
- Composite
- 41.6/100
- National rank
- #3435
- State rank
- #41 of 73 in FL
Livability — Plant City
- Score
- 76/100
- State rank
- #227
- US rank
- #3587
Category grades
Schools grade is shown separately in the Schools card above.
Census & demographics
- Census place
- Plant City, FL
- County
- Hillsborough County · 1,540,968 people
- City population
- 68,525
- Metro
- Tampa-St. Petersburg-Clearwater, FL
- Population (ZIP)
- 24,521
- Household income
- $72,393
- Rent vs Own
- Severe rent burden
- 376.0
Population outlook (Hillsborough County) Hauer SSP2
- Today (2025)
- 1,607,022 people
- By 2030
- 1,733,968 · +7.9%
- By 2040
- 1,979,565 · +23.2%
- By 2050
- 2,203,427 · +37.1%
- By 2075
- 2,667,893 · +66.0%
- By 2100
- 2,891,558 · +79.9%
Race, ethnicity, and origin ACS 2023
- Neighborhood character
- Diverse neighborhood (Simpson 0.59)
- Race & ethnicity
- White 54% Hispanic / Latino 34% Two or more races 14% Black 8% Asian 2%
- Hispanic origin (detail)
- Mexican 19% Puerto Rican 7% Cuban 4%
- Common ancestry
- Lithuanian 2% Serbian 2% Romanian 1%
- Foreign-born
- 17% · Canada, Jamaica
- Languages at home
- 73% English-only · Spanish 26% Other Asian/Pacific 1%
Political lean MEDSL · Hillsborough
- 2024 margin
- Toss-up / Even · D 47.8% · R 50.9% · Other 1.3%
- 2008→2024 swing
- -10.2pp toward R · 2008: 7.1pp · 2024: -3.1pp
- All cycles
- 2024: R+3.1 2020: D+6.9 2016: D+6.8 2012: D+6.7 2008: D+7.1
Not yet ingested
- Civics
- —
Market trends
- HPI YoY
- ▼ -69.40%
- Current HPI
- 298.1385
- Rent YoY
- ▲ 5.09%
- Metro
- Tampa-St. Petersburg-Clearwater, FL
- State GDP YoY
- ▲ 3.28%
- F500 in state
- 36
Industry mix (Fortune 500 HQ in FL)
| Industry | F500 HQs | Revenue |
|---|---|---|
| Industrial Technology | 2 | $29B |
|
||
| Insurance | 2 | $17B |
|
||
| Retail | 1 | $60B |
|
||
| Technology Distribution | 1 | $58B |
|
||
| Homebuilding | 1 | $35B |
|
||
| Technology Manufacturing | 1 | $35B |
|
||
Price history
-8.0% since first listed3 events — show timeline
- 2026-06-08 Pending — Stellar MLS as Distributed by MLS Grid
- 2026-05-21 Price Changed $299,990 Stellar MLS as Distributed by MLS Grid
- 2026-05-18 Listed $325,990 Stellar MLS as Distributed by MLS Grid
Cash-flow waterfall
monthlySold comps — $/sqft
last 12 mo · ≤1 miLoading sold comps…