 🏗️ New Construction
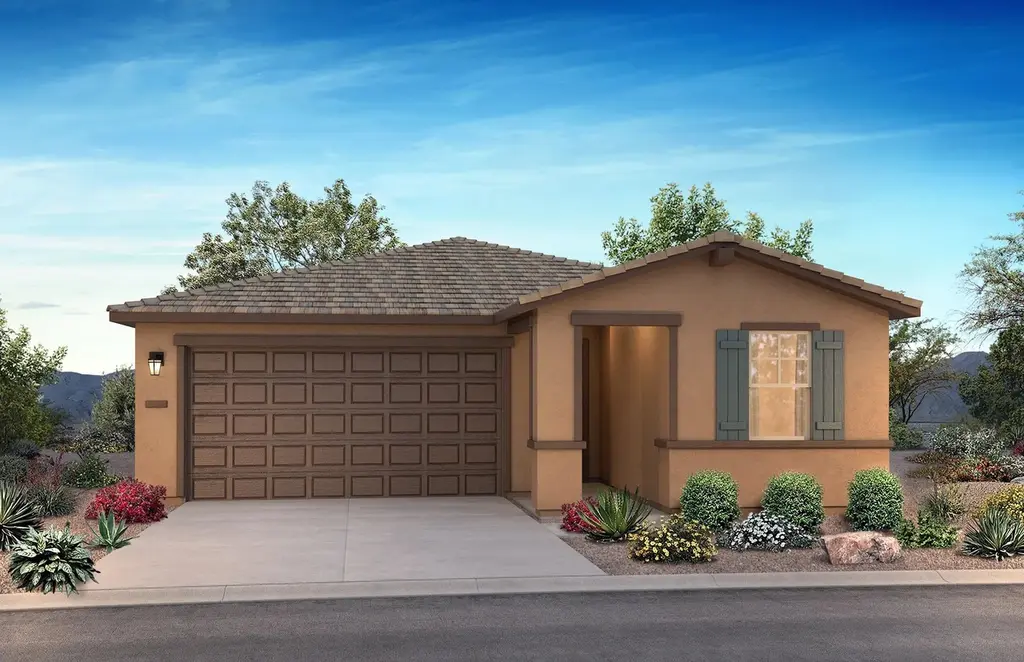
Flourish Plan · Wickenburg, AZ
Flood risk No data
- FEMA flood zone
- —
- Chance of flooding over 30 yrs
- —
- Est. flood insurance / yr
- —
Fire risk No data
- Est. fire insurance / yr
- —
Heat risk No data
- Hot days now (above threshold)
- —
- Hot days in 30 yrs
- —
Wind risk No data
- Chance of severe wind over 30 yrs
- —
Air-quality risk No data
- Unhealthy air days now
- —
- Unhealthy air days in 30 yrs
- —
Risk factors via First Street. Map © Google.
Why this score? — see what drove the F grade
The composite is a weighted blend of 9 inputs, each scored 0–100. Each bar is that input's sub-score; the figure is the points it added to the 100-point composite (weight × sub-score).
- ARV discount +7.5/15.0
- Livability +3.5/5.0
- Schools +2.9/10.0
- Rent growth +2.5/5.0
- Condition / age +2.5/5.0
- Cash flow +1.9/30.0
- 1% rule +0.0/10.0
- DSCR +0.0/10.0
- Appreciation +0.0/10.0
$404,900
🖨 Deal sheet 📄 Offer letter ✓ Due diligence
Listing remarks MLS
55+ & All-Ages Resort Community, Open Floor Plan, Spacious Primary Bedroom with Walk-In Closet , Large Kitchen Island, 2 Car Garage, Covered Patio , Single Story Design, Den, Optional Multi Slide Door at Great Room, This plan modeled here and Trilogy Sunstone, Optional 4th Bedroom , Optional French Door at Primary Bedroom to Patio
Key facts
- Large kitchen island
- Resort community
- Single story design
Tags
Neighborhood map
What this means for you Summary
Snapshot
- This is a 3-bed/2.0-bath single-family listed at $405k.
Deal economics
- At list price, monthly cash flow is $-3k ($-32k/yr) — negative.
- To cash-flow at today's rent, offer at most $327k (19.2% below list).
- To meet the 1% rule (rent ≥ 1% of price), the offer needs to be $286k (29.3% below list).
- Recommended offer: $286k (29.3% below list) — sets the bar for 1% rule.
- Cap rate 1.8% vs local median 3.0% in Wickenburg — below-typical yield; the buyer is paying a premium for something (appreciation thesis, condition, location) that the cap rate doesn't capture.
Location & tenants
- Location reads 70/100 on livability (#41 in AZ) — a middle-class / working-renter tenant base. Strengths: crime A+, housing A+, cost of living A-; Watch: schools D+, amenities F, commute F.
- Wickenburg Unified District (4236) (rural): math 33% / reading 35% proficiency, ranked #92 of 249 in AZ (top 37%) — families likely to look elsewhere, expect single-tenant / working-renter base with shorter leases.
- Market conditions: 378 active listings in the ZIP; 21 comparable units currently listed for rent nearby; rentals leasing fast (median 2d on market — plan ~1-2 weeks tenant-placement turnaround); 2,062 units permitted in Yavapai County in 2024 (98 in 5+ unit buildings).
- At $2,863/mo this rent would consume 50% of the median local household income ($69k/yr) (locally 251% of renters already pay >50% of income on rent) — very limited rent-growth headroom before tenants either downsize or default.
Forward outlook
- Local home prices are declining (-3.0%/yr); year-one equity from $5k of loan paydown is wiped out by about $21k of value loss. Plan a longer hold.
- Yavapai County population projected at +10% by 2050 — modest demand growth; plan on rents tracking national, not racing it.
Negotiation context
- It's been on market 647 days — a 12% lower offer ($356k) is reasonable based on typical stale-listing flexibility.
Risks & watch-outs
- Watch-outs: property tax is 2.6% of price.
Questions for the listing agent
- What do current leases actually rent for vs. the listed asking? Can we see a recent rent roll and the last 12 months of T-12 income?
- It's been on market 647 days. Have you received any prior offers? Is the seller open to a 29% concession, seller financing, or rate buy-down credit?
- Property tax is high relative to price — has the assessment been appealed recently, and will the sale trigger a re-assessment?
- Why hasn't it sold? Are there any deal-killer items the seller is aware of (foundation, flood, title, zoning, code violations)?
- Is there a deadline driving the sale (1031 exchange, divorce, estate, relocation)? That informs how much negotiation room exists.
- Schools are D-rated, which usually means shorter tenancies and higher turnover. Who's the typical renter profile here, and what's been the actual vacancy rate?
- The area grade is low — what's the realistic commute time and amenity access for the typical tenant pool here? Any planned neighborhood developments (good or bad) we should know about?
- What's the average days-on-market for RENTAL listings here right now (not sales)? A rising rental-DOM trend means longer vacancies and softer asking-rent achievability than the comps imply.
- What's the recent tenant-quality profile in this submarket — average credit score on applications, eviction rate, late-payment / NSF rate, and stable-employment percentage? A property-management company in the area should have these aggregated.
- How much new for-sale + rental construction is in the pipeline within 1–3 miles? Heavy new supply typically softens prices + rents 12–24 months out; constrained supply supports both.
Investment metrics
- 1% rule
- 0.40% ✗
- Cap rate
- 1.81%
- Cash-on-cash
- -16.01%
- DSCR
- 0.29
- GRM
- 20.7
CMA / ARV
- ARV (median comp)
- $712,327
- List price
- $404,900
- Delta
- -43.16%
- Verdict
- UNDERPRICED
- Comps
- 20 within 1.0 mi
Show comp detail 12 sales within ~0.75 mi
| Address | Dist | Beds/Ba | Sqft | Sold | Price | $/sf | Match |
|---|---|---|---|---|---|---|---|
| 3205 Rising Sun Rdg | 0.22mi | 2/2.0 (-1) | 1,950 (+8%) | 3mo | $550,000 | $282 | 70 |
| 3410 Maverick Dr | 0.32mi | 2/2.0 (-1) | 1,845 (+2%) | 14mo | $825,000 | $447 | 66 |
| 3215 Rising Sun Rdg | 0.25mi | 2/2.0 (-1) | 1,578 (-13%) | 3mo | $345,000 | $219 | 60 |
| 3739 Goldmine Canyon Way | 0.67mi | 2/2.5 (-1) | 1,813 (+0%) | 3mo | $542,000 | $299 | 59 |
| 3661 Quartz Cir | 0.39mi | 2/2.0 (-1) | 1,981 (+9%) | 5mo | $589,000 | $297 | 57 |
| 3775 Goldmine Canyon Way | 0.70mi | 2/2.5 (-1) | 1,825 (+1%) | 6mo | $550,000 | $301 | 54 |
| 3285 Maverick Dr | 0.26mi | 2/2.0 (-1) | 1,570 (-13%) | 9mo | $460,000 | $293 | 53 |
| 3783 Goldmine Canyon Way | 0.71mi | 2/2.0 (-1) | 1,709 (-6%) | 1mo | $530,000 | $310 | 52 |
| 3820 Ridge Runner Way | 0.64mi | 2/2.0 (-1) | 1,959 (+8%) | 9mo | $590,000 | $301 | 44 |
| 3690 Gold Rush Ct | 0.75mi | 2/2.0 (-1) | 1,976 (+9%) | 8mo | $445,000 | $225 | 38 |
| 3765 Gold Ridge Rd | 0.74mi | 2/2.0 (-1) | 1,648 (-9%) | 12mo | $417,000 | $253 | 36 |
| 3935 Bright Sky Ct | 0.74mi | 2/2.0 (-1) | 1,959 (+8%) | 13mo | $699,000 | $357 | 36 |
Match score weights: distance 35% · size 25% · config 20% · recency 20%. Top-matched comps best support the ARV.
Projected returns pro-forma
-3.0% appreciation · 3.0% rent growth · sell at horizon
- IRR
- -47.5%
- Equity multiple
- -0.43×
- Total profit
- $-284,853
- Equity at exit
- $106,210
- IRR
- -90.7%
- Equity multiple
- -1.34×
- Total profit
- $-466,087
- Equity at exit
- $61,589
Cash invested: $199,451 (down + closing). Projections, not guarantees.
Landlord ↔ Tenant lean methodology
- Overall (STATE)
- 87 Strongly Landlord-Friendly
- State Arizona
- 87 Strongly Landlord-Friendly · R+3
- County
- — inherits STATE
- City
- — inherits STATE
ZIP-level market 85390
- Home prices YoY
- -17.4%
- Active inventory
- 378
- Price-to-rent
- 11.8×
Monthly cashflow live
- Estimated rent
- $2,863 high interval (Pro) →
- Mortgage (P&I)
- −$3,736
- Tax est. 1.5%
- −$890 /mo · $10,685/yr
- Insurance
- −$297
- HOA
- −$0
- Vacancy / Maint / Mgmt
- −$601
- Net cashflow
- $-2,661
Break-even live
UW: 25.0% down · 7.5% · 30yr · 1.5% tax · 5.0% vac · 8.0% maint · 8.0% mgmt
Financing live
Cash to close
- Down payment
- $178,082
- Closing costs
- $21,370
- Reserves months
- —
- Total cash needed
- —
Loan-product check · same deal, 3 products live
Conventional
25% down · 7.5% · 30yr
- Down + closing
- —
- Monthly P&I
- —
- Monthly cashflow
- —
- DSCR
- —
- Eligible?
- —
Personal DTI + credit; lowest rate.
DSCR
20% down · 8.5% · 30yr
- Down + closing
- —
- Monthly P&I
- —
- Monthly cashflow
- —
- DSCR
- —
- Eligible?
- —
No personal income docs; deal must DSCR.
Hard money
10% down · 12.0% · 12mo
- Down + closing
- —
- Monthly P&I
- —
- Monthly cashflow
- —
- DSCR
- —
- Eligible?
- —
Short-term bridge; refi at stabilization.
Rent comps 21 comps
| Address | Beds | Baths | Sqft | Rent | $/sqft | DOM | Units | Dist |
|---|---|---|---|---|---|---|---|---|
| 3753 Goldmine Canyon Way Wickenburg, AZ | 2.0 | 2.0 | 1713 | $3,500 | $2.04 | 1d | 1 | 0.70mi |
| 3753 Goldmine Canyon Way Wickenburg, AZ | 2.0 | 2.0 | 1713 | $2,700 | $1.58 | 22d | 1 | 0.70mi |
| 4002 Desert Moon Dr Wickenburg, AZ | 2.0 | 2.5 | 1678 | $3,500 | $2.09 | 1d | 1 | 0.77mi |
| 4060 Old Orchard Dr Wickenburg, AZ | 2.0 | 2.5 | 2043 | $4,000 | $1.96 | 24d | 1 | 0.83mi |
| 4086 Prairie Schooner Rd Wickenburg, AZ | 2.0 | 2.0 | 1542 | $3,500 | $2.27 | 1d | 1 | 0.85mi |
| 3904 Goldmine Canyon Way Wickenburg, AZ | 2.0 | 2.5 | 1751 | $2,600 | $1.48 | 1d | 1 | 0.87mi |
| 3975 Rolling Stock Way Wickenburg, AZ | 3.0 | 2.5 | 2362 | $3,300 | $1.40 | 1d | 1 | 0.95mi |
| 3261 Huckleberry Way Wickenburg, AZ | 2.0 | 2.5 | 1777 | $2,000 | $1.13 | 4d | 1 | 1.14mi |
| 3231 Huckleberry Way Wickenburg, AZ | 2.0 | 2.5 | 1751 | $3,900 | $2.23 | 19d | 1 | 1.17mi |
| 4345 Cutter Ln Wickenburg, AZ | 2.0 | 2.0 | 1578 | $3,500 | $2.22 | 11d | 1 | 1.18mi |
| 4345 Cutter Ln Wickenburg, AZ | 2.0 | 2.0 | 1578 | $2,700 | $1.71 | 24d | 1 | 1.18mi |
| 4295 Sawbuck Way Wickenburg, AZ | 2.0 | 2.5 | 1869 | $2,700 | $1.44 | 1d | 1 | 1.26mi |
| 4439 Copper Mine Ct Wickenburg, AZ | 3.0 | 2.0 | 1831 | $5,900 | $3.22 | 4d | 1 | 1.31mi |
| 3021 Prospector Way Wickenburg, AZ | 4.0 | 2.0 | 1835 | $2,450 | $1.34 | 24d | 1 | 1.32mi |
| 4463 Copper Mine Ct Wickenburg, AZ | 3.0 | 2.0 | 1839 | $6,000 | $3.26 | 22d | 1 | 1.33mi |
| 3106 Prospector Way Wickenburg, AZ | 2.0 | 2.0 | 1691 | $2,050 | $1.21 | 1d | 1 | 1.35mi |
| 3199 Prospector Way Wickenburg, AZ | 3.0 | 3.5 | 2340 | $4,250 | $1.82 | 1d | 1 | 1.38mi |
| 4331 Greenhorn Way Wickenburg, AZ | 2.0 | 2.0 | 1750 | $2,500 | $1.43 | 1d | 1 | 1.38mi |
| 4468 Covered Wagon Trl Wickenburg, AZ | 2.0 | 2.0 | 1506 | $2,250 | $1.49 | 1d | 1 | 1.39mi |
| 4527 Charro Ct Wickenburg, AZ | 2.0 | 2.0 | 1624 | $2,400 | $1.48 | 1d | 1 | 1.41mi |
| 4540 Jackpot Rd Wickenburg, AZ | 2.0 | 2.0 | 1669 | $2,560 | $1.53 | 1d | 1 | 1.41mi |
Listing history 16 events
-
2026-06-18days on market $404,900 Active 647 DOM
-
2026-06-17days on market $404,900 Active 646 DOM
-
2026-06-16days on market $404,900 Active 645 DOM
-
2026-06-15days on market $404,900 Active 644 DOM
-
2026-06-13days on market $404,900 Active 642 DOM
-
2026-06-13days on market $404,900 Active 641 DOM
-
2026-06-09days on market $404,900 Active 638 DOM
-
2026-06-08days on market $404,900 Active 637 DOM
-
2026-06-07days on market $404,900 Active 636 DOM
-
2026-06-04days on market $404,900 Active 633 DOM
-
2026-06-03days on market $404,900 Active 632 DOM
-
2026-06-02days on market $404,900 Active 631 DOM
-
2026-06-01days on market $404,900 Active 630 DOM
-
2026-05-31days on market $404,900 Active 629 DOM
-
2025-05-03price $404,900 338-char remark
Show marketing remark (338 chars)
55+ & All-Ages Resort Community, Open Floor Plan, Spacious Primary Bedroom with Walk-In Closet , Large Kitchen Island, 2 Car Garage, Covered Patio , Single Story Design, Den, Optional Multi Slide Door at Great Room, This plan modeled here and Trilogy Sunstone, Optional 4th Bedroom , Optional French Door at Primary Bedroom to Patio
-
2024-09-09$436,900 Active 338-char remark
Show marketing remark (338 chars)
55+ & All-Ages Resort Community, Open Floor Plan, Spacious Primary Bedroom with Walk-In Closet , Large Kitchen Island, 2 Car Garage, Covered Patio , Single Story Design, Den, Optional Multi Slide Door at Great Room, This plan modeled here and Trilogy Sunstone, Optional 4th Bedroom , Optional French Door at Primary Bedroom to Patio
ⓘ Source: listings_history table (triggers on properties + properties_extension) + one-shot
backfill from property_details.listing_events for pre-trigger history.
Nearby sold comps map
Loading sold comps map…
Walkable amenities ~0.75 mi
Loading nearby amenities…
Taxation est. · year 1
- Rental income
- $34,358
- − Mortgage interest
- −$39,901
- − Property taxes
- −$10,685
- − Insurance
- −$3,562
- − Repairs & maintenance
- −$2,749
- − Management
- −$2,749
- − Depreciation
- −$20,722
- Taxable loss
- −$46,009
- Est. tax savings @ 24.0%
- +$11,042
- After-tax cash flow
- $-20,888/yr
For passive investors: Depreciation is non-cash, so a rental often shows a tax loss while cash-flowing — sheltering income. Rental losses are passive: they offset passive income freely, and up to $25,000/yr can offset ordinary (W-2) income if you actively participate and your MAGI is under $100k (phasing out to $0 by $150k); unused losses carry forward. On sale, claimed depreciation is recaptured at up to 25%, and gains may owe capital-gains tax (a 1031 exchange can defer both). Figures are a year-1 estimate at your 24.0% rate — not tax advice; consult a CPA.
Schools (NCES district)
- District
- Wickenburg Unified District (4236)
- NCES district ID
- 0409190
- Math proficiency
- 33% ▼ -10.00%
- Reading proficiency
- 35% ▼ -7.00%
- Median HH income
- $47,369
- Composite
- 29.27/100
- National rank
- #6560
- State rank
- #92 of 249 in AZ
Livability — Wickenburg
- Score
- 70/100
- State rank
- #41
- US rank
- #7975
Category grades
Schools grade is shown separately in the Schools card above.
Census & demographics
- Census place
- Wickenburg, AZ
- County
- Maricopa County · 4,537,380 people
- City population
- 10,298
- Metro
- Phoenix-Mesa-Chandler, AZ
- Population (ZIP)
- 10,298
- Household income
- $68,591
- Rent vs Own
- Severe rent burden
- 251.0
Population outlook (Yavapai County) Hauer SSP2
- Today (2025)
- 241,389 people
- By 2030
- 249,523 · +3.4%
- By 2040
- 259,966 · +7.7%
- By 2050
- 264,736 · +9.7%
- By 2075
- 269,334 · +11.6%
- By 2100
- 256,505 · +6.3%
Race, ethnicity, and origin ACS 2023
- Neighborhood character
- Predominantly White (88%)
- Race & ethnicity
- White 88% Hispanic / Latino 7% Two or more races 4% Native American 1%
- Hispanic origin (detail)
- Mexican 5%
- Common ancestry
- Portuguese 3% Lithuanian 3% Slovak 2%
- Foreign-born
- 3% · Canada
- Languages at home
- 93% English-only · Spanish 5%
Political lean MEDSL · Yavapai
- 2024 margin
- Solid R (+33.9) · D 32.6% · R 66.5%
- 2008→2024 swing
- -9.5pp toward R · 2008: -24.4pp · 2024: -33.9pp
- All cycles
- 2024: R+33.9 2020: R+29.3 2016: R+31.4 2012: R+30.7 2008: R+24.4
Not yet ingested
- Civics
- —
Market trends
- HPI YoY
- ▼ -66.26%
- Current HPI
- 314.3169
- Rent YoY
- —
- Metro
- Phoenix-Mesa-Chandler, AZ
- State GDP YoY
- ▲ 4.54%
- F500 in state
- 20
Industry mix (Fortune 500 HQ in AZ)
| Industry | F500 HQs | Revenue |
|---|---|---|
| Technology | 2 | $13B |
|
||
| Mining / Metals | 1 | $23B |
|
||
| Environmental Services | 1 | $16B |
|
||
| Metals / Steel | 1 | $14B |
|
||
| Technology Distribution | 1 | $9B |
|
||
| Homebuilding | 1 | $8B |
|
||
Price history
-7.3% since first listed2 events — show timeline
- 2025-05-03 Price Changed $404,900 Zillow
- 2024-09-09 Listed $436,900 Zillow
Cash-flow waterfall
monthlySold comps — $/sqft
last 12 mo · ≤1 miLoading sold comps…