 Fourplex
401 Dexter St · Rocky Mount, NC
Flood risk 1/10 · Minimal
- FEMA flood zone
- X (unshaded)
- Chance of flooding over 30 yrs
- 0.0%
- Est. flood insurance / yr
- $507 – $1,088
Fire risk 2/10 · Minimal
- Est. fire insurance / yr
- $906 – $1,684
Heat risk 8/10 · Major
- Hot days now (above 107°F)
- 7 days/yr
- Hot days in 30 yrs
- 16 days/yr
Wind risk 6/10 · Moderate
- Chance of severe wind over 30 yrs
- 72.0%
Air-quality risk 2/10 · Minimal
- Unhealthy air days now
- 1 days/yr
- Unhealthy air days in 30 yrs
- 2 days/yr
Risk factors via First Street. Map © Google.
Why this score? — see what drove the B- grade
The composite is a weighted blend of 9 inputs, each scored 0–100. Each bar is that input's sub-score; the figure is the points it added to the 100-point composite (weight × sub-score).
- Cash flow +30.0/30.0
- 1% rule +10.0/10.0
- DSCR +10.0/10.0
- ARV discount +7.5/15.0
- Rent growth +3.9/5.0
- Livability +3.5/5.0
- Condition / age +2.5/5.0
- Schools +2.2/10.0
- Appreciation +0.0/10.0
$195,000
🖨 Deal sheet 📄 Offer letter ✓ Due diligence
Multi-family units
County records classify this as Multi-Family (2-4 Unit). Listing-text estimate: 4 units. confirmed
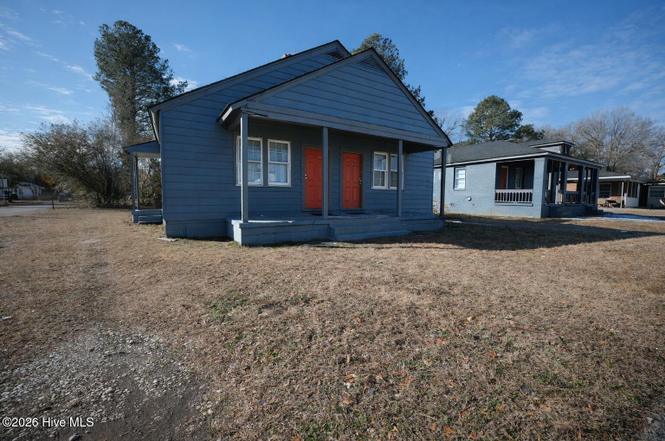
Listing remarks
4-Unit Investor Package - Value-Add Opportunity with Immediate Income Great opportunity to acquire four rental units across two duplexes in Rocky Mount for $195,000. The MLS listing is entered as 401 Dexter St, but the sale includes all units from 401-407 Dexter St, offering a rare chance to secure multiple doors in one transaction. Included in the sale: • 401-403 Dexter St (Parcel ID: 030630, PIN: 37591035663) • 405-407 Dexter St (Parcel ID: 027311, PIN: 375910355689) Each unit has its own address, providing flexibility for leasing and management. Two of the four units (401 and 405) are currently rented, generating immediate income. The remaining two units are currently b
Key facts
- Value-add potential
- Four rental units
- Two duplexes
Tags
Property features AI
Finance
- Other: Located on Dexter St; sale includes adjacent duplex at 407 Dexter St (per directions)
- Financial info: Multiple rental units with reported rents (examples include $600, $535); units are rented individually
- HOA & community: No association amenities
Exterior
- Parking: Off-street unpaved parking
- Home design: Quadruplex (residential income property); One-story building
- Construction: Vinyl siding and frame construction; Shingle roof
- Exterior features: Porch; Corner lot; Has a view; No special exterior features listed
Interior
- Bedrooms: Multiple 1-bedroom units (each unit unfurnished)
- Heating & cooling: Baseboard electric heating; Wall/window air conditioning units
- Interior features: Crawl space basement
Neighborhood map
What this means for you Summary
Snapshot
- This is a 4 × 4-bed/4.0-bath units multifamily listed at $195k.
Deal economics
- At list price, monthly cash flow is $3k ($32k/yr) — positive. Per door: $671/mo.
- The deal already cash-flows at list — no discount required.
- Meets the 1% rule at list price ($5k rent vs $195k).
- Recommended offer: $177k (9.0% below list) — sets the bar for market timing.
- Cap rate 22.8% vs local median 4.5% in Rocky Mount — top-decile yield for the area; either an underpriced asset or a hidden risk that comps aren't pricing in. Stress-test before assuming the spread holds.
Location & tenants
- Location reads 70/100 on livability (#134 in NC) — a middle-class / working-renter tenant base. Strengths: cost of living A+, housing A+, health & safety A+; Watch: crime F, amenities F, employment F.
- Nash-Rocky Mount Schools (rural): math 20% / reading 32% proficiency, ranked #155 of 178 in NC (top 87%) — low school quality limits family demand, transient renter base, plan for 1-2y turnover.
- Zoned schools: Bailey Elementary (math 24% / reading 28%, grade F, #1,085 of 1,410 statewide, top 77%, 538 students, 75% FRL); Rocky Mount Middle (math 7% / reading 26%, grade F, #449 of 475 statewide, top 96%, 407 students, 97% FRL); Rocky Mount High (math 27% / reading 36%, grade F, #449 of 535 statewide, top 85%, 1,072 students, 76% FRL) — zoned schools average 82% FRL vs 59% district-wide (23 pts higher); higher-poverty schools than district average — tighter screening recommended.
- Market conditions: Rents rising fast (+5.5%/yr); 171 active listings in the ZIP; 500 units permitted in Nash County in 2024 (0 in 5+ unit buildings).
Forward outlook
- Local home prices are declining (-3.0%/yr); year-one equity from $1k of loan paydown is wiped out by about $6k of value loss. Plan a longer hold.
- Nash County population projected at -12% by 2050 — secular population decline; favor cash flow + early exit over multi-decade hold.
- At projected returns (-3.0% appreciation + 5.5% rent growth), your $55k cash investment doubles in ~2 years — after that, you're playing with house money.
Negotiation context
- It's been on market 91 days — a 9% lower offer ($177k) is reasonable based on typical stale-listing flexibility.
- 2 sale attempts since 5y ago with the ask held roughly flat each time — persistent listings suggest the price (not the market) is what's stuck; bring a comps-based counter.
- Current owner paid $130k; list at $195k implies a 50% gain — meaningful room to come down on a strong offer.
Risks & watch-outs
- Watch-outs: built in 1951 — expect roof / HVAC / electrical / plumbing capex.
- Climate carrying-cost: major wind risk, 72% chance of damaging wind over 30y; extreme-heat days projected 7→16/yr by 2055 (HVAC capex compounding) — expect insurance premiums to compound above CPI over the hold.
Questions for the listing agent
- It's been on market 91 days. Have you received any prior offers? Is the seller open to a 9% concession, seller financing, or rate buy-down credit?
- Can we see the unit-by-unit rent roll, current vacancy, and any below-market leases? What's the average tenancy length?
- What capital expenditures (roof, boiler, parking lot, exteriors) have been made in the last 5 years, and what's planned in the next 2?
- Built in 1951 — when were the roof, HVAC, electrical panel, plumbing, and water heater last replaced?
- Why hasn't it sold? Are there any deal-killer items the seller is aware of (foundation, flood, title, zoning, code violations)?
- Is there a deadline driving the sale (1031 exchange, divorce, estate, relocation)? That informs how much negotiation room exists.
- Schools are F-rated, which usually means shorter tenancies and higher turnover. Who's the typical renter profile here, and what's been the actual vacancy rate?
- Crime grade is F in this area — have there been break-ins, vandalism, or insurance claims at this property in the last 3 years? What carrier currently insures it and at what premium?
- What's the average days-on-market for RENTAL listings here right now (not sales)? A rising rental-DOM trend means longer vacancies and softer asking-rent achievability than the comps imply.
- What's the recent tenant-quality profile in this submarket — average credit score on applications, eviction rate, late-payment / NSF rate, and stable-employment percentage? A property-management company in the area should have these aggregated.
- How much new apartment / multifamily construction is in the pipeline within 1–3 miles? Heavy new supply (>2% of stock underway) typically softens rents 12–24 months out; light construction supports rent growth.
Investment metrics
- 1% rule
- 2.49% ✓
- Cap rate
- 22.82%
- Cash-on-cash
- 59.03%
- DSCR
- 3.63
- GRM
- 3.4
CMA / ARV
- ARV (on-the-fly)
- $124,848
- Comps found
- 4
Show comp detail 4 sales within ~0.75 mi
| Address | Dist | Beds/Ba | Sqft | Sold | Price | $/sf | Match |
|---|---|---|---|---|---|---|---|
| 500 Cleveland St | 0.11mi | 2/2.0 (-1) | 1,200 (-2%) | 22mo | $59,900 | $50 | 68 |
| 422 Nance St | 0.48mi | 4/2.0 (+1) | 1,248 (+2%) | 5mo | $29,000 | $23 | 65 |
| 912-914 Belvedere St | 0.16mi | 2/2.0 (-1) | 1,088 (-11%) | 10mo | $138,000 | $127 | 60 |
| 536 Smith St | 0.71mi | 2/2.0 (-1) | 1,308 (+7%) | 11mo | $134,000 | $102 | 41 |
Match score weights: distance 35% · size 25% · config 20% · recency 20%. Top-matched comps best support the ARV.
Projected returns pro-forma
-3.0% appreciation · 5.51% rent growth · sell at horizon
- IRR
- 60.3%
- Equity multiple
- 3.78×
- Total profit
- $151,970
- Equity at exit
- $29,075
- IRR
- 65.8%
- Equity multiple
- 8.45×
- Total profit
- $406,620
- Equity at exit
- $16,860
Cash invested: $54,600 (down + closing). Projections, not guarantees.
Landlord ↔ Tenant lean methodology
- Overall (STATE)
- 85 Strongly Landlord-Friendly
- State North Carolina
- 85 Strongly Landlord-Friendly · R+3
- County
- — inherits STATE
- City
- — inherits STATE
ZIP-level market 27803
- Rents YoY
- 5.5%
- Active inventory
- 171
- Price-to-rent
- 13.4×
Monthly cashflow live
- Estimated rent
- $4,848 medium interval (Pro) →
- Mortgage (P&I)
- −$1,023
- Tax from tax record
- −$40 /mo · $481/yr
- Insurance
- −$81
- HOA
- −$0
- Vacancy / Maint / Mgmt
- −$1,018
- Net cashflow
- $2,686
Break-even live
4-unit breakdown (identical units grouped — click to expand)
| Units | Beds | Baths | Est. rent |
|---|---|---|---|
| 4× units | 4 | 4 | $4,848 |
| #1 | 4 | 4 | $1,212 |
| #2 | 4 | 4 | $1,212 |
| #3 | 4 | 4 | $1,212 |
| #4 | 4 | 4 | $1,212 |
| Total (4 units) | $4,848 | ||
UW: 25.0% down · 7.5% · 30yr · 1.5% tax · 5.0% vac · 8.0% maint · 8.0% mgmt
Financing live
Cash to close
- Down payment
- $48,750
- Closing costs
- $5,850
- Reserves months
- —
- Total cash needed
- —
Loan-product check · same deal, 3 products live
Conventional
25% down · 7.5% · 30yr
- Down + closing
- —
- Monthly P&I
- —
- Monthly cashflow
- —
- DSCR
- —
- Eligible?
- —
Personal DTI + credit; lowest rate.
DSCR
20% down · 8.5% · 30yr
- Down + closing
- —
- Monthly P&I
- —
- Monthly cashflow
- —
- DSCR
- —
- Eligible?
- —
No personal income docs; deal must DSCR.
Hard money
10% down · 12.0% · 12mo
- Down + closing
- —
- Monthly P&I
- —
- Monthly cashflow
- —
- DSCR
- —
- Eligible?
- —
Short-term bridge; refi at stabilization.
Listing history 13 events
-
2026-06-07statusdays on market $195,000 Pending 91 DOM
-
2026-06-03days on market $195,000 Active Under Contract 89 DOM
-
2026-06-03status $195,000 Active Under Contract 88 DOM
-
2026-06-02days on market $195,000 Active 88 DOM
-
2026-06-01days on market $195,000 Active 87 DOM
-
2026-05-31days on market $195,000 Active 86 DOM
-
2026-05-30days on market $195,000 Active 85 DOM
-
2026-02-05$195,000 Active
-
2022-02-04soldstatus $130,000
-
2022-02-01soldstatus $153,000
-
2021-05-30historical
-
2021-05-24$64,400
-
2019-10-30soldstatus $80,000
ⓘ Source: listings_history table (triggers on properties + properties_extension) + one-shot
backfill from property_details.listing_events for pre-trigger history.
Tax reassessment forecast NC · Resets to sale price
- Current annual tax
- $481 · $40/mo
- Projected year-2 tax
- $1,599 · $133/mo
- Expected delta
- +$1,118/yr (+$93/mo · 232.2%)
ⓘ Screening estimate from a state-policy table — verify with the county assessor before closing.
Climate risk First Street
- Flood 1/10 Low FEMA zone X (unshaded) · 0% chance over 30 yrs
- Wildfire 2/10 Low
- Heat 8/10 Severe 7 d/yr ≥107°F today · 16 d/yr by 30 yrs out
- Wind 6/10 Major 72% chance of damaging wind over 30 yrs
- Air quality 2/10 Low 1 unhealthy d/yr today · 2 by 30 yrs out
Nearby sold comps map
Loading sold comps map…
Walkable amenities ~0.75 mi
Loading nearby amenities…
Taxation est. · year 1
- Rental income
- $58,176
- − Mortgage interest
- −$10,923
- − Property taxes
- −$481
- − Insurance
- −$975
- − Repairs & maintenance
- −$4,654
- − Management
- −$4,654
- − Depreciation
- −$5,673
- Taxable income
- $30,816
- Est. tax owed @ 24.0%
- −$7,396
- After-tax cash flow
- $24,836/yr
For passive investors: Depreciation is non-cash, so a rental often shows a tax loss while cash-flowing — sheltering income. Rental losses are passive: they offset passive income freely, and up to $25,000/yr can offset ordinary (W-2) income if you actively participate and your MAGI is under $100k (phasing out to $0 by $150k); unused losses carry forward. On sale, claimed depreciation is recaptured at up to 25%, and gains may owe capital-gains tax (a 1031 exchange can defer both). Figures are a year-1 estimate at your 24.0% rate — not tax advice; consult a CPA.
Schools (NCES district)
- District
- Nash-Rocky Mount Schools
- NCES district ID
- 3703270
- Math proficiency
- 20% ▼ -3.00%
- Reading proficiency
- 32% ▲ 1.00%
- Median HH income
- $41,553
- Composite
- 22.04/100
- National rank
- #8198
- State rank
- #155 of 178 in NC
Livability — Rocky Mount
- Score
- 70/100
- State rank
- #134
- US rank
- #7692
Category grades
Schools grade is shown separately in the Schools card above.
Census & demographics
- Census place
- Rocky Mount, NC
- County
- Nash County · 50,768 people
- City population
- 70,300
- Metro
- Rocky Mount, NC
- Population (ZIP)
- 20,055
- Household income
- $60,124
- Rent vs Own
- Severe rent burden
- 641.0
Population outlook (Nash County) Hauer SSP2
- Today (2025)
- 91,107 people
- By 2030
- 89,193 · -2.1%
- By 2040
- 84,959 · -6.7%
- By 2050
- 80,517 · -11.6%
- By 2075
- 72,941 · -19.9%
- By 2100
- 63,602 · -30.2%
Race, ethnicity, and origin ACS 2023
- Neighborhood character
- Diverse neighborhood (Simpson 0.60)
- Race & ethnicity
- White 46% Black 44% Two or more races 6% Hispanic / Latino 5% Asian 1%
- Common ancestry
- Iranian 1% Italian 1% Slovak 1%
- Foreign-born
- 3% · Canada
- Languages at home
- 93% English-only · Spanish 5% Arabic 1% Other Indo-European 1%
Political lean MEDSL · Nash
- 2024 margin
- Toss-up / Even · D 48.7% · R 50.5%
- 2008→2024 swing
- -0.4pp no change · 2008: -1.3pp · 2024: -1.8pp
- All cycles
- 2024: R+1.8 2020: D+0.2 2016: R+0.2 2012: D+0.9 2008: R+1.3
Not yet ingested
- Civics
- —
Market trends
- HPI YoY
- ▼ -162.95%
- Current HPI
- 190.0204
- Rent YoY
- ▲ 5.51%
- Metro
- Rocky Mount, NC
- State GDP YoY
- ▲ 3.28%
- F500 in state
- 26
Industry mix (Fortune 500 HQ in NC)
| Industry | F500 HQs | Revenue |
|---|---|---|
| Financial Services | 2 | $213B |
|
||
| Retail | 2 | $95B |
|
||
| Industrial Conglomerate | 1 | $38B |
|
||
| Metals / Steel | 1 | $35B |
|
||
| Utilities | 1 | $30B |
|
||
| Industrial Machinery | 1 | $19B |
|
||
Price history
+143.8% since first listed6 events — show timeline
- 2026-02-05 Listed $195,000 Hive MLS
- 2022-02-04 Sold (Public Records) $130,000 Public Records
- 2022-02-01 Sold (Public Records) $153,000 Public Records
- 2021-05-30 Listing Removed — Hive MLS
- 2021-05-24 Listed $64,400 Hive MLS
- 2019-10-30 Sold (Public Records) $80,000 Public Records
Property tax history
+8.2%/yrLatest (2025): $481 · +0.0% YoY. Source: county tax records.
Cash-flow waterfall
monthlySold comps — $/sqft
last 12 mo · ≤1 miLoading sold comps…