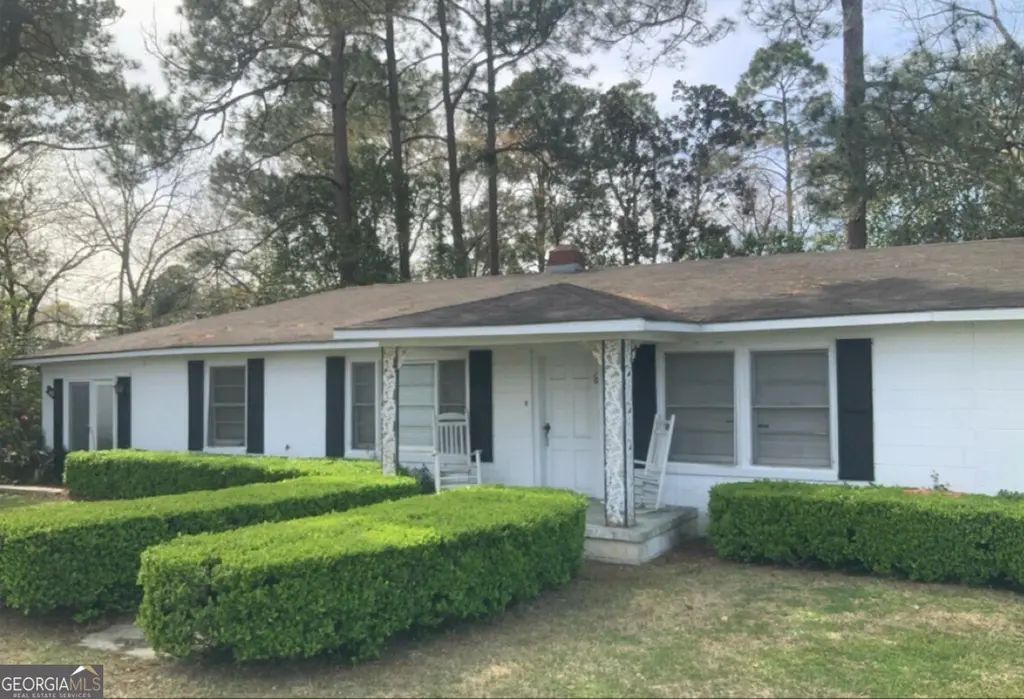
10 Bryant St · Statesboro, GA
Flood risk 1/10 · Minimal
- FEMA flood zone
- X (unshaded)
- Chance of flooding over 30 yrs
- 0.0%
- Est. flood insurance / yr
- $507 – $1,088
Fire risk 4/10 · Minor
- Est. fire insurance / yr
- $963 – $1,789
Heat risk 8/10 · Major
- Hot days now (above 110°F)
- 7 days/yr
- Hot days in 30 yrs
- 18 days/yr
Wind risk 8/10 · Major
- Chance of severe wind over 30 yrs
- 80.0%
Air-quality risk 1/10 · Minimal
- Unhealthy air days now
- 0 days/yr
- Unhealthy air days in 30 yrs
- 0 days/yr
Risk factors via First Street. Map © Google.
Why this score? — see what drove the C+ grade
The composite is a weighted blend of 9 inputs, each scored 0–100. Each bar is that input's sub-score; the figure is the points it added to the 100-point composite (weight × sub-score).
- Cash flow +27.8/30.0
- DSCR +9.8/10.0
- ARV discount +7.5/15.0
- 1% rule +6.6/10.0
- Livability +3.4/5.0
- Rent growth +2.9/5.0
- Schools +2.7/10.0
- Condition / age +2.5/5.0
- Appreciation +0.0/10.0
$150,000
🖨 Deal sheet (PDF) 📄 Offer letter ✓ Due diligence
Listing remarks
What a Deal! 1624 SF Home plus a small buildable lot located in the City Limits. Great Location for a Rental or Starter. Parcel Number S08000059000 Also Included with the Sale
Key facts
- Great location
- Small buildable lot
- 0.27 acre lot
Tags
Neighborhood map
What this means for you Summary
Snapshot
- This is a 3-bed/2.0-bath other listed at $150k.
Deal economics
- At list price, monthly cash flow is $458 ($5k/yr) — positive.
- The deal already cash-flows at list — no discount required.
- Meets the 1% rule at list price ($2k rent vs $150k).
- Cap rate 10.0% vs local median 3.6% in Statesboro — top-decile yield for the area; either an underpriced asset or a hidden risk that comps aren't pricing in. Stress-test before assuming the spread holds.
Location & tenants
- Location reads 68/100 on livability (#151 in GA) — a middle-class / working-renter tenant base. Strengths: cost of living A+, health & safety A+, housing B+; Watch: amenities C-, crime D+, commute F.
- Bulloch County (rural): math 32% / reading 33% proficiency, ranked #85 of 174 in GA (top 49%) — families likely to look elsewhere, expect single-tenant / working-renter base with shorter leases.
- Zoned schools: Julia P. Bryant Elementary School (math 43% / reading 39%, grade F, #411 of 1,228 statewide, top 34%, 748 students, 52% FRL); William James Middle School (math 27% / reading 39%, grade F, #213 of 470 statewide, top 47%, 577 students, 66% FRL); Statesboro High School (math 15% / reading 12%, grade F, #325 of 424 statewide, top 78%, 1,760 students, 63% FRL).
- Market conditions: Rents rising (+1.6%/yr); 335 active listings in the ZIP; 12 comparable units currently listed for rent nearby; rentals lingering (median 44d on market — plan ~5-8 weeks vacancy on turnover, expect pricing pressure); 100% of comp listings sitting > 30 days — soft ceiling on asking rent; 668 units permitted in Bulloch County in 2024 (6 in 5+ unit buildings).
- This rent runs 40% of the median local income ($52k/yr) — at the standard rent-burdened threshold; future hikes will face affordability resistance.
Forward outlook
- Local home prices are declining (-3.0%/yr); year-one equity from $1k of loan paydown is wiped out by about $4k of value loss. Plan a longer hold.
- Bulloch County population projected at +18% by 2050 — long-run rental-demand tailwind backs the buy-and-hold thesis.
Negotiation context
- Only 10 days on market — expect competitive offers; lowballing is unlikely to land.
Risks & watch-outs
- Watch-outs: built in 1958 — expect roof / HVAC / electrical / plumbing capex.
- Climate carrying-cost: severe wind risk, 80% chance of damaging wind over 30y; extreme-heat days projected 7→18/yr by 2055 (HVAC capex compounding) — expect insurance premiums to compound above CPI over the hold.
Questions for the listing agent
- Built in 1958 — when were the roof, HVAC, electrical panel, plumbing, and water heater last replaced?
- Is there a deadline driving the sale (1031 exchange, divorce, estate, relocation)? That informs how much negotiation room exists.
- Schools are D-rated, which usually means shorter tenancies and higher turnover. Who's the typical renter profile here, and what's been the actual vacancy rate?
- Crime grade is D in this area — have there been break-ins, vandalism, or insurance claims at this property in the last 3 years? What carrier currently insures it and at what premium?
- What's the average days-on-market for RENTAL listings here right now (not sales)? A rising rental-DOM trend means longer vacancies and softer asking-rent achievability than the comps imply.
- What's the recent tenant-quality profile in this submarket — average credit score on applications, eviction rate, late-payment / NSF rate, and stable-employment percentage? A property-management company in the area should have these aggregated.
- How much new for-sale + rental construction is in the pipeline within 1–3 miles? Heavy new supply typically softens prices + rents 12–24 months out; constrained supply supports both.
Investment metrics
- 1% rule
- 1.16% ✓
- Cap rate
- 9.95%
- Cash-on-cash
- 13.07%
- DSCR
- 1.58
- GRM
- 7.2
CMA / ARV
No comps found within radius.
Projected returns pro-forma
-3.0% appreciation · 1.62% rent growth · sell at horizon
- IRR
- 1.5%
- Equity multiple
- 1.06×
- Total profit
- $2,406
- Equity at exit
- $22,365
- IRR
- 9.8%
- Equity multiple
- 1.71×
- Total profit
- $29,918
- Equity at exit
- $12,969
Cash invested: $42,000 (down + closing). Projections, not guarantees.
Landlord ↔ Tenant lean methodology
- Overall (STATE)
- 90 Strongly Landlord-Friendly
- State Georgia
- 90 Strongly Landlord-Friendly · R+3
- County
- — inherits STATE
- City
- — inherits STATE
ZIP-level market 30458
- Home prices YoY
- -32.1%
- Rents YoY
- 1.6%
- Active inventory
- 335
- Price-to-rent
- 7.2×
Monthly cashflow live
- Estimated rent
- $1,740 high interval (Pro) →
- Mortgage (P&I)
- −$787
- Tax from tax record
- −$68 /mo · $817/yr
- Insurance
- −$62
- HOA
- −$0
- Vacancy / Maint / Mgmt
- −$365
- Net cashflow
- $458
Break-even live
Sensitivity live
| Price | -10% $542 | -5% $500 | +0% $458 | +5% $415 | +10% $373 |
|---|---|---|---|---|---|
| Rent | -10% $320 | -5% $389 | +0% $458 | +5% $526 | +10% $595 |
| Rate | -1.0pp $533 | -0.5pp $496 | base $458 | +0.5pp $419 | +1.0pp $379 |
UW: 25.0% down · 7.5% · 30yr · 1.5% tax · 5.0% vac · 8.0% maint · 8.0% mgmt
Financing live
Cash to close
- Down payment
- $37,500
- Closing costs
- $4,500
- Reserves months
- —
- Total cash needed
- —
Loan-product check · same deal, 3 products live
Conventional
25% down · 7.5% · 30yr
- Down + closing
- —
- Monthly P&I
- —
- Monthly cashflow
- —
- DSCR
- —
- Eligible?
- —
Personal DTI + credit; lowest rate.
DSCR
20% down · 8.5% · 30yr
- Down + closing
- —
- Monthly P&I
- —
- Monthly cashflow
- —
- DSCR
- —
- Eligible?
- —
No personal income docs; deal must DSCR.
Hard money
10% down · 12.0% · 12mo
- Down + closing
- —
- Monthly P&I
- —
- Monthly cashflow
- —
- DSCR
- —
- Eligible?
- —
Short-term bridge; refi at stabilization.
Rent comps 12 comps
| Address | Beds | Baths | Sqft | Rent | $/sqft | DOM | Units | Dist |
|---|---|---|---|---|---|---|---|---|
| 522 Miller Street Ext Statesboro, GA | 1.0–3.0 | 1.5–2.5 | 1165 | $3,201 | $2.75 | 44d | 9 | 0.65mi |
| 148 Buckhaven Way Unit 148 Statesboro, GA | 2.0 | 2.0 | 1092 | $1,350 | $1.24 | 44d | 1 | 0.79mi |
| 192 Zetterower Rd Statesboro, GA | 3.0 | 2.0 | 1125 | $1,750 | $1.56 | 44d | 1 | 0.82mi |
| 187 Buckhaven Way Statesboro, GA | 2.0 | 2.0 | 1082 | $1,300 | $1.20 | 44d | 1 | 0.84mi |
| 199 Zetterower Rd Statesboro, GA | 4.0 | 2.0 | 1600 | $2,000 | $1.25 | 44d | 1 | 0.86mi |
| 206 E Grady St Statesboro, GA | 4.0 | 3.0 | 1973 | $1,950 | $0.99 | 44d | 1 | 1.22mi |
| 414 Zetterower Rd Unit B Statesboro, GA | 2.0 | 1.0 | 1100 | $1,400 | $1.27 | 44d | 1 | 1.27mi |
| 103 Pearson Ln Statesboro, GA | 3.0 | 2.5 | 1520 | $1,650 | $1.09 | 44d | 1 | 1.41mi |
| 193 Braxton Blvd Statesboro, GA | 3.0 | 2.0 | 1565 | $1,850 | $1.18 | 44d | 1 | 1.45mi |
| 197 Braxton Blvd Statesboro, GA | 3.0 | 2.0–2.5 | 1517 | $1,825 | $1.20 | 44d | 13 | 1.45mi |
| 190 Braxton Blvd Statesboro, GA | 3.0 | 2.0 | 1565 | $1,900 | $1.21 | 44d | 1 | 1.47mi |
| 177 Braxton Blvd Statesboro, GA | 3.0 | 2.0 | 1565 | $1,850 | $1.18 | 44d | 1 | 1.48mi |
Listing history 2 events
-
2026-04-13status Under Contract
-
2026-04-01$150,000 New
ⓘ Source: listings_history table (triggers on properties + properties_extension) + one-shot
backfill from property_details.listing_events for pre-trigger history.
Tax reassessment forecast GA · Resets to sale price
- Current annual tax
- $817 · $68/mo
- Projected year-2 tax
- $1,380 · $115/mo
- Expected delta
- +$563/yr (+$47/mo · 68.9%)
ⓘ Screening estimate from a state-policy table — verify with the county assessor before closing.
Climate risk First Street
- Flood 1/10 Low FEMA zone X (unshaded) · 0% chance over 30 yrs
- Wildfire 4/10 Moderate
- Heat 8/10 Severe 7 d/yr ≥110°F today · 18 d/yr by 30 yrs out
- Wind 8/10 Severe 80% chance of damaging wind over 30 yrs
- Air quality 1/10 Low 0 unhealthy d/yr today · 0 by 30 yrs out
Nearby sold comps map
Loading sold comps map…
Walkable amenities ~0.75 mi
Loading nearby amenities…
Taxation est. · year 1
- Rental income
- $20,883
- − Mortgage interest
- −$8,402
- − Property taxes
- −$817
- − Insurance
- −$750
- − Repairs & maintenance
- −$1,671
- − Management
- −$1,671
- − Depreciation
- −$4,364
- Taxable income
- $3,209
- Est. tax owed @ 24.0%
- −$770
- After-tax cash flow
- $4,721/yr
For passive investors: Depreciation is non-cash, so a rental often shows a tax loss while cash-flowing — sheltering income. Rental losses are passive: they offset passive income freely, and up to $25,000/yr can offset ordinary (W-2) income if you actively participate and your MAGI is under $100k (phasing out to $0 by $150k); unused losses carry forward. On sale, claimed depreciation is recaptured at up to 25%, and gains may owe capital-gains tax (a 1031 exchange can defer both). Figures are a year-1 estimate at your 24.0% rate — not tax advice; consult a CPA.
Schools (NCES district)
- District
- Bulloch County
- NCES district ID
- 1300630
- Math proficiency
- 32% ▼ -11.00%
- Reading proficiency
- 33% ▼ -8.00%
- Median HH income
- $36,335
- Composite
- 26.97/100
- National rank
- #7074
- State rank
- #85 of 174 in GA
Livability — Statesboro
- Score
- 68/100
- State rank
- #151
- US rank
- #9809
Category grades
Schools grade is shown separately in the Schools card above.
Census & demographics
- Census place
- Statesboro, GA
- County
- Bulloch County · 73,507 people
- City population
- 67,164
- Metro
- Statesboro, GA
- Population (ZIP)
- 49,717
- Household income
- $52,038
- Rent vs Own
- Severe rent burden
- 3020.0
Population outlook (Bulloch County) Hauer SSP2
- Today (2025)
- 79,935 people
- By 2030
- 83,796 · +4.8%
- By 2040
- 89,717 · +12.2%
- By 2050
- 94,558 · +18.3%
- By 2075
- 104,376 · +30.6%
- By 2100
- 112,857 · +41.2%
Race, ethnicity, and origin ACS 2023
- Neighborhood character
- Diverse neighborhood (Simpson 0.58)
- Race & ethnicity
- White 53% Black 36% Two or more races 6% Hispanic / Latino 5% Asian 2%
- Hispanic origin (detail)
- Mexican 2% Puerto Rican 1%
- Common ancestry
- Italian 2% Slovak 1% Romanian 1%
- Foreign-born
- 4% · Canada
- Languages at home
- 94% English-only · Spanish 3%
Political lean MEDSL · Bulloch
- 2024 margin
- Strong R (+29.0) · D 35.3% · R 64.3%
- 2008→2024 swing
- -9.8pp toward R · 2008: -19.2pp · 2024: -29.0pp
- All cycles
- 2024: R+29.0 2020: R+23.7 2016: R+23.4 2012: R+19.1 2008: R+19.2
Not yet ingested
- Civics
- —
Market trends
- HPI YoY
- ▼ -95.47%
- Current HPI
- 201.6684
- Rent YoY
- ▲ 1.62%
- Metro
- Statesboro, GA
- State GDP YoY
- ▲ 2.66%
- F500 in state
- 28
Industry mix (Fortune 500 HQ in GA)
| Industry | F500 HQs | Revenue |
|---|---|---|
| Paper / Packaging | 2 | $29B |
|
||
| Retail | 1 | $160B |
|
||
| Transportation / Logistics | 1 | $91B |
|
||
| Airlines | 1 | $62B |
|
||
| Consumer Goods | 1 | $47B |
|
||
| Utilities | 1 | $25B |
|
||
Price history
2 events — show timeline
- 2026-04-13 Pending — GAMLS
- 2026-04-01 Listed $150,000 GAMLS
Property tax history
+10.4%/yrLatest (2025): $817 · +35.1% YoY. Source: county tax records.
Cash-flow waterfall
monthlySold comps — $/sqft
last 12 mo · ≤1 miLoading sold comps…