1816 County Road 2386 · Winnsboro, TX
Flood risk 1/10 · Minimal
- FEMA flood zone
- X (unshaded)
- Chance of flooding over 30 yrs
- 0.0%
- Est. flood insurance / yr
- $507 – $1,088
Fire risk 4/10 · Minor
- Est. fire insurance / yr
- $1,222 – $2,270
Heat risk 7/10 · Major
- Hot days now (above 111°F)
- 7 days/yr
- Hot days in 30 yrs
- 24 days/yr
Wind risk 6/10 · Moderate
- Chance of severe wind over 30 yrs
- 27.0%
Air-quality risk 2/10 · Minimal
- Unhealthy air days now
- 0 days/yr
- Unhealthy air days in 30 yrs
- 1 days/yr
Risk factors via First Street. Map © Google.
Why this score? — see what drove the B grade
The composite is a weighted blend of 9 inputs, each scored 0–100. Each bar is that input's sub-score; the figure is the points it added to the 100-point composite (weight × sub-score).
- Cash flow +30.0/30.0
- DSCR +10.0/10.0
- 1% rule +9.0/10.0
- ARV discount +7.5/15.0
- Appreciation +5.9/10.0
- Livability +3.5/5.0
- Schools +3.3/10.0
- Rent growth +2.5/5.0
- Condition / age +2.5/5.0
$133,000
🖨 Deal sheet (PDF) 📄 Offer letter ✓ Due diligence
Listing remarks
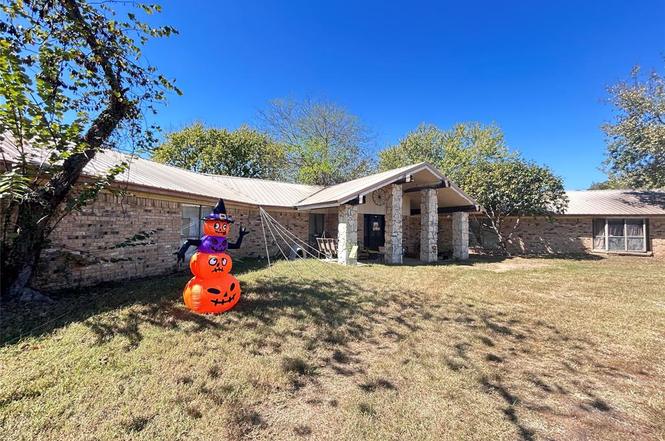
MOTIVATED SELLERS!!! Discover the potential of this spacious three-bedroom, three-bath home situated on 3 peaceful acres. A circle driveway provides easy access to the property, which features two septic systems and water co-op service. Built on a slab foundation with a durable metal roof, this home offers a solid starting point for restoration. Inside, the entry opens to a generous foyer leading to a comfortable living area. The split floor plan separates the common living spaces from the private bedroom wing. The large primary suite includes an ensuite bath with dual walk-in closets, a soaking tub, separate shower, dual sinks, and an expansive vanity area. The kitchen offers abundant cabi
Key facts
- 1.89 acre lot
- Built 1980
- Listed 123 days
Property features AI
Finance
- Other: Lot approximately 1.885 acres; Will not subdivide
- Financial info: Listing terms: Cash or Conventional
- HOA & community: No homeowners association
Exterior
- Parking: Circular driveway
- Utilities: Co-op electric; Co-op water; Electricity connected; Septic; Outside city limits; Gravel/rock access; Other utilities
- Home design: Single-family residence; One story; Residential property; Property not attached
- Construction: Built in 1980; Brick and rock/stone exterior; Metal roof; Slab foundation
- Exterior features: Acreage lot; Utilities easement; Other exterior features
Interior
- Kitchen: Dishwasher; Disposal; Electric cooktop; Electric double oven; Ice maker
- Bedrooms: 3 bedrooms (all on main level)
- Flooring: Concrete; Laminate; Tile
- Bathrooms: 3 full bathrooms
- Heating & cooling: Central heating (electric); Central air (electric); Ceiling fans
- Interior features: Open floorplan; Kitchen island; Wet bar; Other
- Laundry & utility: Washer hookup; Electric dryer hookup; Utility room
Neighborhood map
What this means for you Summary
Snapshot
- This is a 3-bed/3.0-bath other listed at $133k.
Deal economics
- At list price, monthly cash flow is $553 ($7k/yr) — positive.
- The deal already cash-flows at list — no discount required.
- Meets the 1% rule at list price ($2k rent vs $133k).
- Recommended offer: $117k (12.0% below list) — sets the bar for market timing.
- Cap rate 11.3% vs local median 3.8% in Winnsboro — top-decile yield for the area; either an underpriced asset or a hidden risk that comps aren't pricing in. Stress-test before assuming the spread holds.
Location & tenants
- Location reads 69/100 on livability (#416 in TX) — a middle-class / working-renter tenant base. Strengths: cost of living A+, housing A+, crime B; Watch: employment D+, amenities F, commute F.
- Como-Pickton CISD (rural): math 39% / reading 39% proficiency, ranked #441 of 826 in TX (top 53%) — families likely to look elsewhere, expect single-tenant / working-renter base with shorter leases; 61% free/reduced lunch — lower-income household profile, screen leases tightly.
- Market conditions: 14 active listings in the ZIP; 66 units permitted in Hopkins County in 2024 (0 in 5+ unit buildings).
Forward outlook
- In year one you build about $3k of equity ($920 loan paydown + $2k appreciation (1.7% local appreciation)).
- Hopkins County population projected at +6% by 2050 — modest demand growth; plan on rents tracking national, not racing it.
- At projected returns (1.7% appreciation + 3.0% rent growth), your $37k cash investment doubles in ~4 years — after that, you're playing with house money.
- By year 10, paydown + projected appreciation supports a ~$32k cash-out refi (75% LTV) — recoverable capital for the next deal without selling this one.
Negotiation context
- It's been on market 123 days — a 12% lower offer ($117k) is reasonable based on typical stale-listing flexibility.
- 3 sale attempts; this cycle's ask has dropped $66k (33%) from the opening price — seller is motivated, your offer sets the floor, not the list.
Risks & watch-outs
- Climate carrying-cost: major wind risk, 27% chance of damaging wind over 30y; extreme-heat days projected 7→24/yr by 2055 (HVAC capex compounding) — expect insurance premiums to compound above CPI over the hold.
Questions for the listing agent
- It's been on market 123 days. Have you received any prior offers? Is the seller open to a 12% concession, seller financing, or rate buy-down credit?
- Why hasn't it sold? Are there any deal-killer items the seller is aware of (foundation, flood, title, zoning, code violations)?
- Is there a deadline driving the sale (1031 exchange, divorce, estate, relocation)? That informs how much negotiation room exists.
- What's the average days-on-market for RENTAL listings here right now (not sales)? A rising rental-DOM trend means longer vacancies and softer asking-rent achievability than the comps imply.
- What's the recent tenant-quality profile in this submarket — average credit score on applications, eviction rate, late-payment / NSF rate, and stable-employment percentage? A property-management company in the area should have these aggregated.
- How much new for-sale + rental construction is in the pipeline within 1–3 miles? Heavy new supply typically softens prices + rents 12–24 months out; constrained supply supports both.
Investment metrics
- 1% rule
- 1.40% ✓
- Cap rate
- 11.29%
- Cash-on-cash
- 17.83%
- DSCR
- 1.79
- GRM
- 5.9
CMA / ARV
No comps found within radius.
Projected returns pro-forma
1.7% appreciation · 3.0% rent growth · sell at horizon
- IRR
- 21.5%
- Equity multiple
- 2.14×
- Total profit
- $42,409
- Equity at exit
- $50,344
- IRR
- 23.7%
- Equity multiple
- 4.04×
- Total profit
- $113,299
- Equity at exit
- $70,904
Cash invested: $37,240 (down + closing). Projections, not guarantees.
Landlord ↔ Tenant lean methodology
- Overall (STATE)
- 87 Strongly Landlord-Friendly
- State Texas
- 87 Strongly Landlord-Friendly · R+5
- County
- — inherits STATE
- City
- — inherits STATE
ZIP-level market 75471
- Home prices YoY
- 1.8%
- Active inventory
- 14
- Price-to-rent
- 5.9×
Monthly cashflow live
- Estimated rent
- $1,864 medium interval (Pro) →
- Mortgage (P&I)
- −$697
- Tax est. 1.5%
- −$166 /mo · $1,995/yr
- Insurance
- −$55
- HOA
- −$0
- Vacancy / Maint / Mgmt
- −$391
- Net cashflow
- $553
Break-even live
Sensitivity live
| Price | -10% $645 | -5% $599 | +0% $553 | +5% $508 | +10% $462 |
|---|---|---|---|---|---|
| Rent | -10% $406 | -5% $480 | +0% $553 | +5% $627 | +10% $701 |
| Rate | -1.0pp $620 | -0.5pp $587 | base $553 | +0.5pp $519 | +1.0pp $484 |
UW: 25.0% down · 7.5% · 30yr · 1.5% tax · 5.0% vac · 8.0% maint · 8.0% mgmt
Financing live
Cash to close
- Down payment
- $33,250
- Closing costs
- $3,990
- Reserves months
- —
- Total cash needed
- —
Loan-product check · same deal, 3 products live
Conventional
25% down · 7.5% · 30yr
- Down + closing
- —
- Monthly P&I
- —
- Monthly cashflow
- —
- DSCR
- —
- Eligible?
- —
Personal DTI + credit; lowest rate.
DSCR
20% down · 8.5% · 30yr
- Down + closing
- —
- Monthly P&I
- —
- Monthly cashflow
- —
- DSCR
- —
- Eligible?
- —
No personal income docs; deal must DSCR.
Hard money
10% down · 12.0% · 12mo
- Down + closing
- —
- Monthly P&I
- —
- Monthly cashflow
- —
- DSCR
- —
- Eligible?
- —
Short-term bridge; refi at stabilization.
Listing history 9 events
-
2026-04-30status Pending
-
2026-04-06price $133,000
-
2026-03-13status Active
-
2026-01-11status Pending
-
2026-01-07price $150,000
-
2025-10-28$199,000 Active
-
2025-09-22historical
-
2025-03-19price $249,900
-
2025-03-19$300,000 Active
ⓘ Source: listings_history table (triggers on properties + properties_extension) + one-shot
backfill from property_details.listing_events for pre-trigger history.
Climate risk First Street
- Flood 1/10 Low FEMA zone X (unshaded) · 0% chance over 30 yrs
- Wildfire 4/10 Moderate
- Heat 7/10 Severe 7 d/yr ≥111°F today · 24 d/yr by 30 yrs out
- Wind 6/10 Major 27% chance of damaging wind over 30 yrs
- Air quality 2/10 Low 0 unhealthy d/yr today · 1 by 30 yrs out
Nearby sold comps map
Loading sold comps map…
Walkable amenities ~0.75 mi
Loading nearby amenities…
Taxation est. · year 1
- Rental income
- $22,369
- − Mortgage interest
- −$7,450
- − Property taxes
- −$1,995
- − Insurance
- −$665
- − Repairs & maintenance
- −$1,789
- − Management
- −$1,789
- − Depreciation
- −$3,869
- Taxable income
- $4,810
- Est. tax owed @ 24.0%
- −$1,155
- After-tax cash flow
- $5,487/yr
For passive investors: Depreciation is non-cash, so a rental often shows a tax loss while cash-flowing — sheltering income. Rental losses are passive: they offset passive income freely, and up to $25,000/yr can offset ordinary (W-2) income if you actively participate and your MAGI is under $100k (phasing out to $0 by $150k); unused losses carry forward. On sale, claimed depreciation is recaptured at up to 25%, and gains may owe capital-gains tax (a 1031 exchange can defer both). Figures are a year-1 estimate at your 24.0% rate — not tax advice; consult a CPA.
Schools (NCES district)
- District
- Como-Pickton CISD
- NCES district ID
- 4814880
- Math proficiency
- 39% ▼ -10.00%
- Reading proficiency
- 39% ▲ 1.00%
- Median HH income
- $44,477
- Composite
- 33.14/100
- National rank
- #5556
- State rank
- #441 of 826 in TX
Livability — Winnsboro
- Score
- 69/100
- State rank
- #416
- US rank
- #8564
Category grades
Schools grade is shown separately in the Schools card above.
Census & demographics
- Population (ZIP)
- 1,483
Population outlook (Hopkins County) Hauer SSP2
- Today (2025)
- 38,107 people
- By 2030
- 38,867 · +2.0%
- By 2040
- 40,009 · +5.0%
- By 2050
- 40,448 · +6.1%
- By 2075
- 40,669 · +6.7%
- By 2100
- 37,234 · -2.3%
Race, ethnicity, and origin ACS 2023
- Neighborhood character
- Majority White (54%)
- Race & ethnicity
- White 54% Hispanic / Latino 43% Two or more races 22% Asian 2%
- Hispanic origin (detail)
- Mexican 43%
- Common ancestry
- English 1% Iranian 1%
- Foreign-born
- 10% · Canada, Vietnam
- Languages at home
- 78% English-only · Spanish 19% Vietnamese 3% German/W. Germanic 1%
Political lean MEDSL · Hopkins
- 2024 margin
- Solid R (+64.6) · D 17.4% · R 82.0%
- 2008→2024 swing
- -20.0pp toward R · 2008: -44.7pp · 2024: -64.6pp
- All cycles
- 2024: R+64.6 2020: R+60.7 2016: R+60.8 2012: R+55.4 2008: R+44.7
Not yet ingested
- Civics
- —
Market trends
- HPI YoY
- ▲ 1.70%
- Current HPI
- 96.1162
- Rent YoY
- —
- Metro
- —
- State GDP YoY
- ▲ 3.95%
- F500 in state
- 110
Industry mix (Fortune 500 HQ in TX)
| Industry | F500 HQs | Revenue |
|---|---|---|
| Energy | 16 | $1,198B |
|
||
| Technology | 5 | $198B |
|
||
| Engineering / Construction | 4 | $72B |
|
||
| Energy Services | 3 | $60B |
|
||
| Utilities | 3 | $41B |
|
||
| Healthcare | 2 | $330B |
|
||
Price history
-55.7% since first listed9 events — show timeline
- 2026-04-30 Pending — NTREIS
- 2026-04-06 Price Changed $133,000 NTREIS
- 2026-03-13 Relisted — NTREIS
- 2026-01-11 Pending — NTREIS
- 2026-01-07 Price Changed $150,000 NTREIS
- 2025-10-28 Listed $199,000 NTREIS
- 2025-09-22 Listing Removed — HARMLS
- 2025-03-19 Price Changed $249,900 HARMLS
- 2025-03-19 Listed $300,000 HARMLS
Property tax history
-3.9%/yrLatest (2022): $100 · -7.3% YoY. Source: county tax records.
Cash-flow waterfall
monthlySold comps — $/sqft
last 12 mo · ≤1 miLoading sold comps…