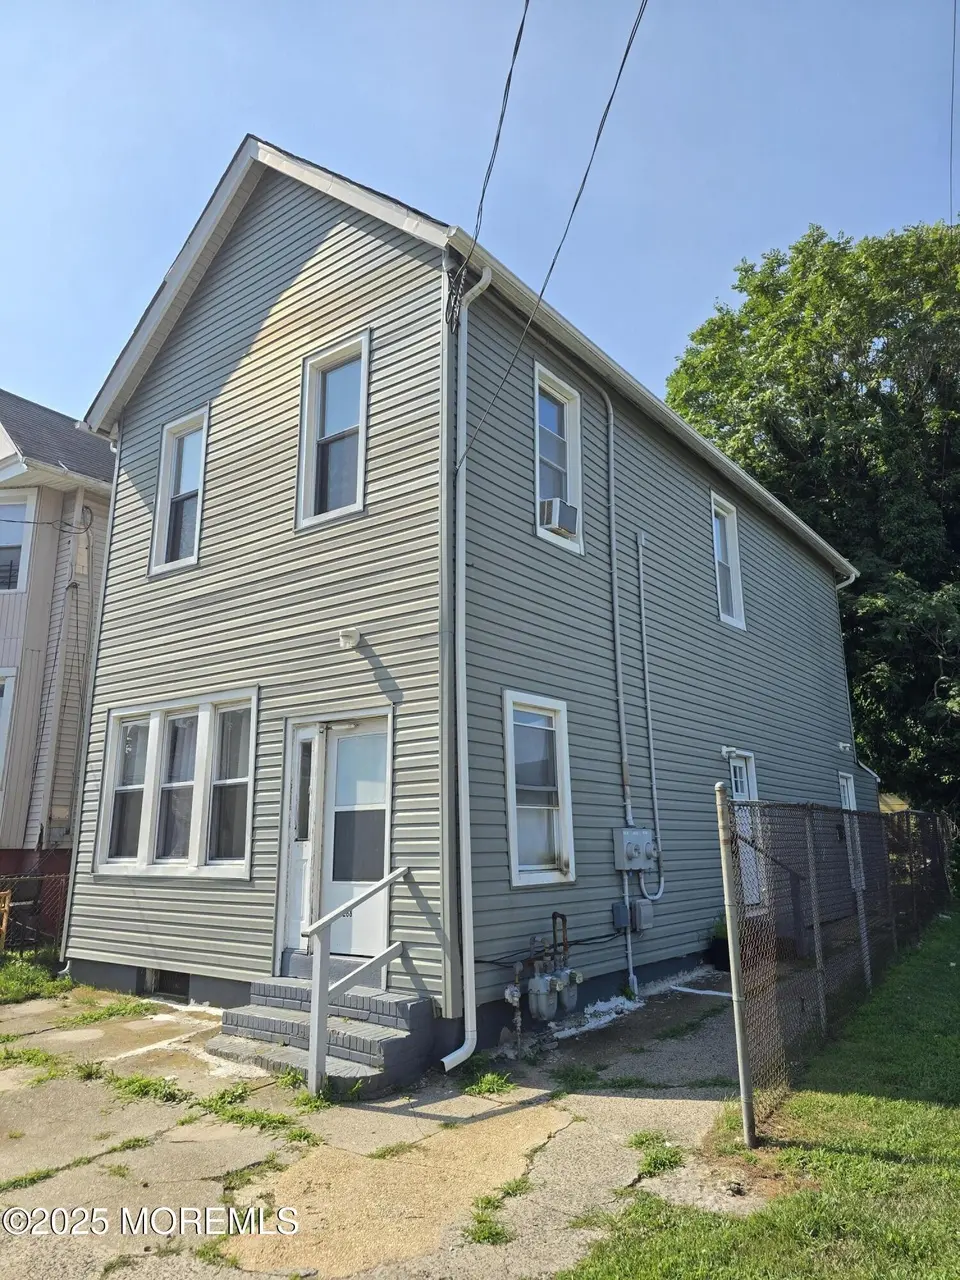
288 Morris Ave · Long Branch, NJ
Flood risk 6/10 · Moderate
- FEMA flood zone
- X (unshaded)
- Chance of flooding over 30 yrs
- 0.73%
- Est. flood insurance / yr
- $473 – $860
Fire risk 1/10 · Minimal
- Est. fire insurance / yr
- $526 – $976
Heat risk 7/10 · Major
- Hot days now (above 93°F)
- 7 days/yr
- Hot days in 30 yrs
- 16 days/yr
Wind risk 8/10 · Major
- Chance of severe wind over 30 yrs
- 80.0%
Air-quality risk 3/10 · Minor
- Unhealthy air days now
- 3 days/yr
- Unhealthy air days in 30 yrs
- 4 days/yr
Risk factors via First Street. Map © Google.
Why this score? — see what drove the C- grade
The composite is a weighted blend of 9 inputs, each scored 0–100. Each bar is that input's sub-score; the figure is the points it added to the 100-point composite (weight × sub-score).
- Cash flow +18.3/30.0
- ARV discount +15.0/15.0
- DSCR +5.7/10.0
- 1% rule +4.5/10.0
- Livability +3.6/5.0
- Rent growth +3.5/5.0
- Condition / age +2.5/5.0
- Schools +1.5/10.0
- Appreciation +0.0/10.0
$649,999
🖨 Deal sheet 📄 Offer letter ✓ Due diligence
Listing remarks MLS
Two family property near all the redevelopment in Long Branch. This home has a great rent roll and the first floor unit was recently renovated with new kitchen, bathroom and floors. Great tenants in place and ready for the new owner.
Key facts
- Listed 168 days
Neighborhood map
What this means for you Summary
Snapshot
- This is a 4-bed/2.0-bath single-family listed at $650k.
Deal economics
- At list price, monthly cash flow is $589 ($7k/yr) — positive.
- The deal already cash-flows at list — no discount required.
- To meet the 1% rule (rent ≥ 1% of price), the offer needs to be $617k (5.1% below list).
- Recommended offer: $572k (12.0% below list) — sets the bar for market timing.
- Cap rate 7.4% vs local median 0.3% in Long Branch — top-decile yield for the area; either an underpriced asset or a hidden risk that comps aren't pricing in. Stress-test before assuming the spread holds.
Location & tenants
- Location reads 71/100 on livability (#243 in NJ) — a middle-class / working-renter tenant base. Strengths: health & safety A-; Watch: amenities C-, schools D+, cost of living F.
- Long Branch Public School District (suburban): math 8% / reading 26% proficiency, ranked #445 of 472 in NJ (top 94%) — low school quality limits family demand, transient renter base, plan for 1-2y turnover; 70% free/reduced lunch — lower-income household profile, screen leases tightly.
- Market conditions: Rents rising (+3.9%/yr); 247 active listings in the ZIP; 27 comparable units currently listed for rent nearby; rentals leasing fast (median 8d on market — plan ~1-2 weeks tenant-placement turnaround); solid renter incomes; 2,840 units permitted in Monmouth County in 2024 (484 in 5+ unit buildings).
- At $6,167/mo this rent would consume 93% of the median local household income ($80k/yr) (locally 2347% of renters already pay >50% of income on rent) — very limited rent-growth headroom before tenants either downsize or default.
Forward outlook
- Local home prices are declining (-3.0%/yr); year-one equity from $4k of loan paydown is wiped out by about $20k of value loss. Plan a longer hold.
- Monmouth County population projected at -11% by 2050 — secular population decline; favor cash flow + early exit over multi-decade hold.
Negotiation context
- It's been on market 168 days — a 12% lower offer ($572k) is reasonable based on typical stale-listing flexibility.
- 3 sale attempts with the ask held roughly flat each time — persistent listings suggest the price (not the market) is what's stuck; bring a comps-based counter.
- Current owner paid $200k; list at $650k implies a 225% gain — meaningful room to come down on a strong offer.
Risks & watch-outs
- Watch-outs: built in 1905 — expect roof / HVAC / electrical / plumbing capex.
- Climate carrying-cost: major flood risk; severe wind risk, 80% chance of damaging wind over 30y; extreme-heat days projected 7→16/yr by 2055 (HVAC capex compounding) — expect insurance premiums to compound above CPI over the hold.
Questions for the listing agent
- It's been on market 168 days. Have you received any prior offers? Is the seller open to a 12% concession, seller financing, or rate buy-down credit?
- Built in 1905 — when were the roof, HVAC, electrical panel, plumbing, and water heater last replaced?
- Why hasn't it sold? Are there any deal-killer items the seller is aware of (foundation, flood, title, zoning, code violations)?
- Is there a deadline driving the sale (1031 exchange, divorce, estate, relocation)? That informs how much negotiation room exists.
- Schools are D-rated, which usually means shorter tenancies and higher turnover. Who's the typical renter profile here, and what's been the actual vacancy rate?
- What's the average days-on-market for RENTAL listings here right now (not sales)? A rising rental-DOM trend means longer vacancies and softer asking-rent achievability than the comps imply.
- What's the recent tenant-quality profile in this submarket — average credit score on applications, eviction rate, late-payment / NSF rate, and stable-employment percentage? A property-management company in the area should have these aggregated.
- How much new for-sale + rental construction is in the pipeline within 1–3 miles? Heavy new supply typically softens prices + rents 12–24 months out; constrained supply supports both.
Investment metrics
- 1% rule
- 0.95% ✗
- Cap rate
- 7.38%
- Cash-on-cash
- 3.89%
- DSCR
- 1.17
- GRM
- 8.8
CMA / ARV
- ARV (median comp)
- $858,346
- List price
- $649,999
- Delta
- -24.27%
- Verdict
- UNDERPRICED
- Comps
- 20 within 1.0 mi
Show comp detail 12 sales within ~0.75 mi
| Address | Dist | Beds/Ba | Sqft | Sold | Price | $/sf | Match |
|---|---|---|---|---|---|---|---|
| 399 Willow Ave | 0.25mi | 3/2.0 (-1) | 1,568 (+3%) | 4mo | $328,000 | $209 | 75 |
| 298 Poole Ave | 0.12mi | 4/1.0 | 1,392 (-8%) | 5mo | $525,000 | $377 | 72 |
| 428 Willow Ave | 0.32mi | 4/1.5 | 1,566 (+3%) | 12mo | $509,000 | $325 | 68 |
| 537 Winter St | 0.47mi | 3/2.0 (-1) | 1,498 (-2%) | 7mo | $499,000 | $333 | 64 |
| 304 Hillside Ave | 0.10mi | 4/2.0 | 1,729 (+14%) | 10mo | $400,000 | $231 | 64 |
| 14 Slocum Pl | 0.38mi | 3/1.0 (-1) | 1,440 (-5%) | 4mo | $357,000 | $248 | 61 |
| 23 Woolley Ave | 0.61mi | 3/2.0 (-1) | 1,497 (-2%) | 3mo | $575,000 | $384 | 61 |
| 441 Division St | 0.28mi | 3/2.0 (-1) | 1,332 (-12%) | 11mo | $575,000 | $432 | 52 |
| 214 Cleveland Ave | 0.26mi | 3/2.0 (-1) | 1,742 (+14%) | 10mo | $618,000 | $355 | 50 |
| 127 7th Ave | 0.70mi | 3/1.0 (-1) | 1,476 (-3%) | 8mo | $550,000 | $373 | 46 |
| 61 Pavilion Ave | 0.48mi | 3/1.5 (-1) | 1,704 (+12%) | 6mo | $1,125,000 | $660 | 45 |
| 42 Dudley St | 0.47mi | 4/1.5 | 1,734 (+14%) | 11mo | $475,000 | $274 | 44 |
Match score weights: distance 35% · size 25% · config 20% · recency 20%. Top-matched comps best support the ARV.
Projected returns pro-forma
-3.0% appreciation · 3.91% rent growth · sell at horizon
- IRR
- -9.2%
- Equity multiple
- 0.66×
- Total profit
- $-62,127
- Equity at exit
- $96,917
- IRR
- 1.3%
- Equity multiple
- 1.10×
- Total profit
- $17,911
- Equity at exit
- $56,200
Cash invested: $182,000 (down + closing). Projections, not guarantees.
Landlord ↔ Tenant lean methodology
- Overall (STATE)
- 21 Tenant-Leaning
- State New Jersey
- 21 Tenant-Leaning · D+6
- County
- — inherits STATE
- City
- — inherits STATE
ZIP-level market 07740
- Rents YoY
- 3.9%
- Active inventory
- 247
- Price-to-rent
- 8.8×
Monthly cashflow live
- Estimated rent
- $6,167 high interval (Pro) →
- Mortgage (P&I)
- −$3,409
- Tax from tax record
- −$603 /mo · $7,239/yr
- Insurance
- −$271
- HOA
- −$0
- Vacancy / Maint / Mgmt
- −$1,295
- Net cashflow
- $589
Break-even live
UW: 25.0% down · 7.5% · 30yr · 1.5% tax · 5.0% vac · 8.0% maint · 8.0% mgmt
Financing live
Cash to close
- Down payment
- $162,500
- Closing costs
- $19,500
- Reserves months
- —
- Total cash needed
- —
Loan-product check · same deal, 3 products live
Conventional
25% down · 7.5% · 30yr
- Down + closing
- —
- Monthly P&I
- —
- Monthly cashflow
- —
- DSCR
- —
- Eligible?
- —
Personal DTI + credit; lowest rate.
DSCR
20% down · 8.5% · 30yr
- Down + closing
- —
- Monthly P&I
- —
- Monthly cashflow
- —
- DSCR
- —
- Eligible?
- —
No personal income docs; deal must DSCR.
Hard money
10% down · 12.0% · 12mo
- Down + closing
- —
- Monthly P&I
- —
- Monthly cashflow
- —
- DSCR
- —
- Eligible?
- —
Short-term bridge; refi at stabilization.
Rent comps 27 comps
| Address | Beds | Baths | Sqft | Rent | $/sqft | DOM | Units | Dist |
|---|---|---|---|---|---|---|---|---|
| 179 Chelsea Ave Long Branch, NJ | 2.0–3.0 | 2.0 | 1115 | $5,300 | $4.75 | 1d | 6 | 0.36mi |
| 8 Arthur Ave Long Branch, NJ | 3.0 | 2.0 | 1648 | $7,000 | $4.25 | 18d | 1 | 0.52mi |
| 44 Norwood Ave Long Branch, NJ | 3.0 | 1.0 | 1226 | $3,275 | $2.67 | 12d | 1 | 0.58mi |
| 50 Chelsea Ave Long Branch, NJ | 3.0 | 1.0–2.0 | 1118 | $6,286 | $5.62 | 1d | 34 | 0.64mi |
| 350 Ocean Ave #403 Long Branch, NJ | 3.0 | 3.0 | 1751 | $20,000 | $11.42 | 7d | 1 | 0.64mi |
| 376 W End Ave Long Branch, NJ | 2.0–3.0 | 1.0 | 1720 | $2,695 | $1.57 | 7d | 5 | 0.66mi |
| 351 Hollywood Ave Long Branch, NJ | 3.0 | 2.0 | 1590 | $5,300 | $3.33 | 1d | 1 | 0.81mi |
| 190 Spruce St #10 Long Branch, NJ | 4.0 | 1.5 | 1690 | $3,200 | $1.89 | 17d | 1 | 0.86mi |
| 221 Brighton Ave #201 Long Branch, NJ | 3.0 | 2.5 | 1768 | $38,000 | $21.49 | 24d | 1 | 0.88mi |
| 23 Hilltop Rd West Long Branch, NJ | 3.0 | 2.0 | 1488 | $28,000 | $18.82 | 17d | 1 | 0.88mi |
| 607 McClellan St Long Branch, NJ | 3.0 | 1.5 | 1344 | $25,000 | $18.60 | 10d | 1 | 0.93mi |
| 607 McClellan St Long Branch, NJ | 3.0 | 2.5 | 1344 | $4,200 | $3.12 | 1d | 1 | 0.93mi |
| 132 Sampson Pl Long Branch, NJ | 4.0 | 2.0 | 1570 | $9,500 | $6.05 | 24d | 1 | 1.11mi |
| 121 Riviera Dr Long Branch, NJ | 3.0 | 2.5 | 2080 | $3,400 | $1.63 | 2d | 1 | 1.12mi |
| 45 Cedar Ave Unit B Long Branch, NJ | 3.0 | 1.0 | 1788 | $22,000 | $12.30 | 4d | 1 | 1.16mi |
| 126 Elmwood Ave Long Branch, NJ | 3.0 | 3.0 | 2160 | $20,000 | $9.26 | 24d | 1 | 1.21mi |
| 295 Jersey Ave Long Branch, NJ | 5.0 | 3.0 | 2176 | $75,000 | $34.47 | 24d | 1 | 1.23mi |
| 70 Maryland Ave West Long Branch, NJ | 3.0 | 1.5 | 1168 | $2,400 | $2.05 | 1d | 1 | 1.25mi |
| 68 Berry Pl Long Branch, NJ | 3.0 | 2.0 | 1428 | $3,200 | $2.24 | 2d | 1 | 1.27mi |
| 17 Walnut Pl West Long Branch, NJ | 4.0 | 2.0 | 1761 | $4,500 | $2.56 | 1d | 1 | 1.29mi |
| 81 Berry Pl Long Branch, NJ | 4.0 | 1.5 | 1562 | $12,000 | $7.68 | 24d | 1 | 1.30mi |
| 132 Chelton Ave Long Branch, NJ | 4.0 | 2.5 | 1828 | $3,900 | $2.13 | 7d | 1 | 1.32mi |
| 36 Community Dr West Long Branch, NJ | 4.0 | 2.0 | 2202 | $42,000 | $19.07 | 22d | 1 | 1.32mi |
| 329 Yorke Ave Long Branch, NJ | 4.0 | 2.0 | 1195 | $44,000 | $36.82 | 22d | 1 | 1.35mi |
| 479 Cedar Ave West Long Branch, NJ | 3.0 | 1.5 | 1413 | $33,000 | $23.35 | 22d | 1 | 1.40mi |
| 125 Beechwood Ave West Long Branch, NJ | 4.0 | 2.0 | 1560 | $2,800 | $1.79 | 1d | 1 | 1.49mi |
| 153 Atlantic Ave Long Branch, NJ | 3.0 | 2.0 | 1500 | $3,675 | $2.45 | 7d | 1 | 1.49mi |
Listing history 26 events
-
2026-06-18days on market $649,999 Active 168 DOM
-
2026-06-17days on market $649,999 Active 167 DOM
-
2026-06-16days on market $649,999 Active 166 DOM
-
2026-06-15days on market $649,999 Active 165 DOM
-
2026-06-13days on market $649,999 Active 163 DOM
-
2026-06-13days on market $649,999 Active 162 DOM
-
2026-06-09days on market $649,999 Active 159 DOM
-
2026-06-08days on market $649,999 Active 158 DOM
-
2026-06-07days on market $649,999 Active 157 DOM
-
2026-06-04days on market $649,999 Active 154 DOM
-
2026-06-03days on market $649,999 Active 153 DOM
-
2026-06-02days on market $649,999 Active 152 DOM
-
2026-06-01days on market $649,999 Active 151 DOM
-
2026-05-31days on market $649,999 Active 150 DOM
-
2026-04-22status Active 234-char remark
Show marketing remark (234 chars)
Two family property near all the redevelopment in Long Branch. This home has a great rent roll and the first floor unit was recently renovated with new kitchen, bathroom and floors. Great tenants in place and ready for the new owner.
-
2026-03-19status Pending 234-char remark
Show marketing remark (234 chars)
Two family property near all the redevelopment in Long Branch. This home has a great rent roll and the first floor unit was recently renovated with new kitchen, bathroom and floors. Great tenants in place and ready for the new owner.
-
2026-03-18price $649,999 234-char remark
Show marketing remark (234 chars)
Two family property near all the redevelopment in Long Branch. This home has a great rent roll and the first floor unit was recently renovated with new kitchen, bathroom and floors. Great tenants in place and ready for the new owner.
-
2026-03-18status Active 234-char remark
Show marketing remark (234 chars)
Two family property near all the redevelopment in Long Branch. This home has a great rent roll and the first floor unit was recently renovated with new kitchen, bathroom and floors. Great tenants in place and ready for the new owner.
-
2025-08-15price $599,999 234-char remark
Show marketing remark (234 chars)
Two family property near all the redevelopment in Long Branch. This home has a great rent roll and the first floor unit was recently renovated with new kitchen, bathroom and floors. Great tenants in place and ready for the new owner.
-
2025-05-09$639,000 Active 234-char remark
Show marketing remark (234 chars)
Two family property near all the redevelopment in Long Branch. This home has a great rent roll and the first floor unit was recently renovated with new kitchen, bathroom and floors. Great tenants in place and ready for the new owner.
-
2025-05-03historical $639,000 234-char remark
Show marketing remark (234 chars)
Two family property near all the redevelopment in Long Branch. This home has a great rent roll and the first floor unit was recently renovated with new kitchen, bathroom and floors. Great tenants in place and ready for the new owner.
-
2015-10-01soldstatus $200,000
-
1998-12-28soldstatus $71,800
-
1997-11-17soldstatus $39,000
-
1987-11-20soldstatus $102,000
-
1985-02-01soldstatus $40,000
ⓘ Source: listings_history table (triggers on properties + properties_extension) + one-shot
backfill from property_details.listing_events for pre-trigger history.
Tax reassessment forecast NJ · Partial reset (capped growth)
- Current annual tax
- $7,239 · $603/mo
- Projected year-2 tax
- $11,712 · $976/mo
- Expected delta
- +$4,473/yr (+$373/mo · 61.8%)
ⓘ Screening estimate from a state-policy table — verify with the county assessor before closing.
Climate risk First Street
- Flood 6/10 Major FEMA zone X (unshaded) · 73% chance over 30 yrs
- Wildfire 1/10 Low
- Heat 7/10 Severe 7 d/yr ≥93°F today · 16 d/yr by 30 yrs out
- Wind 8/10 Severe 80% chance of damaging wind over 30 yrs
- Air quality 3/10 Moderate 3 unhealthy d/yr today · 4 by 30 yrs out
Nearby sold comps map
Loading sold comps map…
Walkable amenities ~0.75 mi
Loading nearby amenities…
Taxation est. · year 1
- Rental income
- $74,007
- − Mortgage interest
- −$36,410
- − Property taxes
- −$7,239
- − Insurance
- −$3,250
- − Repairs & maintenance
- −$5,921
- − Management
- −$5,921
- − Depreciation
- −$18,909
- Taxable loss
- −$3,642
- Est. tax savings @ 24.0%
- +$874
- After-tax cash flow
- $7,947/yr
For passive investors: Depreciation is non-cash, so a rental often shows a tax loss while cash-flowing — sheltering income. Rental losses are passive: they offset passive income freely, and up to $25,000/yr can offset ordinary (W-2) income if you actively participate and your MAGI is under $100k (phasing out to $0 by $150k); unused losses carry forward. On sale, claimed depreciation is recaptured at up to 25%, and gains may owe capital-gains tax (a 1031 exchange can defer both). Figures are a year-1 estimate at your 24.0% rate — not tax advice; consult a CPA.
Schools (NCES district)
- District
- Long Branch Public School District
- NCES district ID
- 3408940
- Math proficiency
- 8% ▼ -18.00%
- Reading proficiency
- 26% ▼ -8.00%
- Median HH income
- $51,405
- Composite
- 15.49/100
- National rank
- #9307
- State rank
- #445 of 472 in NJ
Livability — Long Branch
- Score
- 71/100
- State rank
- #243
- US rank
- #6700
Category grades
Schools grade is shown separately in the Schools card above.
Census & demographics
- Census place
- Long Branch, NJ
- County
- Monmouth County · 505,557 people
- City population
- 32,917
- Metro
- New York-Newark-Jersey City, NY-NJ-PA
- Population (ZIP)
- 32,917
- Household income
- $79,870
- Rent vs Own
- Severe rent burden
- 2347.0
Population outlook (Monmouth County) Hauer SSP2
- Today (2025)
- 620,308 people
- By 2030
- 612,309 · -1.3%
- By 2040
- 587,297 · -5.3%
- By 2050
- 551,342 · -11.1%
- By 2075
- 472,934 · -23.8%
- By 2100
- 381,534 · -38.5%
Race, ethnicity, and origin ACS 2023
- Neighborhood character
- Diverse neighborhood (Simpson 0.65)
- Race & ethnicity
- White 54% Hispanic / Latino 23% Two or more races 12% Black 11% Native American 2% Asian 2%
- Hispanic origin (detail)
- Mexican 9% Puerto Rican 6%
- Common ancestry
- Estonian 10% Russian 3% Scotch-Irish 2%
- Foreign-born
- 26% · Canada, Jamaica, China
- Languages at home
- 65% English-only · Spanish 17% Other Indo-European 15% Russian/Polish/Slavic 1%
Political lean MEDSL · Monmouth
- 2024 margin
- R (+11.4) · D 43.4% · R 54.8% · Other 1.8%
- 2008→2024 swing
- -7.7pp toward R · 2008: -3.7pp · 2024: -11.4pp
- All cycles
- 2024: R+11.4 2020: R+2.8 2016: R+9.5 2012: R+5.5 2008: R+3.7
Not yet ingested
- Civics
- —
Market trends
- HPI YoY
- ▼ -655.16%
- Current HPI
- 405.7286
- Rent YoY
- ▲ 3.91%
- Metro
- New York-Newark-Jersey City, NY-NJ-PA
- State GDP YoY
- ▲ 2.05%
- F500 in state
- 34
Industry mix (Fortune 500 HQ in NJ)
| Industry | F500 HQs | Revenue |
|---|---|---|
| Consumer Goods | 3 | $31B |
|
||
| Pharmaceuticals | 2 | $153B |
|
||
| Technology | 2 | $21B |
|
||
| Insurance | 2 | $20B |
|
||
| Healthcare | 2 | $19B |
|
||
| Financial Services | 1 | $70B |
|
||
Price history
+1525.0% since first listed12 events — show timeline
- 2026-04-22 Relisted — MOMLS
- 2026-03-19 Pending — MOMLS
- 2026-03-18 Price Changed $649,999 MOMLS
- 2026-03-18 Relisted — MOMLS
- 2025-08-15 Price Changed $599,999 MOMLS
- 2025-05-09 Listed $639,000 MOMLS
- 2025-05-03 Coming Soon $639,000 MOMLS
- 2015-10-01 Sold (Public Records) $200,000 Public Records
- 1998-12-28 Sold (Public Records) $71,800 Public Records
- 1997-11-17 Sold (Public Records) $39,000 Public Records
- 1987-11-20 Sold (Public Records) $102,000 Public Records
- 1985-02-01 Sold (Public Records) $40,000 Public Records
Property tax history
+4.5%/yrLatest (2025): $7,239 · +9.1% YoY. Source: county tax records.
Cash-flow waterfall
monthlySold comps — $/sqft
last 12 mo · ≤1 miLoading sold comps…