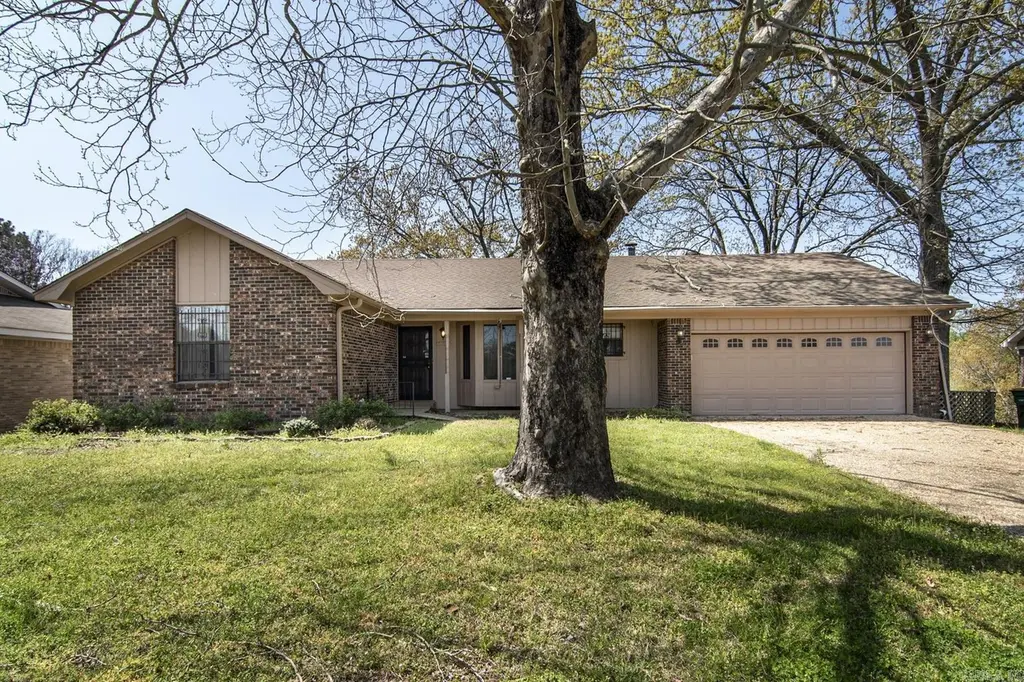
5618 Pecan Lake Rd · Little Rock, AR
Flood risk 1/10 · Minimal
- FEMA flood zone
- X (unshaded)
- Chance of flooding over 30 yrs
- 0.0%
- Est. flood insurance / yr
- $507 – $1,088
Fire risk 1/10 · Minimal
- Est. fire insurance / yr
- $1,499 – $2,785
Heat risk 7/10 · Major
- Hot days now (above 110°F)
- 7 days/yr
- Hot days in 30 yrs
- 20 days/yr
Wind risk 4/10 · Minor
- Chance of severe wind over 30 yrs
- 10.0%
Air-quality risk 2/10 · Minimal
- Unhealthy air days now
- 0 days/yr
- Unhealthy air days in 30 yrs
- 1 days/yr
Risk factors via First Street. Map © Google.
Why this score? — see what drove the D grade
The composite is a weighted blend of 9 inputs, each scored 0–100. Each bar is that input's sub-score; the figure is the points it added to the 100-point composite (weight × sub-score).
- Cash flow +14.8/30.0
- ARV discount +7.5/15.0
- DSCR +4.5/10.0
- Rent growth +3.7/5.0
- Livability +3.7/5.0
- 1% rule +3.6/10.0
- Condition / age +2.5/5.0
- Schools +2.1/10.0
- Appreciation +0.0/10.0
$199,900
🖨 Deal sheet (PDF) 📄 Offer letter ✓ Due diligence
Listing remarks
Welcome to 5618 Pecan Lake Rd, a comfortable family home on Tall Timber Lake in LR! This 4 BD/3 BA property offers spacious living w 3 BD/2 baths on the main level. Enjoy stunning lake views from both levels, perfect for relaxing or entertaining. The home also features a cozy wood-burning fireplace, great indoor and outdoor spaces, and plenty of storage on both levels. Newly rebuilt back patio to relax on as you look over the peaceful lake in your backyard! With ample room for the whole family, this home is ready to be made yours. Schedule your tour today and see all it has to offer! Agents see remarks.
Key facts
- Plenty of storage
- Lake views
- 9,147 sq ft lot
Tags
Property features AI
Finance
- Financial info: Accepts conventional loans and cash
Exterior
- Parking: 2-car garage with automatic door opener
- Utilities: Public sewer; Public water; Municipal electric (Entergy); Natural gas
- Home design: Brick exterior; Inside city limits
- Construction: Composition roof; Slab/crawlspace combination foundation
- Exterior features: Patio; Covered patio; Deck; Fully fenced yard; Chain link fence; Lake view; Lakefront access; Sloped and level areas; Located in a subdivision; Common access to lake; Paved road
Interior
- Kitchen: Free-standing stove; Gas range; Dishwasher; Pantry; Refrigerator stays
- Bedrooms: Bedrooms with walk-in closet(s)
- Flooring: Carpet; Vinyl; Tile; Luxury vinyl
- Bathrooms: 3 full bathrooms
- Heating & cooling: Central heat (gas); Central cooling (electric)
- Interior features: Washer connection; Dryer connection (electric); Window treatments; Walk-in closet(s); Built-ins; Ceiling fan(s); Walk-in shower; Breakfast bar; Formica kitchen countertops; Wood-burning site-built fireplace; Sheetrock walls; Wallpaper
- Laundry & utility: Laundry room; Washer connection; Dryer connection (electric)
Neighborhood map
What this means for you Summary
Snapshot
- This is a 4-bed/2.0-bath single-family listed at $200k.
Deal economics
- At list price, monthly cash flow is $56 ($669/yr) — positive.
- The deal already cash-flows at list — no discount required.
- To meet the 1% rule (rent ≥ 1% of price), the offer needs to be $171k (14.2% below list).
- Recommended offer: $171k (14.2% below list) — sets the bar for 1% rule.
- Cap rate 6.6% vs local median 4.1% in Little Rock — top-decile yield for the area; either an underpriced asset or a hidden risk that comps aren't pricing in. Stress-test before assuming the spread holds.
Location & tenants
- Location reads 73/100 on livability (#22 in AR) — a middle-class / working-renter tenant base. Strengths: commute A+, cost of living A+, housing A+; Watch: crime F.
- Little Rock School District (urban): math 23% / reading 26% proficiency, ranked #183 of 238 in AR (top 77%) — low school quality limits family demand, transient renter base, plan for 1-2y turnover; 69% free/reduced lunch — lower-income household profile, screen leases tightly.
- Zoned schools: Mabelvale Middle School (math 7% / reading 10%, grade F, #197 of 201 statewide, top 98%, 569 students, 89% FRL) — zoned schools average 89% FRL vs 69% district-wide (20 pts higher); higher-poverty schools than district average — tighter screening recommended.
- Zoned-school proficiency averages 8% at this address vs 24% district-wide (-16 pts) — the specific schools serving this property underperform the Little Rock School District average; the district grade overstates school quality for this exact location.
- Market conditions: Rents rising fast (+4.9%/yr); 187 active listings in the ZIP; 1 comparable units currently listed for rent nearby; lower-income renter base — watch delinquency; 1,006 units permitted in Pulaski County in 2024 (0 in 5+ unit buildings).
- At $1,715/mo this rent would consume 50% of the median local household income ($41k/yr) (locally 1553% of renters already pay >50% of income on rent) — very limited rent-growth headroom before tenants either downsize or default.
Forward outlook
- Local home prices are declining (-3.0%/yr); year-one equity from $1k of loan paydown is wiped out by about $6k of value loss. Plan a longer hold.
- Pulaski County population projected at +6% by 2050 — modest demand growth; plan on rents tracking national, not racing it.
Negotiation context
- It's been on market 68 days — a 6% lower offer ($188k) is reasonable based on typical stale-listing flexibility.
- 3 sale attempts; this cycle's ask has dropped $30k (13%) from the opening price — seller is motivated, your offer sets the floor, not the list.
Risks & watch-outs
- Climate carrying-cost: extreme-heat days projected 7→20/yr by 2055 (HVAC capex compounding) — expect insurance premiums to compound above CPI over the hold.
Questions for the listing agent
- It's been on market 68 days. Have you received any prior offers? Is the seller open to a 14% concession, seller financing, or rate buy-down credit?
- Built in 1976 — when were the roof, HVAC, electrical panel, plumbing, and water heater last replaced?
- Why hasn't it sold? Are there any deal-killer items the seller is aware of (foundation, flood, title, zoning, code violations)?
- Is there a deadline driving the sale (1031 exchange, divorce, estate, relocation)? That informs how much negotiation room exists.
- Crime grade is F in this area — have there been break-ins, vandalism, or insurance claims at this property in the last 3 years? What carrier currently insures it and at what premium?
- The area grade is low — what's the realistic commute time and amenity access for the typical tenant pool here? Any planned neighborhood developments (good or bad) we should know about?
- What's the average days-on-market for RENTAL listings here right now (not sales)? A rising rental-DOM trend means longer vacancies and softer asking-rent achievability than the comps imply.
- What's the recent tenant-quality profile in this submarket — average credit score on applications, eviction rate, late-payment / NSF rate, and stable-employment percentage? A property-management company in the area should have these aggregated.
- How much new for-sale + rental construction is in the pipeline within 1–3 miles? Heavy new supply typically softens prices + rents 12–24 months out; constrained supply supports both.
Investment metrics
- 1% rule
- 0.86% ✗
- Cap rate
- 6.63%
- Cash-on-cash
- 1.20%
- DSCR
- 1.05
- GRM
- 9.7
CMA / ARV
No comps found within radius.
Projected returns pro-forma
-3.0% appreciation · 4.91% rent growth · sell at horizon
- IRR
- -12.4%
- Equity multiple
- 0.54×
- Total profit
- $-25,509
- Equity at exit
- $29,806
- IRR
- -0.8%
- Equity multiple
- 0.94×
- Total profit
- $-3,416
- Equity at exit
- $17,284
Cash invested: $55,972 (down + closing). Projections, not guarantees.
Landlord ↔ Tenant lean methodology
- Overall (STATE)
- 92 Strongly Landlord-Friendly
- State Arkansas
- 92 Strongly Landlord-Friendly · R+14
- County
- — inherits STATE
- City
- — inherits STATE
ZIP-level market 72204
- Home prices YoY
- -21.5%
- Rents YoY
- 4.9%
- Active inventory
- 187
- Price-to-rent
- 9.7×
Monthly cashflow live
- Estimated rent
- $1,715 medium interval (Pro) →
- Mortgage (P&I)
- −$1,048
- Tax from tax record
- −$167 /mo · $2,006/yr
- Insurance
- −$83
- HOA
- −$0
- Vacancy / Maint / Mgmt
- −$360
- Net cashflow
- $56
Break-even live
Sensitivity live
| Price | -10% $169 | -5% $112 | +0% $56 | +5% $-1 | +10% $-57 |
|---|---|---|---|---|---|
| Rent | -10% $-80 | -5% $-12 | +0% $56 | +5% $123 | +10% $191 |
| Rate | -1.0pp $156 | -0.5pp $107 | base $56 | +0.5pp $4 | +1.0pp $-49 |
UW: 25.0% down · 7.5% · 30yr · 1.5% tax · 5.0% vac · 8.0% maint · 8.0% mgmt
Financing live
Cash to close
- Down payment
- $49,975
- Closing costs
- $5,997
- Reserves months
- —
- Total cash needed
- —
Loan-product check · same deal, 3 products live
Conventional
25% down · 7.5% · 30yr
- Down + closing
- —
- Monthly P&I
- —
- Monthly cashflow
- —
- DSCR
- —
- Eligible?
- —
Personal DTI + credit; lowest rate.
DSCR
20% down · 8.5% · 30yr
- Down + closing
- —
- Monthly P&I
- —
- Monthly cashflow
- —
- DSCR
- —
- Eligible?
- —
No personal income docs; deal must DSCR.
Hard money
10% down · 12.0% · 12mo
- Down + closing
- —
- Monthly P&I
- —
- Monthly cashflow
- —
- DSCR
- —
- Eligible?
- —
Short-term bridge; refi at stabilization.
Rent comps 1 comps
| Address | Beds | Baths | Sqft | Rent | $/sqft | DOM | Units | Dist |
|---|---|---|---|---|---|---|---|---|
| 8018 Mabelvale Pike Little Rock, AR | 4.0 | 3.0 | 2500 | $1,875 | $0.75 | 45d | 1 | 1.40mi |
Listing history 24 events
-
2026-06-21days on market $199,900 Active 68 DOM
-
2026-06-18days on market $199,900 Active 65 DOM
-
2026-06-18status $199,900 Active 64 DOM
-
2026-06-17days on market $199,900 Price Change 64 DOM
-
2026-06-16days on market $199,900 Price Change 63 DOM
-
2026-06-15days on market $199,900 Price Change 62 DOM
-
2026-06-14days on market $199,900 Price Change 60 DOM
-
2026-06-13pricestatusdays on market $199,900 Price Change 59 DOM
-
2026-06-10days on market $230,000 Active 57 DOM
-
2026-06-09days on market $230,000 Active 56 DOM
-
2026-06-08days on market $230,000 Active 55 DOM
-
2026-06-05days on market $230,000 Active 51 DOM
-
2026-06-03days on market $230,000 Active 50 DOM
-
2026-06-02days on market $230,000 Active 49 DOM
-
2026-06-01days on market $230,000 Active 48 DOM
-
2026-05-31days on market $230,000 Active 47 DOM
-
2026-05-31days on market $230,000 Active 46 DOM
-
2026-05-21status Back on Market
-
2026-04-21historical Take Backups
-
2026-04-14$230,000 New Listing
-
2025-09-15historical
-
2025-08-08price $230,000
-
2025-04-04price $253,000
-
2025-03-14$255,000 New Listing
ⓘ Source: listings_history table (triggers on properties + properties_extension) + one-shot
backfill from property_details.listing_events for pre-trigger history.
Tax reassessment forecast AR · Resets to sale price
- Current annual tax
- $2,006 · $167/mo
- Projected year-2 tax
- $2,006 · $167/mo
- Expected delta
- $0/yr ($0/mo · 0.0%)
ⓘ Screening estimate from a state-policy table — verify with the county assessor before closing.
Climate risk First Street
- Flood 1/10 Low FEMA zone X (unshaded) · 0% chance over 30 yrs
- Wildfire 1/10 Low
- Heat 7/10 Severe 7 d/yr ≥110°F today · 20 d/yr by 30 yrs out
- Wind 4/10 Moderate 10% chance of damaging wind over 30 yrs
- Air quality 2/10 Low 0 unhealthy d/yr today · 1 by 30 yrs out
Nearby sold comps map
Loading sold comps map…
Walkable amenities ~0.75 mi
Loading nearby amenities…
Taxation est. · year 1
- Rental income
- $20,575
- − Mortgage interest
- −$11,198
- − Property taxes
- −$2,006
- − Insurance
- −$1,000
- − Repairs & maintenance
- −$1,646
- − Management
- −$1,646
- − Depreciation
- −$5,815
- Taxable loss
- −$2,736
- Est. tax savings @ 24.0%
- +$657
- After-tax cash flow
- $1,325/yr
For passive investors: Depreciation is non-cash, so a rental often shows a tax loss while cash-flowing — sheltering income. Rental losses are passive: they offset passive income freely, and up to $25,000/yr can offset ordinary (W-2) income if you actively participate and your MAGI is under $100k (phasing out to $0 by $150k); unused losses carry forward. On sale, claimed depreciation is recaptured at up to 25%, and gains may owe capital-gains tax (a 1031 exchange can defer both). Figures are a year-1 estimate at your 24.0% rate — not tax advice; consult a CPA.
Schools (NCES district)
- District
- Little Rock School District
- NCES district ID
- 0509000
- Math proficiency
- 23% ▼ -12.00%
- Reading proficiency
- 26% ▼ -8.00%
- Median HH income
- $43,346
- Composite
- 21.0/100
- National rank
- #8457
- State rank
- #183 of 238 in AR
Livability — Little Rock
- Score
- 73/100
- State rank
- #22
- US rank
- #5295
Category grades
Schools grade is shown separately in the Schools card above.
Census & demographics
- Census place
- Little Rock, AR
- County
- Pulaski County · 372,764 people
- City population
- 218,896
- Metro
- Little Rock-North Little Rock-Conway, AR
- Population (ZIP)
- 30,525
- Household income
- $40,882
- Rent vs Own
- Severe rent burden
- 1553.0
Population outlook (Pulaski County) Hauer SSP2
- Today (2025)
- 415,378 people
- By 2030
- 423,720 · +2.0%
- By 2040
- 435,182 · +4.8%
- By 2050
- 440,904 · +6.1%
- By 2075
- 445,521 · +7.3%
- By 2100
- 419,173 · +0.9%
Race, ethnicity, and origin ACS 2023
- Neighborhood character
- Predominantly Black (66%)
- Race & ethnicity
- Black 66% White 18% Hispanic / Latino 12% Two or more races 6%
- Hispanic origin (detail)
- Mexican 9%
- Common ancestry
- Slovak 1%
- Foreign-born
- 7% · Canada, Vietnam
- Languages at home
- 89% English-only · Spanish 9% Vietnamese 1%
Political lean MEDSL · Pulaski
- 2024 margin
- Strong D (+22.1) · D 59.8% · R 37.7% · Other 2.5%
- 2008→2024 swing
- +10.6pp toward D · 2008: 11.6pp · 2024: 22.1pp
- All cycles
- 2024: D+22.1 2020: D+22.5 2016: D+17.9 2012: D+11.4 2008: D+11.6
Not yet ingested
- Civics
- —
Market trends
- HPI YoY
- ▼ -47.17%
- Current HPI
- 172.3977
- Rent YoY
- ▲ 4.91%
- Metro
- Little Rock-North Little Rock-Conway, AR
- State GDP YoY
- ▲ 3.80%
- F500 in state
- 10
Industry mix (Fortune 500 HQ in AR)
| Industry | F500 HQs | Revenue |
|---|---|---|
| Retail | 1 | $681B |
|
||
| Food / Agriculture | 1 | $53B |
|
||
| Retail / Energy | 1 | $22B |
|
||
| Transportation / Logistics | 1 | $12B |
|
||
| Energy | 1 | $4B |
|
||
Price history
-9.8% since first listed7 events — show timeline
- 2026-05-21 Relisted — CARMLS
- 2026-04-21 Contingent — CARMLS
- 2026-04-14 Listed $230,000 CARMLS
- 2025-09-15 Listing Removed — CARMLS
- 2025-08-08 Price Changed $230,000 CARMLS
- 2025-04-04 Price Changed $253,000 CARMLS
- 2025-03-14 Listed $255,000 CARMLS
Property tax history
+2.0%/yrLatest (2025): $2,006 · +8.6% YoY. Source: county tax records.
Cash-flow waterfall
monthlySold comps — $/sqft
last 12 mo · ≤1 miLoading sold comps…