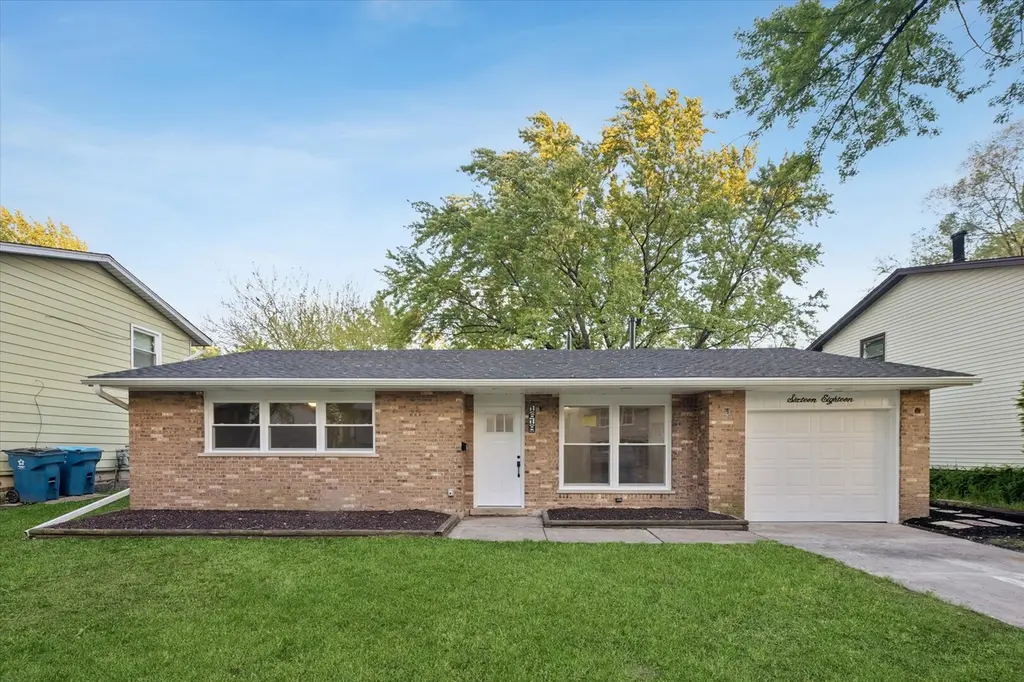
1618 Constance Ave · Sauk Village, IL
Flood risk 6/10 · Moderate
- FEMA flood zone
- X (unshaded)
- Chance of flooding over 30 yrs
- 0.72%
- Est. flood insurance / yr
- $473 – $860
Fire risk 1/10 · Minimal
- Est. fire insurance / yr
- $804 – $1,492
Heat risk 3/10 · Minor
- Hot days now (above 101°F)
- 7 days/yr
- Hot days in 30 yrs
- 15 days/yr
Wind risk 2/10 · Minimal
- Chance of severe wind over 30 yrs
- 1.0%
Air-quality risk 2/10 · Minimal
- Unhealthy air days now
- 2 days/yr
- Unhealthy air days in 30 yrs
- 2 days/yr
Risk factors via First Street. Map © Google.
Why this score? — see what drove the D- grade
The composite is a weighted blend of 9 inputs, each scored 0–100. Each bar is that input's sub-score; the figure is the points it added to the 100-point composite (weight × sub-score).
- Cash flow +13.9/30.0
- DSCR +4.2/10.0
- Rent growth +4.1/5.0
- ARV discount +4.0/15.0
- 1% rule +3.4/10.0
- Livability +3.3/5.0
- Condition / age +2.5/5.0
- Schools +0.7/10.0
- Appreciation +0.0/10.0
$210,000
🖨 Deal sheet 📄 Offer letter ✓ Due diligence
Listing remarks
Beautifully renovated in 2025, this stunning 3-bedroom, 1-bath ranch offers stylish one-level living with modern finishes throughout. The open-concept layout features a beautifully updated kitchen with striking black countertops, stainless steel appliances, dishwasher, and island seating perfect for entertaining. Enjoy spacious bedrooms with large closets, a cozy fireplace, central air and heat, and washer and dryer. Outside, the fenced-in yard offers plenty of space to relax or entertain, along with exterior lighting and an attached garage for added convenience. Step inside and fall in love - schedule your private tour today.
Key facts
- Island seating
- Black countertops
- Updated kitchen
Tags
Property features AI
Finance
- Other: Parcel number 32251110090000
- HOA & community: No master association fee required
Exterior
- Parking: Attached garage (garage owned) with 2 garage spaces; Concrete driveway; Garage door opener
- Utilities: Public water; Public sewer
- Home design: Detached single-family home; One-story; Fee simple ownership; Rehab completed 2025; Disability access available; Built before 1978; Age estimated 51–60 years
- Construction: Vinyl siding and brick exterior
- Exterior features: Lot dimensions about 60 x 110; Lot less than 0.25 acre; Interstate access
Interior
- Kitchen: Kitchen on the main level (approx. 14 x 13)
- Bedrooms: 3 bedrooms (all on the main level); Master bedroom on the main level (approx. 16 x 11); Bedroom (approx. 13 x 14); Bedroom (approx. 10 x 10)
- Bathrooms: 1 full bathroom
- Heating & cooling: Natural gas heating; Central air conditioning
- Interior features: Open floorplan; Main-level full bathroom; One fireplace; 6 rooms total
- Laundry & utility: Main-level laundry in-unit with laundry closet and sink (approx. 7 x 12)
Neighborhood map
What this means for you Summary
Snapshot
- This is a 3-bed/1.0-bath single-family listed at $210k.
Deal economics
- At list price, monthly cash flow is $23 ($272/yr) — positive.
- The deal already cash-flows at list — no discount required.
- To meet the 1% rule (rent ≥ 1% of price), the offer needs to be $177k (15.7% below list).
- Recommended offer: $177k (15.7% below list) — sets the bar for 1% rule.
- Cap rate 6.4% vs local median 8.2% in Sauk Village — below-typical yield; the buyer is paying a premium for something (appreciation thesis, condition, location) that the cap rate doesn't capture.
Location & tenants
- Location reads 66/100 on livability (#546 in IL) — a middle-class / working-renter tenant base. Strengths: cost of living A+, housing A+; Watch: crime C-, health & safety D+, commute D.
- Bloom Twp Hsd 206 (suburban): math 8% / reading 9% proficiency, ranked #591 of 620 in IL (top 95%) — low school quality limits family demand, transient renter base, plan for 1-2y turnover.
- Zoned schools: Bloom High School (math 7% / reading 8%, grade F, #589 of 693 statewide, top 86%, 1,737 students, 0% FRL).
- Market conditions: Rents rising fast (+6.5%/yr); 222 active listings in the ZIP; 6 comparable units currently listed for rent nearby; rentals at typical pace (median 19d on market — plan ~3-4 weeks tenant-placement turnaround); 6,272 units permitted in Cook County in 2024 (4,658 in 5+ unit buildings).
- This rent runs 34% of the median local income ($62k/yr) — at the standard rent-burdened threshold; future hikes will face affordability resistance.
Forward outlook
- Local home prices are declining (-3.0%/yr); year-one equity from $1k of loan paydown is wiped out by about $6k of value loss. Plan a longer hold.
Negotiation context
- It's been on market 27 days — a 2% lower offer ($207k) is reasonable based on typical stale-listing flexibility.
- 2 sale attempts since 16y ago with the ask held roughly flat each time — persistent listings suggest the price (not the market) is what's stuck; bring a comps-based counter.
- Current owner paid $76k; list at $210k implies a 175% gain — meaningful room to come down on a strong offer.
Risks & watch-outs
- Climate carrying-cost: major flood risk — expect insurance premiums to compound above CPI over the hold.
Questions for the listing agent
- Built in 1974 — when were the roof, HVAC, electrical panel, plumbing, and water heater last replaced?
- Is there a deadline driving the sale (1031 exchange, divorce, estate, relocation)? That informs how much negotiation room exists.
- Schools are F-rated, which usually means shorter tenancies and higher turnover. Who's the typical renter profile here, and what's been the actual vacancy rate?
- The area grade is low — what's the realistic commute time and amenity access for the typical tenant pool here? Any planned neighborhood developments (good or bad) we should know about?
- What's the average days-on-market for RENTAL listings here right now (not sales)? A rising rental-DOM trend means longer vacancies and softer asking-rent achievability than the comps imply.
- What's the recent tenant-quality profile in this submarket — average credit score on applications, eviction rate, late-payment / NSF rate, and stable-employment percentage? A property-management company in the area should have these aggregated.
- How much new for-sale + rental construction is in the pipeline within 1–3 miles? Heavy new supply typically softens prices + rents 12–24 months out; constrained supply supports both.
Investment metrics
- 1% rule
- 0.84% ✗
- Cap rate
- 6.42%
- Cash-on-cash
- 0.46%
- DSCR
- 1.02
- GRM
- 9.9
CMA / ARV
- ARV (on-the-fly)
- $194,922
- Comps found
- 12
Show comp detail 12 sales within ~0.75 mi
| Address | Dist | Beds/Ba | Sqft | Sold | Price | $/sf | Match |
|---|---|---|---|---|---|---|---|
| 1618 Constance Ave | 0.00mi | 3/1.0 | 1,326 (0%) | 0mo | $213,000 | $161 | 100 |
| 1908 215th Pl | 0.27mi | 3/1.0 | 1,250 (-6%) | 2mo | $120,000 | $96 | 76 |
| 1647 216th St | 0.08mi | 4/2.0 (+1) | 1,408 (+6%) | 1mo | $275,000 | $195 | 76 |
| 21618 Gailine Ave | 0.26mi | 4/2.0 (+1) | 1,271 (-4%) | 0mo | $192,000 | $151 | 72 |
| 2106 216th St | 0.50mi | 3/2.0 | 1,337 (+1%) | 2mo | $75,000 | $56 | 70 |
| 21607 Gailine Ave | 0.28mi | 3/1.0 | 1,200 (-10%) | 6mo | $189,000 | $158 | 66 |
| 21624 Gailine Ave | 0.27mi | 4/2.0 (+1) | 1,500 (+13%) | 2mo | $199,000 | $133 | 55 |
| 2129 219th St | 0.65mi | 3/1.0 | 1,200 (-10%) | 1mo | $170,000 | $142 | 53 |
| 22150 Chappel Ave | 0.74mi | 3/1.0 | 1,200 (-10%) | 1mo | $156,000 | $130 | 49 |
| 1913 218th Pl | 0.48mi | 3/2.0 | 1,500 (+13%) | 7mo | $220,000 | $147 | 46 |
| 2117 217th St | 0.52mi | 4/1.0 (+1) | 1,134 (-14%) | 1mo | $90,000 | $79 | 46 |
| 21946 Merrill Ave | 0.64mi | 3/1.0 | 1,130 (-15%) | 2mo | $175,000 | $155 | 44 |
Match score weights: distance 35% · size 25% · config 20% · recency 20%. Top-matched comps best support the ARV.
Projected returns pro-forma
-3.0% appreciation · 6.48% rent growth · sell at horizon
- IRR
- -11.9%
- Equity multiple
- 0.55×
- Total profit
- $-26,190
- Equity at exit
- $31,312
- IRR
- 1.5%
- Equity multiple
- 1.12×
- Total profit
- $7,246
- Equity at exit
- $18,157
Cash invested: $58,800 (down + closing). Projections, not guarantees.
Landlord ↔ Tenant lean methodology
- Overall (STATE)
- 43 Moderately Tenant-Leaning
- State Illinois
- 43 Moderately Tenant-Leaning · D+7
- County
- — inherits STATE
- City
- — inherits STATE
ZIP-level market 60411
- Home prices YoY
- -33.9%
- Rents YoY
- 6.5%
- Active inventory
- 222
- Price-to-rent
- 9.9×
Monthly cashflow live
- Estimated rent
- $1,770 high interval (Pro) →
- Mortgage (P&I)
- −$1,101
- Tax from tax record
- −$187 /mo · $2,241/yr
- Insurance
- −$88
- HOA
- −$0
- Vacancy / Maint / Mgmt
- −$372
- Net cashflow
- $23
Break-even live
UW: 25.0% down · 7.5% · 30yr · 1.5% tax · 5.0% vac · 8.0% maint · 8.0% mgmt
Financing live
Cash to close
- Down payment
- $52,500
- Closing costs
- $6,300
- Reserves months
- —
- Total cash needed
- —
Loan-product check · same deal, 3 products live
Conventional
25% down · 7.5% · 30yr
- Down + closing
- —
- Monthly P&I
- —
- Monthly cashflow
- —
- DSCR
- —
- Eligible?
- —
Personal DTI + credit; lowest rate.
DSCR
20% down · 8.5% · 30yr
- Down + closing
- —
- Monthly P&I
- —
- Monthly cashflow
- —
- DSCR
- —
- Eligible?
- —
No personal income docs; deal must DSCR.
Hard money
10% down · 12.0% · 12mo
- Down + closing
- —
- Monthly P&I
- —
- Monthly cashflow
- —
- DSCR
- —
- Eligible?
- —
Short-term bridge; refi at stabilization.
Rent comps 6 comps
| Address | Beds | Baths | Sqft | Rent | $/sqft | DOM | Units | Dist |
|---|---|---|---|---|---|---|---|---|
| 21538 Gailine Ave Chicago Heights, IL | 3.0 | 1.0 | 1031 | $1,600 | $1.55 | 3d | 1 | 0.22mi |
| 2241 Astor St Unit Labs Sauk Village, IL | 2.0 | 2.0 | 1000 | $1,650 | $1.65 | 2d | 1 | 0.79mi |
| 2236 220th St Sauk Village, IL | 3.0 | 1.0 | 1008 | $1,800 | $1.79 | 24d | 1 | 0.80mi |
| 1154 Barry Ln Sauk Village, IL | 2.0 | 2.0 | 960 | $1,550 | $1.61 | 1d | 1 | 0.84mi |
| 22332 Clyde Ave Sauk Village, IL | 3.0 | 1.0 | 925 | $1,800 | $1.95 | 24d | 1 | 0.98mi |
| 22340 Chappel Ave Sauk Village, IL | 3.0 | 1.0 | 1100 | $1,800 | $1.64 | 19d | 1 | 0.99mi |
Listing history 13 events
-
2026-06-04statusdays on market $210,000 Pending 27 DOM
-
2026-06-03days on market $210,000 Contingent - No Showings 26 DOM
-
2026-06-02days on market $210,000 Contingent - No Showings 25 DOM
-
2026-06-01days on market $210,000 Contingent - No Showings 24 DOM
-
2026-05-31days on market $210,000 Contingent - No Showings 23 DOM
-
2026-05-11historical Contingent - No Showings
-
2026-05-08$210,000 Active
-
2011-03-01historical
-
2010-08-23New
-
2000-04-21soldstatus $76,500
-
1995-04-11soldstatus $65,000
-
1984-11-01soldstatus $40,732
-
1979-06-29soldstatus $42,500
ⓘ Source: listings_history table (triggers on properties + properties_extension) + one-shot
backfill from property_details.listing_events for pre-trigger history.
Tax reassessment forecast IL · Partial reset (capped growth)
- Current annual tax
- $2,241 · $187/mo
- Projected year-2 tax
- $3,504 · $292/mo
- Expected delta
- +$1,263/yr (+$105/mo · 56.4%)
ⓘ Screening estimate from a state-policy table — verify with the county assessor before closing.
Climate risk First Street
- Flood 6/10 Major FEMA zone X (unshaded) · 72% chance over 30 yrs
- Wildfire 1/10 Low
- Heat 3/10 Moderate 7 d/yr ≥101°F today · 15 d/yr by 30 yrs out
- Wind 2/10 Low 100% chance of damaging wind over 30 yrs
- Air quality 2/10 Low 2 unhealthy d/yr today · 2 by 30 yrs out
Nearby sold comps map
Loading sold comps map…
Walkable amenities ~0.75 mi
Loading nearby amenities…
Taxation est. · year 1
- Rental income
- $21,239
- − Mortgage interest
- −$11,763
- − Property taxes
- −$2,241
- − Insurance
- −$1,050
- − Repairs & maintenance
- −$1,699
- − Management
- −$1,699
- − Depreciation
- −$6,109
- Taxable loss
- −$3,323
- Est. tax savings @ 24.0%
- +$798
- After-tax cash flow
- $1,070/yr
For passive investors: Depreciation is non-cash, so a rental often shows a tax loss while cash-flowing — sheltering income. Rental losses are passive: they offset passive income freely, and up to $25,000/yr can offset ordinary (W-2) income if you actively participate and your MAGI is under $100k (phasing out to $0 by $150k); unused losses carry forward. On sale, claimed depreciation is recaptured at up to 25%, and gains may owe capital-gains tax (a 1031 exchange can defer both). Figures are a year-1 estimate at your 24.0% rate — not tax advice; consult a CPA.
Schools (NCES district)
- District
- Bloom Twp Hsd 206
- NCES district ID
- 1706420
- Math proficiency
- 8% ▼ -3.00%
- Reading proficiency
- 9% ▼ -8.00%
- Median HH income
- $39,795
- Composite
- 7.4/100
- National rank
- #9952
- State rank
- #591 of 620 in IL
Livability — Sauk Village
- Score
- 66/100
- State rank
- #546
- US rank
- #11370
Category grades
Schools grade is shown separately in the Schools card above.
Census & demographics
- Census place
- Sauk Village, IL
- County
- Cook County · 4,486,803 people
- Metro
- Chicago-Naperville-Elgin, IL-IN-WI
- Population (ZIP)
- 52,175
- Household income
- $62,073
- Rent vs Own
- Severe rent burden
- 1714.0
Population outlook (Cook County) Hauer SSP2
- Today (2025)
- 5,347,519 people
- By 2030
- 5,357,703 · +0.2%
- By 2040
- 5,324,924 · -0.4%
- By 2050
- 5,230,762 · -2.2%
- By 2075
- 4,785,735 · -10.5%
- By 2100
- 4,188,836 · -21.7%
Race, ethnicity, and origin ACS 2023
- Neighborhood character
- Diverse neighborhood (Simpson 0.66)
- Race & ethnicity
- Black 49% Hispanic / Latino 26% White 19% Two or more races 11%
- Hispanic origin (detail)
- Mexican 22% Puerto Rican 2%
- Common ancestry
- Romanian 4% Portuguese 1% Lithuanian 1%
- Foreign-born
- 12% · Canada
- Languages at home
- 76% English-only · Spanish 21% Russian/Polish/Slavic 1% Other Indo-European 1%
Political lean MEDSL · Cook
- 2024 margin
- Solid D (+42.0) · D 70.4% · R 28.4% · Other 1.2%
- 2008→2024 swing
- -11.4pp toward R · 2008: 53.4pp · 2024: 42.0pp
- All cycles
- 2024: D+42.0 2020: D+50.3 2016: D+53.0 2012: D+49.4 2008: D+53.4
Not yet ingested
- Civics
- —
Market trends
- HPI YoY
- ▼ -108.75%
- Current HPI
- 212.4058
- Rent YoY
- ▲ 6.48%
- Metro
- Chicago-Naperville-Elgin, IL-IN-WI
- State GDP YoY
- ▲ 1.59%
- F500 in state
- 60
Industry mix (Fortune 500 HQ in IL)
| Industry | F500 HQs | Revenue |
|---|---|---|
| Insurance | 4 | $201B |
|
||
| Consumer Goods | 4 | $87B |
|
||
| Industrial Machinery | 3 | $64B |
|
||
| Healthcare | 2 | $55B |
|
||
| Retail / Pharmacy | 1 | $148B |
|
||
| Agriculture / Food | 1 | $86B |
|
||
Price history
+394.1% since first listed8 events — show timeline
- 2026-05-11 Contingent — MRED as Distributed by MLS Grid
- 2026-05-08 Listed $210,000 MRED as Distributed by MLS Grid
- 2011-03-01 Listing Removed — MRED as Distributed by MLS Grid
- 2010-08-23 Listed — MRED as Distributed by MLS Grid
- 2000-04-21 Sold (Public Records) $76,500 Public Records
- 1995-04-11 Sold (Public Records) $65,000 Public Records
- 1984-11-01 Sold (Public Records) $40,732 Public Records
- 1979-06-29 Sold (Public Records) $42,500 Public Records
Property tax history
+0.3%/yrLatest (2023): $2,241 · +206.5% YoY. Source: county tax records.
Cash-flow waterfall
monthlySold comps — $/sqft
last 12 mo · ≤1 miLoading sold comps…