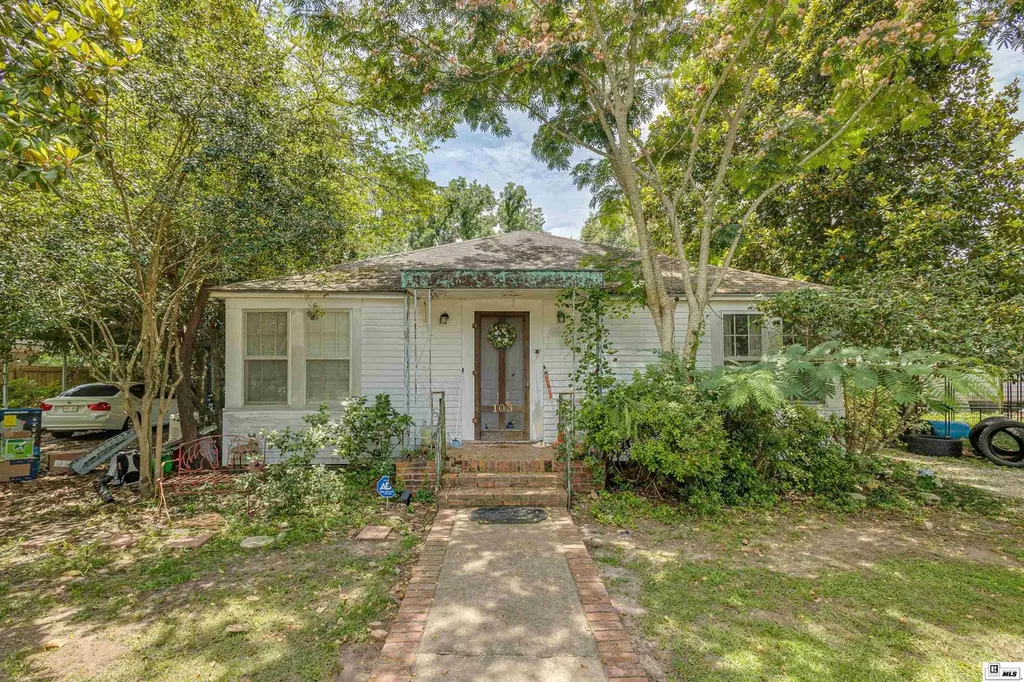
103 Church St · Columbia, LA
Flood risk 1/10 · Minimal
- FEMA flood zone
- X
- Chance of flooding over 30 yrs
- 0.0%
- Est. flood insurance / yr
- $507 – $1,088
Fire risk 4/10 · Minor
- Est. fire insurance / yr
- $1,269 – $2,357
Heat risk 7/10 · Major
- Hot days now (above 112°F)
- 7 days/yr
- Hot days in 30 yrs
- 19 days/yr
Wind risk 8/10 · Major
- Chance of severe wind over 30 yrs
- 80.0%
Air-quality risk 1/10 · Minimal
- Unhealthy air days now
- 0 days/yr
- Unhealthy air days in 30 yrs
- 0 days/yr
Risk factors via First Street. Map © Google.
Why this score? — see what drove the D- grade
The composite is a weighted blend of 9 inputs, each scored 0–100. Each bar is that input's sub-score; the figure is the points it added to the 100-point composite (weight × sub-score).
- Cash flow +9.8/30.0
- ARV discount +7.5/15.0
- Appreciation +7.1/10.0
- Livability +2.9/5.0
- DSCR +2.8/10.0
- Rent growth +2.5/5.0
- Condition / age +2.5/5.0
- Schools +2.1/10.0
- 1% rule +1.8/10.0
$162,000
🖨 Deal sheet 📄 Offer letter ✓ Due diligence
Listing remarks
This is a great 3 bedroom, 2 bath home located in Columbia! The home features a great floor plan, beautiful hardwood floors, a large living room with built-ins, plenty of kitchen cabinet space, a delightful sun room, and an open deck out back for entertaining! This property has much more to offer, so come see it before its too late!
Key facts
- Open deck
- Living room
- Sun room
Tags
Property features AI
Finance
- HOA & community: No association amenities
Exterior
- Parking: Open parking; Gravel parking surface
- Utilities: Public water; Public sewer
- Home design: Single-family residence (site-built); One level; Entry level: 1
- Construction: Vinyl siding; Asphalt roof; Pillar/post/pier foundation
- Exterior features: Covered patio/porch; Landscaped yard; Cleared lot; Paved road access; Workshop on the property
Interior
- Kitchen: Dishwasher; Range hood; Electric range
- Bedrooms: 3 main-level bedrooms
- Bathrooms: 2 full bathrooms (both on the main level)
- Heating & cooling: Central heating (electric); Central air conditioning (electric); Ceiling fan(s)
- Interior features: Ceiling fan(s); Storm windows
- Laundry & utility: Electric water heater
Neighborhood map
What this means for you Summary
Snapshot
- This is a 3-bed/2.0-bath single-family listed at $162k.
Deal economics
- At list price, monthly cash flow is $-102 ($-1k/yr) — negative.
- To cash-flow at today's rent, offer at most $144k (11.2% below list).
- To meet the 1% rule (rent ≥ 1% of price), the offer needs to be $111k (31.6% below list).
- Recommended offer: $111k (31.6% below list) — sets the bar for 1% rule.
Location & tenants
- Location reads 58/100 on livability (#286 in LA) — a working-class tenant base; expect higher turnover. Strengths: cost of living A+, crime A; Watch: employment D, health & safety D, amenities F.
- Caldwell Parish (rural): math 17% / reading 34% proficiency, ranked #59 of 98 in LA (top 60%) — low school quality limits family demand, transient renter base, plan for 1-2y turnover; 62% free/reduced lunch — lower-income household profile, screen leases tightly.
- Market conditions: 23 active listings in the ZIP; 9 units permitted in Caldwell Parish in 2024 (0 in 5+ unit buildings).
Forward outlook
- In year one you build about $8k of equity ($1k loan paydown + $7k appreciation (4.2% local appreciation)).
- Caldwell County population projected to shrink 8% by 2050 — rents likely to lag national; underwrite the cash flow, not the appreciation.
- By year 5, paydown + projected appreciation supports a ~$34k cash-out refi (75% LTV) — recoverable capital for the next deal without selling this one.
Negotiation context
- Only 11 days on market — expect competitive offers; lowballing is unlikely to land.
Risks & watch-outs
- Watch-outs: built in 1947 — expect roof / HVAC / electrical / plumbing capex.
- Climate carrying-cost: severe wind risk, 80% chance of damaging wind over 30y; extreme-heat days projected 7→19/yr by 2055 (HVAC capex compounding) — expect insurance premiums to compound above CPI over the hold.
Questions for the listing agent
- What do current leases actually rent for vs. the listed asking? Can we see a recent rent roll and the last 12 months of T-12 income?
- Built in 1947 — when were the roof, HVAC, electrical panel, plumbing, and water heater last replaced?
- Is there a deadline driving the sale (1031 exchange, divorce, estate, relocation)? That informs how much negotiation room exists.
- The area grade is low — what's the realistic commute time and amenity access for the typical tenant pool here? Any planned neighborhood developments (good or bad) we should know about?
- What's the average days-on-market for RENTAL listings here right now (not sales)? A rising rental-DOM trend means longer vacancies and softer asking-rent achievability than the comps imply.
- What's the recent tenant-quality profile in this submarket — average credit score on applications, eviction rate, late-payment / NSF rate, and stable-employment percentage? A property-management company in the area should have these aggregated.
- How much new for-sale + rental construction is in the pipeline within 1–3 miles? Heavy new supply typically softens prices + rents 12–24 months out; constrained supply supports both.
Investment metrics
- 1% rule
- 0.68% ✗
- Cap rate
- 5.53%
- Cash-on-cash
- -2.71%
- DSCR
- 0.88
- GRM
- 12.2
CMA / ARV
No comps found within radius.
Projected returns pro-forma
4.15% appreciation · 3.0% rent growth · sell at horizon
- IRR
- 8.3%
- Equity multiple
- 1.51×
- Total profit
- $22,961
- Equity at exit
- $83,521
- IRR
- 10.3%
- Equity multiple
- 2.74×
- Total profit
- $79,008
- Equity at exit
- $137,722
Cash invested: $45,360 (down + closing). Projections, not guarantees.
Landlord ↔ Tenant lean methodology
- Overall (STATE)
- 90 Strongly Landlord-Friendly
- State Louisiana
- 90 Strongly Landlord-Friendly · R+12
- County
- — inherits STATE
- City
- — inherits STATE
ZIP-level market 71418
- Home prices YoY
- 3.0%
- Active inventory
- 23
- Price-to-rent
- 12.2×
Monthly cashflow live
- Estimated rent
- $1,108 medium interval (Pro) →
- Mortgage (P&I)
- −$850
- Tax from tax record
- −$61 /mo · $726/yr
- Insurance
- −$68
- HOA
- −$0
- Vacancy / Maint / Mgmt
- −$233
- Net cashflow
- $-102
Break-even live
UW: 25.0% down · 7.5% · 30yr · 1.5% tax · 5.0% vac · 8.0% maint · 8.0% mgmt
Financing live
Cash to close
- Down payment
- $40,500
- Closing costs
- $4,860
- Reserves months
- —
- Total cash needed
- —
Loan-product check · same deal, 3 products live
Conventional
25% down · 7.5% · 30yr
- Down + closing
- —
- Monthly P&I
- —
- Monthly cashflow
- —
- DSCR
- —
- Eligible?
- —
Personal DTI + credit; lowest rate.
DSCR
20% down · 8.5% · 30yr
- Down + closing
- —
- Monthly P&I
- —
- Monthly cashflow
- —
- DSCR
- —
- Eligible?
- —
No personal income docs; deal must DSCR.
Hard money
10% down · 12.0% · 12mo
- Down + closing
- —
- Monthly P&I
- —
- Monthly cashflow
- —
- DSCR
- —
- Eligible?
- —
Short-term bridge; refi at stabilization.
Listing history 10 events
-
2026-06-19days on market $162,000 Active 11 DOM
-
2026-06-18days on market $162,000 Active 10 DOM
-
2026-06-17days on market $162,000 Active 9 DOM
-
2026-06-16days on market $162,000 Active 8 DOM
-
2026-06-15days on market $162,000 Active 7 DOM
-
2026-06-14days on market $162,000 Active 5 DOM
-
2026-06-13days on market $162,000 Active 4 DOM
-
2026-06-10days on market $162,000 Active 2 DOM
-
2026-06-09remarks 334-char remark
-
2026-06-09$162,000 Active 1 DOM
ⓘ Source: listings_history table (triggers on properties + properties_extension) + one-shot
backfill from property_details.listing_events for pre-trigger history.
Tax reassessment forecast LA · Resets to sale price
- Current annual tax
- $726 · $61/mo
- Projected year-2 tax
- $891 · $74/mo
- Expected delta
- +$165/yr (+$14/mo · 22.7%)
ⓘ Screening estimate from a state-policy table — verify with the county assessor before closing.
Climate risk First Street
- Flood 1/10 Low FEMA zone X · 0% chance over 30 yrs
- Wildfire 4/10 Moderate
- Heat 7/10 Severe 7 d/yr ≥112°F today · 19 d/yr by 30 yrs out
- Wind 8/10 Severe 80% chance of damaging wind over 30 yrs
- Air quality 1/10 Low 0 unhealthy d/yr today · 0 by 30 yrs out
Nearby sold comps map
Loading sold comps map…
Walkable amenities ~0.75 mi
Loading nearby amenities…
Taxation est. · year 1
- Rental income
- $13,293
- − Mortgage interest
- −$9,075
- − Property taxes
- −$726
- − Insurance
- −$810
- − Repairs & maintenance
- −$1,063
- − Management
- −$1,063
- − Depreciation
- −$4,713
- Taxable loss
- −$4,157
- Est. tax savings @ 24.0%
- +$998
- After-tax cash flow
- $-231/yr
For passive investors: Depreciation is non-cash, so a rental often shows a tax loss while cash-flowing — sheltering income. Rental losses are passive: they offset passive income freely, and up to $25,000/yr can offset ordinary (W-2) income if you actively participate and your MAGI is under $100k (phasing out to $0 by $150k); unused losses carry forward. On sale, claimed depreciation is recaptured at up to 25%, and gains may owe capital-gains tax (a 1031 exchange can defer both). Figures are a year-1 estimate at your 24.0% rate — not tax advice; consult a CPA.
Schools (NCES district)
- District
- Caldwell Parish
- NCES district ID
- 2200360
- Math proficiency
- 17% ▼ -36.00%
- Reading proficiency
- 34% ▼ -37.00%
- Median HH income
- $35,994
- Composite
- 21.07/100
- National rank
- #8444
- State rank
- #59 of 98 in LA
Livability — Columbia
- Score
- 58/100
- State rank
- #286
- US rank
- #20623
Category grades
Schools grade is shown separately in the Schools card above.
Census & demographics
- Census place
- Columbia, LA
- Population (ZIP)
- 5,351
Population outlook (Caldwell County) Hauer SSP2
- Today (2025)
- 9,826 people
- By 2030
- 9,663 · -1.7%
- By 2040
- 9,352 · -4.8%
- By 2050
- 9,053 · -7.9%
- By 2075
- 8,311 · -15.4%
- By 2100
- 7,237 · -26.3%
Race, ethnicity, and origin ACS 2023
- Neighborhood character
- Predominantly White (73%)
- Race & ethnicity
- White 73% Black 22% Hispanic / Latino 4% Two or more races 3%
- Common ancestry
- Lithuanian 6% Estonian 1% Scotch-Irish 1%
- Foreign-born
- 2% · Canada
- Languages at home
- 97% English-only · Spanish 3%
Political lean MEDSL · Caldwell
- 2024 margin
- Solid R (+72.5) · D 13.4% · R 85.9%
- 2008→2024 swing
- -19.9pp toward R · 2008: -52.7pp · 2024: -72.5pp
- All cycles
- 2024: R+72.5 2020: R+67.8 2016: R+64.7 2012: R+55.6 2008: R+52.7
Not yet ingested
- Civics
- —
Market trends
- HPI YoY
- ▲ 4.15%
- Current HPI
- 140.9489
- Rent YoY
- —
- Metro
- —
- State GDP YoY
- ▲ 3.29%
- F500 in state
- 10
Industry mix (Fortune 500 HQ in LA)
| Industry | F500 HQs | Revenue |
|---|---|---|
| Telecommunications | 2 | $23B |
|
||
| Utilities | 1 | $12B |
|
||
| Wholesale / Distribution | 1 | $5B |
|
||
| Advertising | 1 | $2B |
|
||
Price history
1 event — show timeline
- 2026-06-08 Listed $162,000 NELABOR
Property tax history
+1.2%/yrLatest (2025): $726 · +1.7% YoY. Source: county tax records.
Cash-flow waterfall
monthlySold comps — $/sqft
last 12 mo · ≤1 miLoading sold comps…