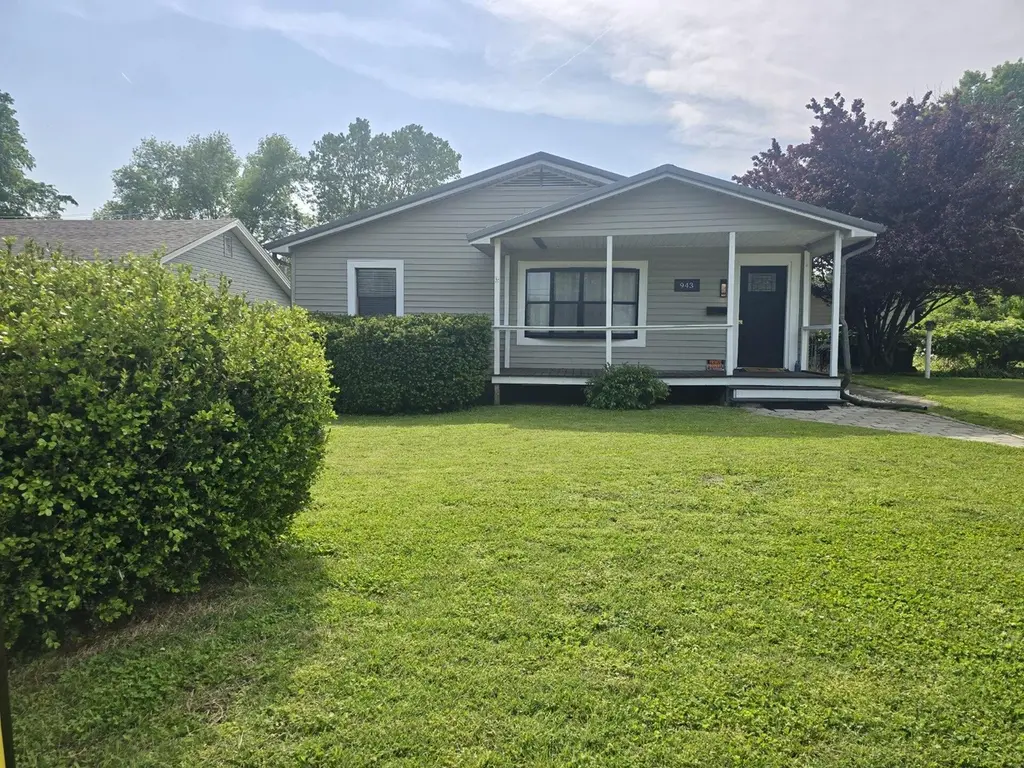
943 S Landrum St · Mount Vernon, MO
Flood risk 6/10 · Moderate
- FEMA flood zone
- X (unshaded)
- Chance of flooding over 30 yrs
- 0.71%
- Est. flood insurance / yr
- $507 – $1,088
Fire risk 4/10 · Minor
- Est. fire insurance / yr
- $1,054 – $1,958
Heat risk 5/10 · Moderate
- Hot days now (above 105°F)
- 7 days/yr
- Hot days in 30 yrs
- 19 days/yr
Wind risk 2/10 · Minimal
- Chance of severe wind over 30 yrs
- 1.0%
Air-quality risk 2/10 · Minimal
- Unhealthy air days now
- 1 days/yr
- Unhealthy air days in 30 yrs
- 2 days/yr
Risk factors via First Street. Map © Google.
Why this score? — see what drove the D grade
The composite is a weighted blend of 9 inputs, each scored 0–100. Each bar is that input's sub-score; the figure is the points it added to the 100-point composite (weight × sub-score).
- Cash flow +15.0/30.0
- ARV discount +7.5/15.0
- DSCR +4.6/10.0
- Livability +3.6/5.0
- Schools +3.5/10.0
- 1% rule +2.9/10.0
- Rent growth +2.5/5.0
- Condition / age +2.5/5.0
- Appreciation +0.0/10.0
$207,000
🖨 Deal sheet 📄 Offer letter ✓ Due diligence
Listing remarks MLS
Great home with many upgrades. Very conveniently located, close to shopping and Schools. Living room is very nice sized and Kitchen has been remodeled and all appliances stay with home accept W/ D. This home is 4 bedrooms and 1 1/2 baths. the fourth bedroom could be an office or a dining room. It also features a glassed in sunroom which is not included in the sq ft. , fenced in back yard and storage building.
Key facts
- Wood floors
- Usable counter space
- Built in cabinetry
Tags
Property features AI
Exterior
- Parking: Driveway
- Security: Smoke detector(s)
- Utilities: Public water; Public sewer
- Home design: Single-family residence; One story
- Construction: Vinyl siding; Metal roof
- Exterior features: Rain gutters; Covered patio; Chain link fencing; Shed(s)
Interior
- Kitchen: Electric oven; Electric cooktop; Free-standing electric oven; Dishwasher
- Bedrooms: Bedrooms with walk-in closet(s)
- Flooring: Hardwood; Laminate
- Bathrooms: 1 full bathroom; 1 half bathroom
- Heating & cooling: Central heating (natural gas); Central air; Ceiling fan(s); Attic fan
- Interior features: High-speed internet; Walk-in closet(s); Insulated windows with blinds and other window coverings; Disposal
- Laundry & utility: Laundry on main level; Gas water heater
Neighborhood map
What this means for you Summary
Snapshot
- This is a 3-bed/1.0-bath other listed at $207k.
Deal economics
- At list price, monthly cash flow is $64 ($768/yr) — positive.
- The deal already cash-flows at list — no discount required.
- To meet the 1% rule (rent ≥ 1% of price), the offer needs to be $163k (21.0% below list).
- Recommended offer: $163k (21.0% below list) — sets the bar for 1% rule.
- Cap rate 6.7% vs local median 4.3% in Mount Vernon — top-decile yield for the area; either an underpriced asset or a hidden risk that comps aren't pricing in. Stress-test before assuming the spread holds.
Location & tenants
- Location reads 72/100 on livability (#98 in MO) — a middle-class / working-renter tenant base. Strengths: crime A+, cost of living A+, housing A+; Watch: amenities F, commute F, employment F.
- Mt. Vernon R-V (town): math 35% / reading 48% proficiency, ranked #129 of 324 in MO (top 40%) — families likely to look elsewhere, expect single-tenant / working-renter base with shorter leases.
- Zoned schools: Mt. Vernon Elem. (308 students, 53% FRL); Mt. Vernon Middle (math 36% / reading 43%, grade F, #189 of 391 statewide, top 51%, 361 students, 48% FRL); Mt. Vernon High (math 17% / reading 52%, grade F, #321 of 521 statewide, top 67%, 458 students, 37% FRL) — zoned schools at 46% FRL track the district average.
- Market conditions: 87 active listings in the ZIP; 2 comparable units currently listed for rent nearby; 67 units permitted in Lawrence County in 2024 (35 in 5+ unit buildings).
Forward outlook
- Local home prices are declining (-3.0%/yr); year-one equity from $1k of loan paydown is wiped out by about $6k of value loss. Plan a longer hold.
- Lawrence County population projected at -15% by 2050 — secular population decline; favor cash flow + early exit over multi-decade hold.
Negotiation context
- Only 6 days on market — expect competitive offers; lowballing is unlikely to land.
- 5 sale attempts since 11y ago; this cycle's ask has dropped $13k (6%) from the opening price — seller is motivated, your offer sets the floor, not the list.
Risks & watch-outs
- Watch-outs: built in 1930 — expect roof / HVAC / electrical / plumbing capex.
- Climate carrying-cost: major flood risk; extreme-heat days projected 7→19/yr by 2055 (HVAC capex compounding) — expect insurance premiums to compound above CPI over the hold.
Questions for the listing agent
- Built in 1930 — when were the roof, HVAC, electrical panel, plumbing, and water heater last replaced?
- Is there a deadline driving the sale (1031 exchange, divorce, estate, relocation)? That informs how much negotiation room exists.
- The area grade is low — what's the realistic commute time and amenity access for the typical tenant pool here? Any planned neighborhood developments (good or bad) we should know about?
- What's the average days-on-market for RENTAL listings here right now (not sales)? A rising rental-DOM trend means longer vacancies and softer asking-rent achievability than the comps imply.
- What's the recent tenant-quality profile in this submarket — average credit score on applications, eviction rate, late-payment / NSF rate, and stable-employment percentage? A property-management company in the area should have these aggregated.
- How much new for-sale + rental construction is in the pipeline within 1–3 miles? Heavy new supply typically softens prices + rents 12–24 months out; constrained supply supports both.
Investment metrics
- 1% rule
- 0.79% ✗
- Cap rate
- 6.66%
- Cash-on-cash
- 1.33%
- DSCR
- 1.06
- GRM
- 10.6
CMA / ARV
No comps found within radius.
Projected returns pro-forma
-3.0% appreciation · 3.0% rent growth · sell at horizon
- IRR
- -14.2%
- Equity multiple
- 0.49×
- Total profit
- $-29,565
- Equity at exit
- $30,864
- IRR
- -5.6%
- Equity multiple
- 0.64×
- Total profit
- $-20,901
- Equity at exit
- $17,898
Cash invested: $57,960 (down + closing). Projections, not guarantees.
Landlord ↔ Tenant lean methodology
- Overall (STATE)
- 81 Strongly Landlord-Friendly
- State Missouri
- 81 Strongly Landlord-Friendly · R+10
- County
- — inherits STATE
- City
- — inherits STATE
ZIP-level market 65712
- Home prices YoY
- -17.5%
- Active inventory
- 87
- Price-to-rent
- 10.6×
Monthly cashflow live
- Estimated rent
- $1,635 medium interval (Pro) →
- Mortgage (P&I)
- −$1,086
- Tax from tax record
- −$56 /mo · $669/yr
- Insurance
- −$86
- HOA
- −$0
- Vacancy / Maint / Mgmt
- −$343
- Net cashflow
- $64
Break-even live
UW: 25.0% down · 7.5% · 30yr · 1.5% tax · 5.0% vac · 8.0% maint · 8.0% mgmt
Financing live
Cash to close
- Down payment
- $51,750
- Closing costs
- $6,210
- Reserves months
- —
- Total cash needed
- —
Loan-product check · same deal, 3 products live
Conventional
25% down · 7.5% · 30yr
- Down + closing
- —
- Monthly P&I
- —
- Monthly cashflow
- —
- DSCR
- —
- Eligible?
- —
Personal DTI + credit; lowest rate.
DSCR
20% down · 8.5% · 30yr
- Down + closing
- —
- Monthly P&I
- —
- Monthly cashflow
- —
- DSCR
- —
- Eligible?
- —
No personal income docs; deal must DSCR.
Hard money
10% down · 12.0% · 12mo
- Down + closing
- —
- Monthly P&I
- —
- Monthly cashflow
- —
- DSCR
- —
- Eligible?
- —
Short-term bridge; refi at stabilization.
Rent comps 2 comps
| Address | Beds | Baths | Sqft | Rent | $/sqft | DOM | Units | Dist |
|---|---|---|---|---|---|---|---|---|
| 212 W Blaze Rd Mount Vernon, MO | 3.0 | 2.0 | 1600 | $1,650 | $1.03 | 13d | 1 | 0.15mi |
| 1706 S Hazel St Mt Vernon, MO | 3.0 | 2.0 | 1419 | $1,595 | $1.12 | 13d | 1 | 0.36mi |
Listing history 26 events
-
2026-06-18price $207,000 Active 6 DOM
-
2026-06-18days on market $214,000 Active 6 DOM
-
2026-06-17days on market $214,000 Active 5 DOM
-
2026-06-16days on market $214,000 Active 4 DOM
-
2026-06-15days on market $214,000 Active 3 DOM
-
2026-06-13days on market $214,000 Active 1 DOM
-
2026-06-10days on market $214,000 Active 40 DOM
-
2026-06-09days on market $214,000 Active 39 DOM
-
2026-06-08days on market $214,000 Active 38 DOM
-
2026-06-07pricedays on market $214,000 Active 37 DOM
-
2026-06-03days on market $219,900 Active 33 DOM
-
2026-06-02days on market $219,900 Active 32 DOM
-
2026-06-01days on market $219,900 Active 31 DOM
-
2026-05-31days on market $219,900 Active 30 DOM
-
2026-05-30days on market $219,900 Active 29 DOM
-
2026-05-01$219,900 Active
-
2026-04-18status Active
-
2026-03-16status Pending
-
2026-03-13$219,900 Active
-
2021-08-30soldstatus 412-char remark
Show marketing remark (412 chars)
Great home with many upgrades. Very conveniently located, close to shopping and Schools. Living room is very nice sized and Kitchen has been remodeled and all appliances stay with home accept W/ D. This home is 4 bedrooms and 1 1/2 baths. the fourth bedroom could be an office or a dining room. It also features a glassed in sunroom which is not included in the sq ft. , fenced in back yard and storage building.
-
2021-08-30soldstatus
Show marketing remark (412 chars)
Great home with many upgrades. Very conveniently located, close to shopping and Schools. Living room is very nice sized and Kitchen has been remodeled and all appliances stay with home accept W/ D. This home is 4 bedrooms and 1 1/2 baths. the fourth bedroom could be an office or a dining room. It also features a glassed in sunroom which is not included in the sq ft. , fenced in back yard and storage building.
-
2021-07-14$125,000 412-char remark
Show marketing remark (412 chars)
Great home with many upgrades. Very conveniently located, close to shopping and Schools. Living room is very nice sized and Kitchen has been remodeled and all appliances stay with home accept W/ D. This home is 4 bedrooms and 1 1/2 baths. the fourth bedroom could be an office or a dining room. It also features a glassed in sunroom which is not included in the sq ft. , fenced in back yard and storage building.
-
2015-09-04soldstatus
-
2015-09-04soldstatus
-
2015-07-30$73,990
ⓘ Source: listings_history table (triggers on properties + properties_extension) + one-shot
backfill from property_details.listing_events for pre-trigger history.
Tax reassessment forecast MO · Resets to sale price
- Current annual tax
- $669 · $56/mo
- Projected year-2 tax
- $2,008 · $167/mo
- Expected delta
- +$1,339/yr (+$112/mo · 200.2%)
ⓘ Screening estimate from a state-policy table — verify with the county assessor before closing.
Climate risk First Street
- Flood 6/10 Major FEMA zone X (unshaded) · 71% chance over 30 yrs
- Wildfire 4/10 Moderate
- Heat 5/10 Major 7 d/yr ≥105°F today · 19 d/yr by 30 yrs out
- Wind 2/10 Low 100% chance of damaging wind over 30 yrs
- Air quality 2/10 Low 1 unhealthy d/yr today · 2 by 30 yrs out
Nearby sold comps map
Loading sold comps map…
Walkable amenities ~0.75 mi
Loading nearby amenities…
Taxation est. · year 1
- Rental income
- $19,618
- − Mortgage interest
- −$11,595
- − Property taxes
- −$669
- − Insurance
- −$1,035
- − Repairs & maintenance
- −$1,569
- − Management
- −$1,569
- − Depreciation
- −$6,022
- Taxable loss
- −$2,842
- Est. tax savings @ 24.0%
- +$682
- After-tax cash flow
- $1,450/yr
For passive investors: Depreciation is non-cash, so a rental often shows a tax loss while cash-flowing — sheltering income. Rental losses are passive: they offset passive income freely, and up to $25,000/yr can offset ordinary (W-2) income if you actively participate and your MAGI is under $100k (phasing out to $0 by $150k); unused losses carry forward. On sale, claimed depreciation is recaptured at up to 25%, and gains may owe capital-gains tax (a 1031 exchange can defer both). Figures are a year-1 estimate at your 24.0% rate — not tax advice; consult a CPA.
Schools (NCES district)
- District
- Mt. Vernon R-V
- NCES district ID
- 2921600
- Math proficiency
- 35% ▼ -4.00%
- Reading proficiency
- 48% ▼ -1.00%
- Median HH income
- $43,114
- Composite
- 35.03/100
- National rank
- #5040
- State rank
- #129 of 324 in MO
Livability — Mount Vernon
- Score
- 72/100
- State rank
- #98
- US rank
- #6475
Category grades
Schools grade is shown separately in the Schools card above.
Census & demographics
- Census place
- Mount Vernon, MO
- Population (ZIP)
- 8,910
Population outlook (Lawrence County) Hauer SSP2
- Today (2025)
- 37,142 people
- By 2030
- 36,212 · -2.5%
- By 2040
- 34,080 · -8.2%
- By 2050
- 31,621 · -14.9%
- By 2075
- 25,987 · -30.0%
- By 2100
- 20,151 · -45.7%
Race, ethnicity, and origin ACS 2023
- Neighborhood character
- Predominantly White (94%)
- Race & ethnicity
- White 94% Two or more races 4% Hispanic / Latino 2%
- Common ancestry
- Lithuanian 3% Slovak 2% Iranian 2%
- Foreign-born
- 2% · Canada
- Languages at home
- 95% English-only · Other Indo-European 2% Spanish 2% German/W. Germanic 1%
Political lean MEDSL · Lawrence
- 2024 margin
- Solid R (+63.8) · D 17.6% · R 81.5%
- 2008→2024 swing
- -26.8pp toward R · 2008: -37.1pp · 2024: -63.8pp
- All cycles
- 2024: R+63.8 2020: R+62.6 2016: R+61.1 2012: R+47.0 2008: R+37.1
Not yet ingested
- Civics
- —
Market trends
- HPI YoY
- ▼ -51.55%
- Current HPI
- 243.6185
- Rent YoY
- —
- Metro
- —
- State GDP YoY
- ▲ 1.84%
- F500 in state
- 20
Industry mix (Fortune 500 HQ in MO)
| Industry | F500 HQs | Revenue |
|---|---|---|
| Healthcare | 1 | $163B |
|
||
| Insurance | 1 | $21B |
|
||
| Industrial Technology | 1 | $17B |
|
||
| Retail | 1 | $16B |
|
||
| Industrial Distribution | 1 | $10B |
|
||
| Utilities | 1 | $9B |
|
||
Price history
+197.2% since first listed11 events — show timeline
- 2026-05-01 Listed $219,900 SOMO
- 2026-04-18 Relisted — SOMO
- 2026-03-16 Pending — SOMO
- 2026-03-13 Listed $219,900 SOMO
- 2021-08-30 Sold (Public Records) — Public Records
- 2021-08-30 Sold (Public Records) — Public Records
- 2021-08-30 Sold (MLS) — SOMO
- 2021-07-14 Listed $125,000 SOMO
- 2015-09-04 Sold (Public Records) — Public Records
- 2015-09-04 Sold (MLS) — SOMO
- 2015-07-30 Listed $73,990 SOMO
Property tax history
+3.7%/yrLatest (2025): $669 · +8.4% YoY. Source: county tax records.
Cash-flow waterfall
monthlySold comps — $/sqft
last 12 mo · ≤1 miLoading sold comps…