5450 Monterey Rd #142 · San Jose, CA
Flood risk 1/10 · Minimal
- FEMA flood zone
- D
- Chance of flooding over 30 yrs
- 0.0%
- Est. flood insurance / yr
- $544 – $1,084
Fire risk 5/10 · Moderate
- Est. fire insurance / yr
- $659 – $1,223
Heat risk 5/10 · Moderate
- Hot days now (above 96°F)
- 7 days/yr
- Hot days in 30 yrs
- 14 days/yr
Wind risk 1/10 · Minimal
- Chance of severe wind over 30 yrs
- —
Air-quality risk 9/10 · Severe
- Unhealthy air days now
- 19 days/yr
- Unhealthy air days in 30 yrs
- 19 days/yr
Risk factors via First Street. Map © Google.
Why this score? — see what drove the C+ grade
The composite is a weighted blend of 9 inputs, each scored 0–100. Each bar is that input's sub-score; the figure is the points it added to the 100-point composite (weight × sub-score).
- Cash flow +20.9/30.0
- ARV discount +13.6/15.0
- DSCR +6.7/10.0
- 1% rule +5.5/10.0
- Schools +4.9/10.0
- Livability +3.9/5.0
- Rent growth +2.8/5.0
- Condition / age +2.5/5.0
- Appreciation +0.0/10.0
$409,000
🖨 Deal sheet 📄 Offer letter ✓ Due diligence
Listing remarks MLS
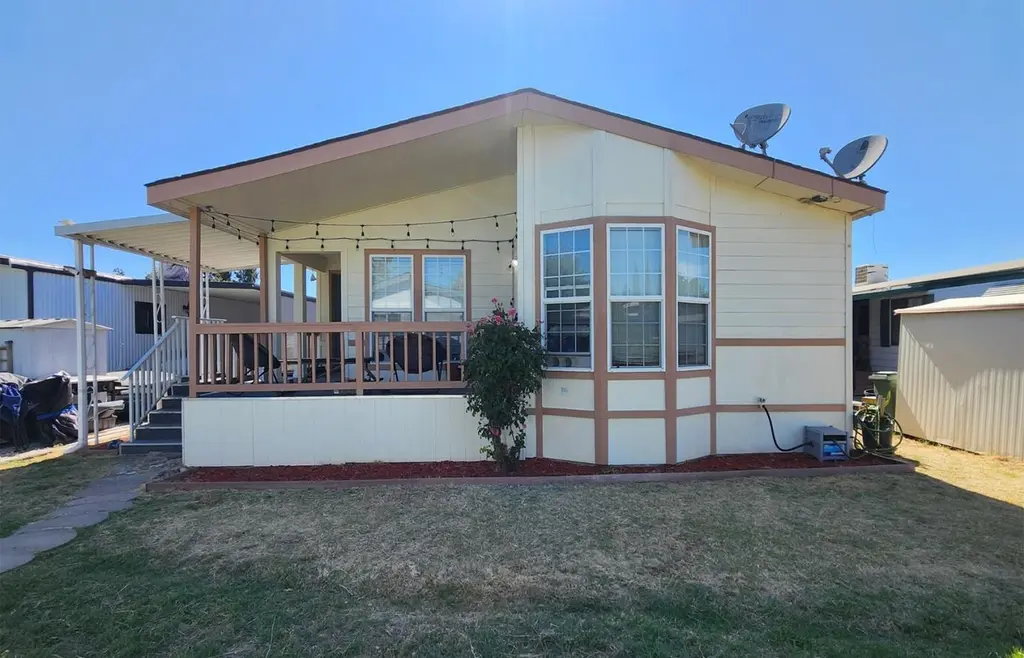
This charming 1998 Silvercrest home offers 1,734 square feet of living space with 3 bedrooms, 2 full bathrooms, and an office. Spacious living room features cathedral ceiling, cozy fireplace, built-in wall shelves, and laminated floor throughout the entire home. The kitchen is highlighted with granite countertop, large center island for bar seating and stainless-steel appliances. Large master bedroom includes 2 walk-in closets, bathroom with a soaking tub and a walk-in shower. Laundry room offers a washer and dryer with additional storage cabinets. The home has 6 inches wall compares to 4 inches wall in older homes, has interior sheetrock walls verses wood panels, comes with dual paned windows, equips with earthquake safety system underneath the home, and has with conditioning and central heating for your comfort. Park amenities include a club house, billiard room, community pool, and exercise gym. It is located near restaurants, shopping areas, and easy freeways access. Space rent is only $1,277. Don't miss the chance to make this your dream home.
Key facts
- Large center island
- Soaking tub
- Walk in closets
Tags
Property features AI
Finance
- Other: Living area approximately 1,734 (source: assessor)
- Financial info: Space rent: $1,277
- HOA & community: Community pool; Club house; Billiard room; Gym / exercise facility
Exterior
- Parking: Assigned space number 142 (space rent applies)
- Utilities: Public water; Public sewer; Public utilities
- Home design: Manufactured home within a family park; Unit will remain on park home site
- Exterior features: Shingle roof
Interior
- Kitchen: Breakfast bar (kitchen/dining connection)
- Bedrooms: 3 bedrooms
- Bathrooms: 2 full bathrooms
- Heating & cooling: Central forced air cooling; Gas heating
- Interior features: Breakfast bar in dining area; Family room (see remarks); Gas-burning fireplace
Neighborhood map
What this means for you Summary
Snapshot
- This is a 3-bed/2.0-bath manufactured listed at $409k.
Deal economics
- At list price, monthly cash flow is $572 ($7k/yr) — positive.
- The deal already cash-flows at list — no discount required.
- Meets the 1% rule at list price ($4k rent vs $409k).
- Recommended offer: $403k (1.5% below list) — sets the bar for market timing.
- Cap rate 8.0% vs local median 1.6% in San Jose — top-decile yield for the area; either an underpriced asset or a hidden risk that comps aren't pricing in. Stress-test before assuming the spread holds.
Location & tenants
- Location reads 78/100 on livability (#68 in CA, #2,559 nationally) — a middle-class / working-renter tenant base. Strengths: amenities A+, commute A+, employment A+; Watch: crime F, cost of living F.
- Oak Grove Elementary (urban): math 47% / reading 54% proficiency, ranked #339 of 1,400 in CA (top 24%) — acceptable for families but not a draw, mixed tenant base, ~2y average lease.
- Market conditions: Rents rising (+1.0%/yr); 65 active listings in the ZIP; 18 comparable units currently listed for rent nearby; rentals leasing fast (median 2d on market — plan ~1-2 weeks tenant-placement turnaround); solid renter incomes; 3,838 units permitted in Santa Clara County in 2024 (1,886 in 5+ unit buildings).
- At $4,301/mo this rent would consume 51% of the median local household income ($101k/yr) (locally 1808% of renters already pay >50% of income on rent) — very limited rent-growth headroom before tenants either downsize or default.
Forward outlook
- Local home prices are declining (-3.0%/yr); year-one equity from $3k of loan paydown is wiped out by about $12k of value loss. Plan a longer hold.
- Santa Clara County population projected at +24% by 2050 — long-run rental-demand tailwind backs the buy-and-hold thesis.
Negotiation context
- It's been on market 21 days — a 2% lower offer ($403k) is reasonable based on typical stale-listing flexibility.
- 7 sale attempts since 21y ago with the ask held roughly flat each time — persistent listings suggest the price (not the market) is what's stuck; bring a comps-based counter.
- Current owner paid $305k; 34% above their basis — modest negotiation headroom, anchor on the comps not their cost.
Risks & watch-outs
- Climate carrying-cost: moderate wildfire risk; extreme-heat days projected 7→14/yr by 2055 (HVAC capex compounding) — expect insurance premiums to compound above CPI over the hold.
Questions for the listing agent
- Is there a deadline driving the sale (1031 exchange, divorce, estate, relocation)? That informs how much negotiation room exists.
- Crime grade is F in this area — have there been break-ins, vandalism, or insurance claims at this property in the last 3 years? What carrier currently insures it and at what premium?
- What's the average days-on-market for RENTAL listings here right now (not sales)? A rising rental-DOM trend means longer vacancies and softer asking-rent achievability than the comps imply.
- What's the recent tenant-quality profile in this submarket — average credit score on applications, eviction rate, late-payment / NSF rate, and stable-employment percentage? A property-management company in the area should have these aggregated.
- How much new for-sale + rental construction is in the pipeline within 1–3 miles? Heavy new supply typically softens prices + rents 12–24 months out; constrained supply supports both.
Investment metrics
- 1% rule
- 1.05% ✓
- Cap rate
- 7.97%
- Cash-on-cash
- 5.99%
- DSCR
- 1.27
- GRM
- 7.9
CMA / ARV
- ARV (on-the-fly)
- $473,382
- Comps found
- 12
Show comp detail 12 sales within ~0.75 mi
| Address | Dist | Beds/Ba | Sqft | Sold | Price | $/sf | Match |
|---|---|---|---|---|---|---|---|
| 5450 Monterey Rd #23 | 0.01mi | 3/2.0 | 1,740 (+0%) | 9mo | $380,000 | $218 | 92 |
| 5450 Monterey Hwy #164 | 0.00mi | 3/3.0 | 1,760 (+2%) | 4mo | $480,000 | $273 | 90 |
| 5450 Monterey Rd #143 | 0.17mi | 3/2.0 | 1,536 (-11%) | 2mo | $270,000 | $176 | 71 |
| 513 Olivian Dr #513 | 0.38mi | 3/2.0 | 1,832 (+6%) | 11mo | $585,000 | $319 | 64 |
| 165 Blossom Hill Rd #369 | 0.55mi | 4/2.0 (+1) | 1,830 (+6%) | 2mo | $449,000 | $245 | 58 |
| 195 Blossom Hill Rd #215 | 0.67mi | 3/2.0 | 1,800 (+4%) | 8mo | $460,000 | $256 | 56 |
| 200 Ford Rd #168 | 0.59mi | 3/2.0 | 1,568 (-10%) | 6mo | $412,000 | $263 | 51 |
| 165 Blossom Hill Rd #145 | 0.59mi | 3/2.0 | 1,500 (-14%) | 1mo | $445,000 | $297 | 49 |
| 165 Blossom Hl #104 | 0.50mi | 3/2.0 | 1,534 (-12%) | 11mo | $430,000 | $280 | 48 |
| 200 Ford Rd #180 | 0.59mi | 4/2.0 (+1) | 1,531 (-12%) | 7mo | $410,000 | $268 | 42 |
| 165 Blossom Hill Rd #113 | 0.64mi | 3/2.0 | 1,500 (-14%) | 7mo | $415,000 | $277 | 42 |
| 200 Ford Rd #242 | 0.59mi | 4/3.0 (+1) | 1,500 (-14%) | 10mo | $438,000 | $292 | 33 |
Match score weights: distance 35% · size 25% · config 20% · recency 20%. Top-matched comps best support the ARV.
Projected returns pro-forma
-3.0% appreciation · 1.0% rent growth · sell at horizon
- IRR
- -9.3%
- Equity multiple
- 0.67×
- Total profit
- $-38,289
- Equity at exit
- $60,983
- IRR
- -2.8%
- Equity multiple
- 0.83×
- Total profit
- $-19,651
- Equity at exit
- $35,363
Cash invested: $114,520 (down + closing). Projections, not guarantees.
Landlord ↔ Tenant lean methodology
- Overall (CITY)
- 0 Strongly Tenant-Friendly
- State California
- 18 Strongly Tenant-Friendly · D+13
- County
- — inherits STATE
- City San Jose
- 0 Strongly Tenant-Friendly · D+24
ZIP-level market 95111
- Rents YoY
- 1.0%
- Active inventory
- 65
- Price-to-rent
- 7.9×
Monthly cashflow live
- Estimated rent
- $4,301 high interval (Pro) →
- Mortgage (P&I)
- −$2,145
- Tax est. 1.5%
- −$511 /mo · $6,135/yr
- Insurance
- −$170
- HOA
- −$0
- Vacancy / Maint / Mgmt
- −$903
- Net cashflow
- $572
Break-even live
UW: 25.0% down · 7.5% · 30yr · 1.5% tax · 5.0% vac · 8.0% maint · 8.0% mgmt
Financing live
Cash to close
- Down payment
- $102,250
- Closing costs
- $12,270
- Reserves months
- —
- Total cash needed
- —
Loan-product check · same deal, 3 products live
Conventional
25% down · 7.5% · 30yr
- Down + closing
- —
- Monthly P&I
- —
- Monthly cashflow
- —
- DSCR
- —
- Eligible?
- —
Personal DTI + credit; lowest rate.
DSCR
20% down · 8.5% · 30yr
- Down + closing
- —
- Monthly P&I
- —
- Monthly cashflow
- —
- DSCR
- —
- Eligible?
- —
No personal income docs; deal must DSCR.
Hard money
10% down · 12.0% · 12mo
- Down + closing
- —
- Monthly P&I
- —
- Monthly cashflow
- —
- DSCR
- —
- Eligible?
- —
Short-term bridge; refi at stabilization.
Rent comps 18 comps
| Address | Beds | Baths | Sqft | Rent | $/sqft | DOM | Units | Dist |
|---|---|---|---|---|---|---|---|---|
| 5491 Demerest Ln San Jose, CA | 3.0 | 2.5 | 1335 | $4,800 | $3.60 | 1d | 1 | 0.41mi |
| 5560 Lexington Ave San Jose, CA | 2.0 | 1.0–2.0 | 846 | $3,530 | $4.17 | 1d | 14 | 0.46mi |
| 5590 Makati Cir San Jose, CA | 2.0 | 2.0 | 1233 | $3,395 | $2.75 | 2d | 1 | 0.82mi |
| 5683 Beswick Dr San Jose, CA | 2.0 | 1.0 | 1100 | $3,200 | $2.91 | 3d | 1 | 0.83mi |
| 5805 Charlotte Dr San Jose, CA | 1.0–3.0 | 1.0–2.0 | 1050 | $4,965 | $4.73 | 1d | 18 | 0.97mi |
| 5823 Brandon Ct San Jose, CA | 4.0 | 3.5 | 2250 | $4,700 | $2.09 | 14d | 1 | 0.97mi |
| 5002 Brook Valley Loop San Jose, CA | 3.0 | 3.0 | 1992 | $4,500 | $2.26 | 1d | 1 | 1.04mi |
| 5925 Charlotte Dr San Jose, CA | 2.0 | 2.0 | 1261 | $3,900 | $3.09 | 1d | 2 | 1.11mi |
| 5959 Charlotte Dr San Jose, CA | 3.0 | 4.0 | 1700 | $4,000 | $2.35 | 3d | 1 | 1.15mi |
| 5659 Lathrop Dr San Jose, CA | 3.0 | 2.0 | 1543 | $4,300 | $2.79 | 1d | 1 | 1.25mi |
| 150 Palm Valley Blvd San Jose, CA | 1.0–3.0 | 1.0–2.0 | 1028 | $5,169 | $5.03 | 1d | 26 | 1.26mi |
| 6809 Canine Ct San Jose, CA | 3.0 | 3.0 | 1822 | $4,375 | $2.40 | 1d | 1 | 1.26mi |
| 250 Palm Valley Blvd San Jose, CA | 1.0–3.0 | 1.0–2.0 | 1014 | $4,357 | $4.30 | 1d | 7 | 1.28mi |
| 6320 Island Pine Way San Jose, CA | 2.0 | 2.5 | 1293 | $4,200 | $3.25 | 3d | 1 | 1.34mi |
| 6320 Island Pine Way San Jose, CA | 2.0 | 2.5 | 1293 | $4,200 | $3.25 | 1d | 1 | 1.34mi |
| 6818 Chroma Ct San Jose, CA | 3.0 | 3.0 | 1563 | $4,295 | $2.75 | 10d | 1 | 1.37mi |
| 6568 Vision Ct San Jose, CA | 2.0 | 2.0 | 1096 | $4,200 | $3.83 | 1d | 1 | 1.38mi |
| 6670 Emergent Way San Jose, CA | 1.0–3.0 | 1.0–2.0 | 1024 | $4,953 | $4.83 | 1d | 4 | 1.43mi |
Listing history 33 events
-
2026-06-18days on market $409,000 Active 21 DOM
-
2026-06-17days on market $409,000 Active 20 DOM
-
2026-06-16days on market $409,000 Active 19 DOM
-
2026-06-15days on market $409,000 Active 18 DOM
-
2026-06-13days on market $409,000 Active 16 DOM
-
2026-06-13days on market $409,000 Active 15 DOM
-
2026-06-09days on market $409,000 Active 12 DOM
-
2026-06-08days on market $409,000 Active 11 DOM
-
2026-06-07days on market $409,000 Active 10 DOM
-
2026-06-05days on market $409,000 Active 7 DOM
-
2026-06-03days on market $409,000 Active 6 DOM
-
2026-06-02days on market $409,000 Active 5 DOM
-
2026-06-01days on market $409,000 Active 4 DOM
-
2026-05-31days on market $409,000 Active 3 DOM
-
2026-03-30status Pending 1064-char remark
Show marketing remark (1064 chars)
This charming 1998 Silvercrest home offers 1,734 square feet of living space with 3 bedrooms, 2 full bathrooms, and an office. Spacious living room features cathedral ceiling, cozy fireplace, built-in wall shelves, and laminated floor throughout the entire home. The kitchen is highlighted with granite countertop, large center island for bar seating and stainless-steel appliances. Large master bedroom includes 2 walk-in closets, bathroom with a soaking tub and a walk-in shower. Laundry room offers a washer and dryer with additional storage cabinets. The home has 6 inches wall compares to 4 inches wall in older homes, has interior sheetrock walls verses wood panels, comes with dual paned windows, equips with earthquake safety system underneath the home, and has with conditioning and central heating for your comfort. Park amenities include a club house, billiard room, community pool, and exercise gym. It is located near restaurants, shopping areas, and easy freeways access. Space rent is only $1,277. Don't miss the chance to make this your dream home.
-
2026-03-30historical Contingent 1064-char remark
Show marketing remark (1064 chars)
This charming 1998 Silvercrest home offers 1,734 square feet of living space with 3 bedrooms, 2 full bathrooms, and an office. Spacious living room features cathedral ceiling, cozy fireplace, built-in wall shelves, and laminated floor throughout the entire home. The kitchen is highlighted with granite countertop, large center island for bar seating and stainless-steel appliances. Large master bedroom includes 2 walk-in closets, bathroom with a soaking tub and a walk-in shower. Laundry room offers a washer and dryer with additional storage cabinets. The home has 6 inches wall compares to 4 inches wall in older homes, has interior sheetrock walls verses wood panels, comes with dual paned windows, equips with earthquake safety system underneath the home, and has with conditioning and central heating for your comfort. Park amenities include a club house, billiard room, community pool, and exercise gym. It is located near restaurants, shopping areas, and easy freeways access. Space rent is only $1,277. Don't miss the chance to make this your dream home.
-
2026-03-12$405,000 Active 1064-char remark
Show marketing remark (1064 chars)
This charming 1998 Silvercrest home offers 1,734 square feet of living space with 3 bedrooms, 2 full bathrooms, and an office. Spacious living room features cathedral ceiling, cozy fireplace, built-in wall shelves, and laminated floor throughout the entire home. The kitchen is highlighted with granite countertop, large center island for bar seating and stainless-steel appliances. Large master bedroom includes 2 walk-in closets, bathroom with a soaking tub and a walk-in shower. Laundry room offers a washer and dryer with additional storage cabinets. The home has 6 inches wall compares to 4 inches wall in older homes, has interior sheetrock walls verses wood panels, comes with dual paned windows, equips with earthquake safety system underneath the home, and has with conditioning and central heating for your comfort. Park amenities include a club house, billiard room, community pool, and exercise gym. It is located near restaurants, shopping areas, and easy freeways access. Space rent is only $1,277. Don't miss the chance to make this your dream home.
-
2026-02-13historical
-
2025-12-04price
-
2025-11-05Active
-
2025-10-25historical
-
2025-09-02price
-
2025-07-25Active
-
2021-07-16soldstatus $305,000 Sold
-
2021-05-20status Pending (Do Not Show)
-
2021-05-17$299,999 Active
-
2013-04-26soldstatus $96,000 Sold
-
2013-03-04$97,900
-
2013-03-04historical
-
2005-12-01historical
-
2005-11-10soldstatus $115,000
-
2005-10-18$125,000
ⓘ Source: listings_history table (triggers on properties + properties_extension) + one-shot
backfill from property_details.listing_events for pre-trigger history.
Climate risk First Street
- Flood 1/10 Low FEMA zone D · 0% chance over 30 yrs
- Wildfire 5/10 Major
- Heat 5/10 Major 7 d/yr ≥96°F today · 14 d/yr by 30 yrs out
- Wind 1/10 Low
- Air quality 9/10 Extreme 19 unhealthy d/yr today · 19 by 30 yrs out
Nearby sold comps map
Loading sold comps map…
Walkable amenities ~0.75 mi
Loading nearby amenities…
Taxation est. · year 1
- Rental income
- $51,618
- − Mortgage interest
- −$22,910
- − Property taxes
- −$6,135
- − Insurance
- −$2,045
- − Repairs & maintenance
- −$4,129
- − Management
- −$4,129
- − Depreciation
- −$11,898
- Taxable income
- $370
- Est. tax owed @ 24.0%
- −$89
- After-tax cash flow
- $6,771/yr
For passive investors: Depreciation is non-cash, so a rental often shows a tax loss while cash-flowing — sheltering income. Rental losses are passive: they offset passive income freely, and up to $25,000/yr can offset ordinary (W-2) income if you actively participate and your MAGI is under $100k (phasing out to $0 by $150k); unused losses carry forward. On sale, claimed depreciation is recaptured at up to 25%, and gains may owe capital-gains tax (a 1031 exchange can defer both). Figures are a year-1 estimate at your 24.0% rate — not tax advice; consult a CPA.
Schools (NCES district)
- District
- Oak Grove Elementary
- NCES district ID
- 0627810
- Math proficiency
- 47% ▲ 1.00%
- Reading proficiency
- 54% ▬ 0.00%
- Median HH income
- $92,404
- Composite
- 49.23/100
- National rank
- #4382
- State rank
- #339 of 1400 in CA
Livability — San Jose
- Score
- 78/100
- State rank
- #68
- US rank
- #2559
Category grades
Schools grade is shown separately in the Schools card above.
Census & demographics
- Census place
- San Jose, CA
- County
- Santa Clara County · 1,806,974 people
- City population
- 954,479
- Metro
- San Jose-Sunnyvale-Santa Clara, CA
- Population (ZIP)
- 57,202
- Household income
- $101,435
- Rent vs Own
- Severe rent burden
- 1808.0
Population outlook (Santa Clara County) Hauer SSP2
- Today (2025)
- 2,179,074 people
- By 2030
- 2,301,297 · +5.6%
- By 2040
- 2,528,195 · +16.0%
- By 2050
- 2,712,135 · +24.5%
- By 2075
- 2,998,701 · +37.6%
- By 2100
- 2,931,429 · +34.5%
Race, ethnicity, and origin ACS 2023
- Neighborhood character
- Diverse neighborhood (Simpson 0.60)
- Race & ethnicity
- Hispanic / Latino 51% Asian 36% Two or more races 22% White 7% Native American 2% Black 2%
- Hispanic origin (detail)
- Mexican 46%
- Foreign-born
- 45% · Canada, Vietnam, China
- Languages at home
- 27% English-only · Spanish 40% Vietnamese 24% Chinese 3%
Political lean MEDSL · Santa Clara
- 2024 margin
- Solid D (+40.0) · D 68.1% · R 28.1% · Other 3.8%
- 2008→2024 swing
- -0.9pp no change · 2008: 40.9pp · 2024: 40.0pp
- All cycles
- 2024: D+40.0 2020: D+47.4 2016: D+52.5 2012: D+42.1 2008: D+40.9
Not yet ingested
- Civics
- —
Market trends
- HPI YoY
- ▼ -1144.74%
- Current HPI
- 339.7949
- Rent YoY
- ▲ 1.00%
- Metro
- San Jose-Sunnyvale-Santa Clara, CA
- State GDP YoY
- ▲ 3.21%
- F500 in state
- 116
Industry mix (Fortune 500 HQ in CA)
| Industry | F500 HQs | Revenue |
|---|---|---|
| Technology | 27 | $1,492B |
|
||
| Financial Services | 3 | $174B |
|
||
| Retail | 3 | $44B |
|
||
| Insurance | 3 | $26B |
|
||
| Media / Entertainment | 2 | $115B |
|
||
| Pharmaceuticals / Biotech | 2 | $62B |
|
||
Price history
+224.0% since first listed19 events — show timeline
- 2026-03-30 Pending — bridgeMLS, Bay East AOR, or Contra Costa AOR
- 2026-03-30 Contingent — MLSListings
- 2026-03-12 Listed $405,000 MLSListings
- 2026-03-12 Listed $405,000 bridgeMLS, Bay East AOR, or Contra Costa AOR
- 2026-02-13 Listing Removed — bridgeMLS, Bay East AOR, or Contra Costa AOR
- 2025-12-04 Price Changed — bridgeMLS, Bay East AOR, or Contra Costa AOR
- 2025-11-05 Listed — bridgeMLS, Bay East AOR, or Contra Costa AOR
- 2025-10-25 Listing Removed — bridgeMLS, Bay East AOR, or Contra Costa AOR
- 2025-09-02 Price Changed — bridgeMLS, Bay East AOR, or Contra Costa AOR
- 2025-07-25 Listed — bridgeMLS, Bay East AOR, or Contra Costa AOR
- 2021-07-16 Sold (MLS) $305,000 MLSListings
- 2021-05-20 Pending — MLSListings
- 2021-05-17 Listed $299,999 MLSListings
- 2013-04-26 Sold (MLS) $96,000 MLSListings
- 2013-03-04 Listing Removed — MLSListings
- 2013-03-04 Listed $97,900 MLSListings
- 2005-12-01 Listing Removed — MLSListings
- 2005-11-10 Sold (MLS) $115,000 MLSListings
- 2005-10-18 Listed $125,000 MLSListings
Property tax history
-9.9%/yrLatest (2011): $732 · -11.3% YoY. Source: county tax records.
Cash-flow waterfall
monthlySold comps — $/sqft
last 12 mo · ≤1 miLoading sold comps…