 Triplex
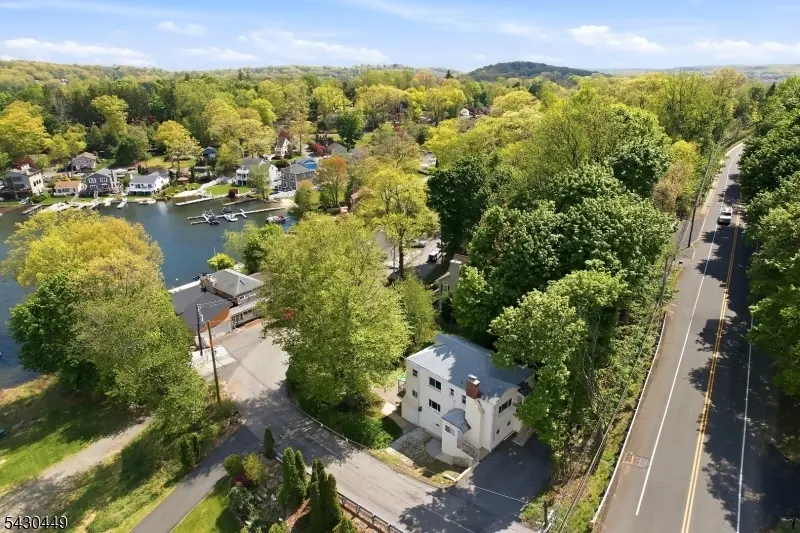
119 Lakeside Blvd · Hopatcong, NJ
Flood risk 1/10 · Minimal
- FEMA flood zone
- X (unshaded)
- Chance of flooding over 30 yrs
- 0.0%
- Est. flood insurance / yr
- $507 – $1,088
Fire risk 2/10 · Minimal
- Est. fire insurance / yr
- $526 – $976
Heat risk 4/10 · Minor
- Hot days now (above 94°F)
- 7 days/yr
- Hot days in 30 yrs
- 16 days/yr
Wind risk 4/10 · Minor
- Chance of severe wind over 30 yrs
- 24.0%
Air-quality risk 3/10 · Minor
- Unhealthy air days now
- 2 days/yr
- Unhealthy air days in 30 yrs
- 3 days/yr
Risk factors via First Street. Map © Google.
Why this score? — see what drove the C- grade
The composite is a weighted blend of 9 inputs, each scored 0–100. Each bar is that input's sub-score; the figure is the points it added to the 100-point composite (weight × sub-score).
- Cash flow +27.0/30.0
- DSCR +9.3/10.0
- 1% rule +7.3/10.0
- Livability +3.6/5.0
- Schools +2.9/10.0
- Rent growth +2.5/5.0
- Condition / age +2.2/5.0
- ARV discount +0.0/15.0
- Appreciation +0.0/10.0
$655,000
🖨 Deal sheet 📄 Offer letter ✓ Due diligence
Multi-family units
County records classify this as Multi-Family (2-4 Unit). Listing-text estimate: 3 units. confirmed
Listing remarks
Rare lakeside opportunity! This beautiful 3-family home features stunning lake views and sits right in a premier lake community. Ideal for investors or first-time buyers. Delivered fully vacant and ready to go. Must see!
Key facts
- 0.32 acre lot
- 4 parking spots
- Built 1949
Property features AI
Finance
- Financial info: Property is a 3-unit investment (triplex); Net operating income, gross operating income, and operating expenses listed as 0
Exterior
- Parking: 4 parking spaces; Driveway widths vary: 1-car width and 2-car width sections
- Utilities: Natural gas available; Public sewer; Well water
- Home design: Triplex
- Construction: Roof: asphalt shingle
- Exterior features: Siding: see remarks; Asphalt shingle roof; No easements
Interior
- Kitchen: Each unit includes an electric range/oven and refrigerator
- Bedrooms: Unit 1: 2 bedrooms; Unit 2: 3 bedrooms; Unit 3: 2 bedrooms
- Bathrooms: 4 full bathrooms total; Unit 1: 1 bathroom; Unit 2: 2 bathrooms; Unit 3: 1 bathroom
- Heating & cooling: Hot water baseboard heating; Window air conditioning units
- Interior features: 16 total rooms; See remarks for individual unit room descriptions
- Laundry & utility: Owner pays water for all units
Neighborhood map
What this means for you Summary
Snapshot
- This is a 3 × 2-bed/1.3-bath units multifamily listed at $655k. Condition is rated fair.
Deal economics
- At list price, monthly cash flow is $2k ($22k/yr) — positive. Per door: $609/mo.
- The deal already cash-flows at list — no discount required.
- Meets the 1% rule at list price ($8k rent vs $655k).
- Recommended offer: $645k (1.5% below list) — sets the bar for market timing.
- Cap rate 9.6% vs local median 0.7% in Hopatcong — top-decile yield for the area; either an underpriced asset or a hidden risk that comps aren't pricing in. Stress-test before assuming the spread holds.
Location & tenants
- Location reads 71/100 on livability (#249 in NJ) — a middle-class / working-renter tenant base. Strengths: crime A+, employment A+, housing A+; Watch: amenities F, commute F, cost of living F.
- Hopatcong Borough School District (suburban): math 17% / reading 42% proficiency, ranked #322 of 472 in NJ (top 68%) — low school quality limits family demand, transient renter base, plan for 1-2y turnover; only 17% free/reduced lunch — higher-income household profile.
- Zoned schools: Hopatcong High School (math 19% / reading 48%, grade F, #251 of 399 statewide, top 64%, 520 students, 25% FRL).
- Market conditions: 8 active listings in the ZIP; 184 units permitted in Sussex County in 2024 (18 in 5+ unit buildings).
Forward outlook
- Local home prices are declining (-3.0%/yr); year-one equity from $5k of loan paydown is wiped out by about $20k of value loss. Plan a longer hold.
- Sussex County population projected at -25% by 2050 — secular population decline; favor cash flow + early exit over multi-decade hold.
- At projected returns (-3.0% appreciation + 3.0% rent growth), your $183k cash investment doubles in ~10 years — after that, you're playing with house money.
Negotiation context
- It's been on market 18 days — a 2% lower offer ($645k) is reasonable based on typical stale-listing flexibility.
Risks & watch-outs
- Watch-outs: built in 1949 — expect roof / HVAC / electrical / plumbing capex.
Questions for the listing agent
- Can we see the unit-by-unit rent roll, current vacancy, and any below-market leases? What's the average tenancy length?
- What capital expenditures (roof, boiler, parking lot, exteriors) have been made in the last 5 years, and what's planned in the next 2?
- Have any recent inspections been done? Can we get a copy of the seller's disclosures and any deferred-maintenance estimates?
- Built in 1949 — when were the roof, HVAC, electrical panel, plumbing, and water heater last replaced?
- Is there a deadline driving the sale (1031 exchange, divorce, estate, relocation)? That informs how much negotiation room exists.
- Schools are D-rated, which usually means shorter tenancies and higher turnover. Who's the typical renter profile here, and what's been the actual vacancy rate?
- What's the average days-on-market for RENTAL listings here right now (not sales)? A rising rental-DOM trend means longer vacancies and softer asking-rent achievability than the comps imply.
- What's the recent tenant-quality profile in this submarket — average credit score on applications, eviction rate, late-payment / NSF rate, and stable-employment percentage? A property-management company in the area should have these aggregated.
- How much new apartment / multifamily construction is in the pipeline within 1–3 miles? Heavy new supply (>2% of stock underway) typically softens rents 12–24 months out; light construction supports rent growth.
Investment metrics
- 1% rule
- 1.23% ✓
- Cap rate
- 9.64%
- Cash-on-cash
- 11.95%
- DSCR
- 1.53
- GRM
- 6.8
CMA / ARV
- ARV (median comp)
- $493,386
- List price
- $655,000
- Delta
- 32.76%
- Verdict
- OVERPRICED
- Comps
- 1 within 2.0 mi
Projected returns pro-forma
-3.0% appreciation · 3.0% rent growth · sell at horizon
- IRR
- 1.5%
- Equity multiple
- 1.06×
- Total profit
- $10,271
- Equity at exit
- $97,663
- IRR
- 11.1%
- Equity multiple
- 1.87×
- Total profit
- $159,177
- Equity at exit
- $56,632
Cash invested: $183,400 (down + closing). Projections, not guarantees.
Landlord ↔ Tenant lean methodology
- Overall (STATE)
- 21 Tenant-Leaning
- State New Jersey
- 21 Tenant-Leaning · D+6
- County
- — inherits STATE
- City
- — inherits STATE
ZIP-level market 07843
- Active inventory
- 8
- Price-to-rent
- 20.4×
Monthly cashflow live
- Estimated rent
- $8,041 high interval (Pro) →
- Mortgage (P&I)
- −$3,435
- Tax est. 1.5%
- −$819 /mo · $9,825/yr
- Insurance
- −$273
- HOA
- −$0
- Vacancy / Maint / Mgmt
- −$1,689
- Net cashflow
- $1,826
Break-even live
3-unit breakdown (identical units grouped — click to expand)
| Units | Beds | Baths | Est. rent |
|---|---|---|---|
| 3× units | 2 | 1.3 | $8,040 |
| #1 | 2 | 1.3 | $2,680 |
| #2 | 2 | 1.3 | $2,680 |
| #3 | 2 | 1.3 | $2,680 |
| Total (3 units) | $8,041 | ||
UW: 25.0% down · 7.5% · 30yr · 1.5% tax · 5.0% vac · 8.0% maint · 8.0% mgmt
Financing live
Cash to close
- Down payment
- $163,750
- Closing costs
- $19,650
- Reserves months
- —
- Total cash needed
- —
Loan-product check · same deal, 3 products live
Conventional
25% down · 7.5% · 30yr
- Down + closing
- —
- Monthly P&I
- —
- Monthly cashflow
- —
- DSCR
- —
- Eligible?
- —
Personal DTI + credit; lowest rate.
DSCR
20% down · 8.5% · 30yr
- Down + closing
- —
- Monthly P&I
- —
- Monthly cashflow
- —
- DSCR
- —
- Eligible?
- —
No personal income docs; deal must DSCR.
Hard money
10% down · 12.0% · 12mo
- Down + closing
- —
- Monthly P&I
- —
- Monthly cashflow
- —
- DSCR
- —
- Eligible?
- —
Short-term bridge; refi at stabilization.
Listing history 2 events
-
2026-05-09$655,000 Active 220-char remark
-
2026-05-08historical $655,000 220-char remark
ⓘ Source: listings_history table (triggers on properties + properties_extension) + one-shot
backfill from property_details.listing_events for pre-trigger history.
Climate risk First Street
- Flood 1/10 Low FEMA zone X (unshaded) · 0% chance over 30 yrs
- Wildfire 2/10 Low
- Heat 4/10 Moderate 7 d/yr ≥94°F today · 16 d/yr by 30 yrs out
- Wind 4/10 Moderate 24% chance of damaging wind over 30 yrs
- Air quality 3/10 Moderate 2 unhealthy d/yr today · 3 by 30 yrs out
Nearby sold comps map
Loading sold comps map…
Walkable amenities ~0.75 mi
Loading nearby amenities…
Taxation est. · year 1
- Rental income
- $96,492
- − Mortgage interest
- −$36,690
- − Property taxes
- −$9,825
- − Insurance
- −$3,275
- − Repairs & maintenance
- −$7,719
- − Management
- −$7,719
- − Depreciation
- −$19,055
- Taxable income
- $12,209
- Est. tax owed @ 24.0%
- −$2,930
- After-tax cash flow
- $18,980/yr
For passive investors: Depreciation is non-cash, so a rental often shows a tax loss while cash-flowing — sheltering income. Rental losses are passive: they offset passive income freely, and up to $25,000/yr can offset ordinary (W-2) income if you actively participate and your MAGI is under $100k (phasing out to $0 by $150k); unused losses carry forward. On sale, claimed depreciation is recaptured at up to 25%, and gains may owe capital-gains tax (a 1031 exchange can defer both). Figures are a year-1 estimate at your 24.0% rate — not tax advice; consult a CPA.
Condition & rehab AI · 13 photos
This 3-family home is in fair condition with some updates needed to improve its resale and rental value. The property is located in a desirable lakeside community and is delivered fully vacant and ready to go.
Repairs flagged
- Minor Kitchen cabinets — Dated cabinetry needs updating or replacement.
- Minor Bathroom fixtures — Dated fixtures need updating or replacement.
- Minor Landscaping — Overgrown areas need trimming and maintenance.
Value-add opportunities
- Resale Updating kitchen cabinets and appliances — Modernizing the kitchen will attract more buyers.
- Resale Updating bathroom fixtures — Modernizing bathrooms will attract more buyers.
- Both Landscaping and curb appeal improvements — Enhancing the exterior will increase both resale and rental value.
Renovation cost estimate screening
| Repair item | Severity | Est. cost |
|---|---|---|
| Kitchen cabinets · Dated cabinetry needs updating or replacement. | Minor | $500–3,000 |
| Bathroom fixtures · Dated fixtures need updating or replacement. | Minor | $500–3,000 |
| Landscaping · Overgrown areas need trimming and maintenance. | Minor | $500–3,000 |
| Total estimated repair cost · 3 items | $1,500–9,000 |
Value-add ROI direction
- Resale Updating kitchen cabinets and appliances — Modernizing the kitchen will attract more buyers. ↑
- Resale Updating bathroom fixtures — Modernizing bathrooms will attract more buyers. ↑
- Both Landscaping and curb appeal improvements — Enhancing the exterior will increase both resale and rental value. ↑
ⓘ Cost ranges are severity-bucket heuristics (US national rule-of-thumb). Get contractor quotes + a written scope before underwriting a rehab budget.
Schools (NCES district)
- District
- Hopatcong Borough School District
- NCES district ID
- 3407440
- Math proficiency
- 17% ▼ -14.00%
- Reading proficiency
- 42% ▬ 0.00%
- Median HH income
- $81,724
- Composite
- 28.72/100
- National rank
- #6681
- State rank
- #322 of 472 in NJ
Livability — Hopatcong
- Score
- 71/100
- State rank
- #249
- US rank
- #6962
Category grades
Schools grade is shown separately in the Schools card above.
Census & demographics
- Census place
- Hopatcong, NJ
- City population
- 11,309
- Population (ZIP)
- 11,309
Population outlook (Sussex County) Hauer SSP2
- Today (2025)
- 133,413 people
- By 2030
- 127,324 · -4.6%
- By 2040
- 113,987 · -14.6%
- By 2050
- 100,391 · -24.8%
- By 2075
- 78,063 · -41.5%
- By 2100
- 62,346 · -53.3%
Race, ethnicity, and origin ACS 2023
- Neighborhood character
- Predominantly White (69%)
- Race & ethnicity
- White 69% Hispanic / Latino 21% Two or more races 11% Asian 4% Black 3%
- Hispanic origin (detail)
- Mexican 1% Puerto Rican 8% Cuban 1% Dominican 1%
- Common ancestry
- Romanian 11% Subsaharan African 3% Russian 2%
- Foreign-born
- 15% · Canada, Jamaica, China
- Languages at home
- 79% English-only · Spanish 13% Other Indo-European 3% Russian/Polish/Slavic 3%
Political lean MEDSL · Sussex
- 2024 margin
- Strong R (+24.9) · D 36.6% · R 61.6% · Other 1.8%
- 2008→2024 swing
- -4.2pp toward R · 2008: -20.7pp · 2024: -24.9pp
- All cycles
- 2024: R+24.9 2020: R+19.5 2016: R+30.3 2012: R+22.4 2008: R+20.7
Not yet ingested
- Civics
- —
Market trends
- HPI YoY
- ▼ -375.34%
- Current HPI
- 346.6479
- Rent YoY
- —
- Metro
- —
- State GDP YoY
- ▲ 2.05%
- F500 in state
- 34
Industry mix (Fortune 500 HQ in NJ)
| Industry | F500 HQs | Revenue |
|---|---|---|
| Consumer Goods | 3 | $31B |
|
||
| Pharmaceuticals | 2 | $153B |
|
||
| Technology | 2 | $21B |
|
||
| Insurance | 2 | $20B |
|
||
| Healthcare | 2 | $19B |
|
||
| Financial Services | 1 | $70B |
|
||
Price history
+0.0% since first listed3 events — show timeline
- 2026-05-27 Pending — GSMLS
- 2026-05-09 Listed $655,000 GSMLS
- 2026-05-08 Coming Soon $655,000 GSMLS
Cash-flow waterfall
monthlySold comps — $/sqft
last 12 mo · ≤1 miLoading sold comps…