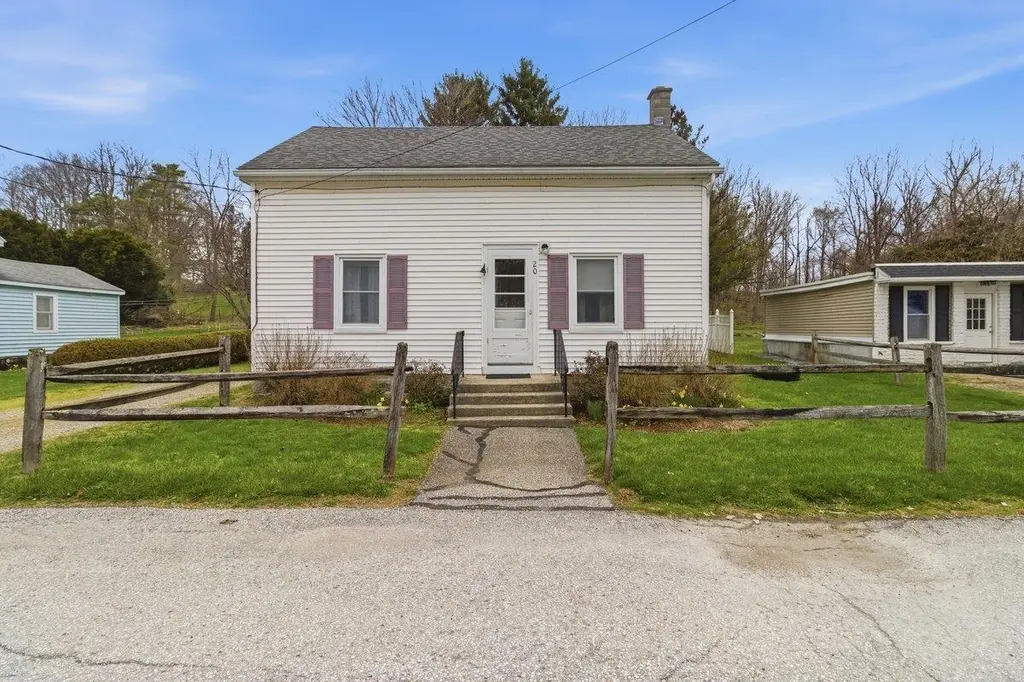
20 Sage St · North Bennington, VT
Flood risk 1/10 · Minimal
- FEMA flood zone
- X (unshaded)
- Chance of flooding over 30 yrs
- 0.0%
- Est. flood insurance / yr
- $507 – $1,088
Fire risk 2/10 · Minimal
- Est. fire insurance / yr
- $480 – $892
Heat risk 3/10 · Minor
- Hot days now (above 93°F)
- 7 days/yr
- Hot days in 30 yrs
- 16 days/yr
Wind risk 3/10 · Minor
- Chance of severe wind over 30 yrs
- 6.0%
Air-quality risk 2/10 · Minimal
- Unhealthy air days now
- 0 days/yr
- Unhealthy air days in 30 yrs
- 1 days/yr
Risk factors via First Street. Map © Google.
Why this score? — see what drove the D grade
The composite is a weighted blend of 9 inputs, each scored 0–100. Each bar is that input's sub-score; the figure is the points it added to the 100-point composite (weight × sub-score).
- Cash flow +10.7/30.0
- Appreciation +6.3/10.0
- Schools +5.0/10.0
- ARV discount +4.5/15.0
- Livability +3.2/5.0
- DSCR +3.1/10.0
- Rent growth +2.5/5.0
- Condition / age +2.5/5.0
- 1% rule +2.3/10.0
$209,000
🖨 Deal sheet 📄 Offer letter ✓ Due diligence
Listing remarks
Charming home in the heart of the Village of North Bennington, set on a beautiful village lot and offering solid bones with great potential. This well-maintained property features 4 bedrooms and a 3/4 bath, along with a first-floor bonus room. Wood floors lie beneath the carpet, ready to be revealed. Laundry hookups are in place for added convenience. Some updates are needed, providing an excellent opportunity to add your own finishing touches and build equity in a highly desirable location. Enjoy true village living with walkable access to cafés, restaurants, and trails, plus close proximity to Lake Paran and the Park-McCullough House. School choice at the elementary level adds flex
Key facts
- Wood floors
- Walkable access
- Laundry hookups
Tags
Property features AI
Exterior
- Parking: Gravel driveway
- Utilities: Public water; Public sewer; Circuit breaker electric service (Green Mountain Power); Fuel oil service available (Greene's Oil); High-speed internet available; Cable available
- Home design: Cape-style home; White exterior
- Construction: Built in 1820; Vinyl siding; Asphalt shingle roof
- Exterior features: In-town, neighborhood setting; Gravel driveway; Public road frontage (approximately 65' of frontage)
Interior
- Kitchen: Kitchen with refrigerator and electric stove
- Bedrooms: Four bedrooms (three on second level, one on first level)
- Flooring: Carpet; Vinyl; Wood
- Bathrooms: One 3/4 bathroom
- Heating & cooling: Baseboard heating
- Interior features: Eight total rooms; Bonus room; Interior access to the basement; Unfinished dirt-floored basement
Neighborhood map
What this means for you Summary
Snapshot
- This is a 4-bed/1.0-bath single-family listed at $209k.
Deal economics
- At list price, monthly cash flow is $-101 ($-1k/yr) — negative.
- To cash-flow at today's rent, offer at most $191k (8.5% below list).
- To meet the 1% rule (rent ≥ 1% of price), the offer needs to be $152k (27.4% below list).
- Recommended offer: $152k (27.4% below list) — sets the bar for 1% rule.
Location & tenants
- Location reads 64/100 on livability (#65 in VT) — a middle-class / working-renter tenant base. Strengths: crime A+, housing A+; Watch: employment C-, health & safety D, schools D-.
- Market conditions: 10 active listings in the ZIP; 59 units permitted in Bennington County in 2024 (0 in 5+ unit buildings).
Forward outlook
- In year one you build about $7k of equity ($1k loan paydown + $6k appreciation (2.6% local appreciation)).
- Bennington County population projected at -23% by 2050 — secular population decline; favor cash flow + early exit over multi-decade hold.
- By year 5, paydown + projected appreciation supports a ~$30k cash-out refi (75% LTV) — recoverable capital for the next deal without selling this one.
Negotiation context
- It's been on market 66 days — a 6% lower offer ($196k) is reasonable based on typical stale-listing flexibility.
- 2 sale attempts with the ask held roughly flat each time — persistent listings suggest the price (not the market) is what's stuck; bring a comps-based counter.
Risks & watch-outs
- Watch-outs: built in 1820 — expect roof / HVAC / electrical / plumbing capex.
Questions for the listing agent
- What do current leases actually rent for vs. the listed asking? Can we see a recent rent roll and the last 12 months of T-12 income?
- It's been on market 66 days. Have you received any prior offers? Is the seller open to a 27% concession, seller financing, or rate buy-down credit?
- Built in 1820 — when were the roof, HVAC, electrical panel, plumbing, and water heater last replaced?
- Why hasn't it sold? Are there any deal-killer items the seller is aware of (foundation, flood, title, zoning, code violations)?
- Is there a deadline driving the sale (1031 exchange, divorce, estate, relocation)? That informs how much negotiation room exists.
- Schools are D-rated, which usually means shorter tenancies and higher turnover. Who's the typical renter profile here, and what's been the actual vacancy rate?
- The area grade is low — what's the realistic commute time and amenity access for the typical tenant pool here? Any planned neighborhood developments (good or bad) we should know about?
- What's the average days-on-market for RENTAL listings here right now (not sales)? A rising rental-DOM trend means longer vacancies and softer asking-rent achievability than the comps imply.
- What's the recent tenant-quality profile in this submarket — average credit score on applications, eviction rate, late-payment / NSF rate, and stable-employment percentage? A property-management company in the area should have these aggregated.
- How much new for-sale + rental construction is in the pipeline within 1–3 miles? Heavy new supply typically softens prices + rents 12–24 months out; constrained supply supports both.
Investment metrics
- 1% rule
- 0.73% ✗
- Cap rate
- 5.71%
- Cash-on-cash
- -2.07%
- DSCR
- 0.91
- GRM
- 11.5
CMA / ARV
- ARV (on-the-fly)
- $196,098
- Comps found
- 3
Show comp detail 3 sales within ~0.75 mi
| Address | Dist | Beds/Ba | Sqft | Sold | Price | $/sf | Match |
|---|---|---|---|---|---|---|---|
| 3 Church St | 0.25mi | 3/1.5 (-1) | 1,238 (+10%) | 18mo | $215,000 | $174 | 50 |
| 181 Dunham Ave | 0.57mi | 3/2.0 (-1) | 1,120 (-1%) | 22mo | $380,000 | $339 | 45 |
| 76 Harvest Hills Dr | 0.62mi | 3/1.0 (-1) | 1,290 (+14%) | 7mo | $130,000 | $101 | 36 |
Match score weights: distance 35% · size 25% · config 20% · recency 20%. Top-matched comps best support the ARV.
Projected returns pro-forma
2.64% appreciation · 3.0% rent growth · sell at horizon
- IRR
- 4.5%
- Equity multiple
- 1.25×
- Total profit
- $14,738
- Equity at exit
- $89,792
- IRR
- 7.8%
- Equity multiple
- 2.13×
- Total profit
- $66,395
- Equity at exit
- $135,211
Cash invested: $58,520 (down + closing). Projections, not guarantees.
Landlord ↔ Tenant lean methodology
- Overall (STATE)
- 41 Moderately Tenant-Leaning
- State Vermont
- 41 Moderately Tenant-Leaning · D+15
- County
- — inherits STATE
- City
- — inherits STATE
ZIP-level market 05257
- Home prices YoY
- 1.1%
- Active inventory
- 10
- Price-to-rent
- 11.5×
Monthly cashflow live
- Estimated rent
- $1,518 medium interval (Pro) →
- Mortgage (P&I)
- −$1,096
- Tax from tax record
- −$117 /mo · $1,403/yr
- Insurance
- −$87
- HOA
- −$0
- Vacancy / Maint / Mgmt
- −$319
- Net cashflow
- $-101
Break-even live
UW: 25.0% down · 7.5% · 30yr · 1.5% tax · 5.0% vac · 8.0% maint · 8.0% mgmt
Financing live
Cash to close
- Down payment
- $52,250
- Closing costs
- $6,270
- Reserves months
- —
- Total cash needed
- —
Loan-product check · same deal, 3 products live
Conventional
25% down · 7.5% · 30yr
- Down + closing
- —
- Monthly P&I
- —
- Monthly cashflow
- —
- DSCR
- —
- Eligible?
- —
Personal DTI + credit; lowest rate.
DSCR
20% down · 8.5% · 30yr
- Down + closing
- —
- Monthly P&I
- —
- Monthly cashflow
- —
- DSCR
- —
- Eligible?
- —
No personal income docs; deal must DSCR.
Hard money
10% down · 12.0% · 12mo
- Down + closing
- —
- Monthly P&I
- —
- Monthly cashflow
- —
- DSCR
- —
- Eligible?
- —
Short-term bridge; refi at stabilization.
Listing history 19 events
-
2026-06-19days on market $209,000 Active 66 DOM
-
2026-06-18days on market $209,000 Active 65 DOM
-
2026-06-17days on market $209,000 Active 64 DOM
-
2026-06-16days on market $209,000 Active 63 DOM
-
2026-06-15days on market $209,000 Active 62 DOM
-
2026-06-14days on market $209,000 Active 60 DOM
-
2026-06-12days on market $209,000 Active 59 DOM
-
2026-06-09days on market $209,000 Active 56 DOM
-
2026-06-08days on market $209,000 Active 55 DOM
-
2026-06-07days on market $209,000 Active 54 DOM
-
2026-06-07days on market $209,000 Active 53 DOM
-
2026-06-04days on market $209,000 Active 50 DOM
-
2026-06-02days on market $209,000 Active 49 DOM
-
2026-06-01days on market $209,000 Active 48 DOM
-
2026-05-31days on market $209,000 Active 47 DOM
-
2026-05-31days on market $209,000 Active 46 DOM
-
2026-04-30status Active
-
2026-04-28historical Active with Contract
-
2026-04-14$219,000 Active
ⓘ Source: listings_history table (triggers on properties + properties_extension) + one-shot
backfill from property_details.listing_events for pre-trigger history.
Tax reassessment forecast VT · Partial reset (capped growth)
- Current annual tax
- $1,403 · $117/mo
- Projected year-2 tax
- $2,687 · $224/mo
- Expected delta
- +$1,284/yr (+$107/mo · 91.5%)
ⓘ Screening estimate from a state-policy table — verify with the county assessor before closing.
Climate risk First Street
- Flood 1/10 Low FEMA zone X (unshaded) · 0% chance over 30 yrs
- Wildfire 2/10 Low
- Heat 3/10 Moderate 7 d/yr ≥93°F today · 16 d/yr by 30 yrs out
- Wind 3/10 Moderate 6% chance of damaging wind over 30 yrs
- Air quality 2/10 Low 0 unhealthy d/yr today · 1 by 30 yrs out
Nearby sold comps map
Loading sold comps map…
Walkable amenities ~0.75 mi
Loading nearby amenities…
Taxation est. · year 1
- Rental income
- $18,212
- − Mortgage interest
- −$11,707
- − Property taxes
- −$1,403
- − Insurance
- −$1,045
- − Repairs & maintenance
- −$1,457
- − Management
- −$1,457
- − Depreciation
- −$6,080
- Taxable loss
- −$4,938
- Est. tax savings @ 24.0%
- +$1,185
- After-tax cash flow
- $-28/yr
For passive investors: Depreciation is non-cash, so a rental often shows a tax loss while cash-flowing — sheltering income. Rental losses are passive: they offset passive income freely, and up to $25,000/yr can offset ordinary (W-2) income if you actively participate and your MAGI is under $100k (phasing out to $0 by $150k); unused losses carry forward. On sale, claimed depreciation is recaptured at up to 25%, and gains may owe capital-gains tax (a 1031 exchange can defer both). Figures are a year-1 estimate at your 24.0% rate — not tax advice; consult a CPA.
Schools (NCES district)
No district data.
Livability — North Bennington
- Score
- 64/100
- State rank
- #65
- US rank
- #14834
Category grades
Schools grade is shown separately in the Schools card above.
Census & demographics
- Census place
- North Bennington, VT
- Population (ZIP)
- 2,891
Population outlook (Bennington County) Hauer SSP2
- Today (2025)
- 34,407 people
- By 2030
- 32,975 · -4.2%
- By 2040
- 29,711 · -13.6%
- By 2050
- 26,638 · -22.6%
- By 2075
- 21,318 · -38.0%
- By 2100
- 16,086 · -53.2%
Race, ethnicity, and origin ACS 2023
- Neighborhood character
- Predominantly White (85%)
- Race & ethnicity
- White 85% Two or more races 7% Hispanic / Latino 4% Asian 2% Black 1% Native American 1%
- Common ancestry
- Lithuanian 6% Romanian 4% Slovak 3%
- Foreign-born
- 4% · China, Canada
- Languages at home
- 95% English-only · French/Haitian/Cajun 1% Other Asian/Pacific 1% Chinese 1%
Political lean MEDSL · Bennington
- 2024 margin
- Strong D (+22.5) · D 60.0% · R 37.5% · Other 2.6%
- 2008→2024 swing
- -10.9pp toward R · 2008: 33.4pp · 2024: 22.5pp
- All cycles
- 2024: D+22.5 2020: D+27.3 2016: D+22.1 2012: D+33.3 2008: D+33.4
Not yet ingested
- Civics
- —
Market trends
- HPI YoY
- ▲ 2.64%
- Current HPI
- 241.384
- Rent YoY
- —
- Metro
- —
- State GDP YoY
- —
- F500 in state
- 0
Price history
3 events — show timeline
- 2026-04-30 Relisted — PrimeMLS
- 2026-04-28 Contingent — PrimeMLS
- 2026-04-14 Listed $219,000 PrimeMLS
Property tax history
+10.4%/yrLatest (2024): $1,403 · +5.4% YoY. Source: county tax records.
Cash-flow waterfall
monthlySold comps — $/sqft
last 12 mo · ≤1 miLoading sold comps…