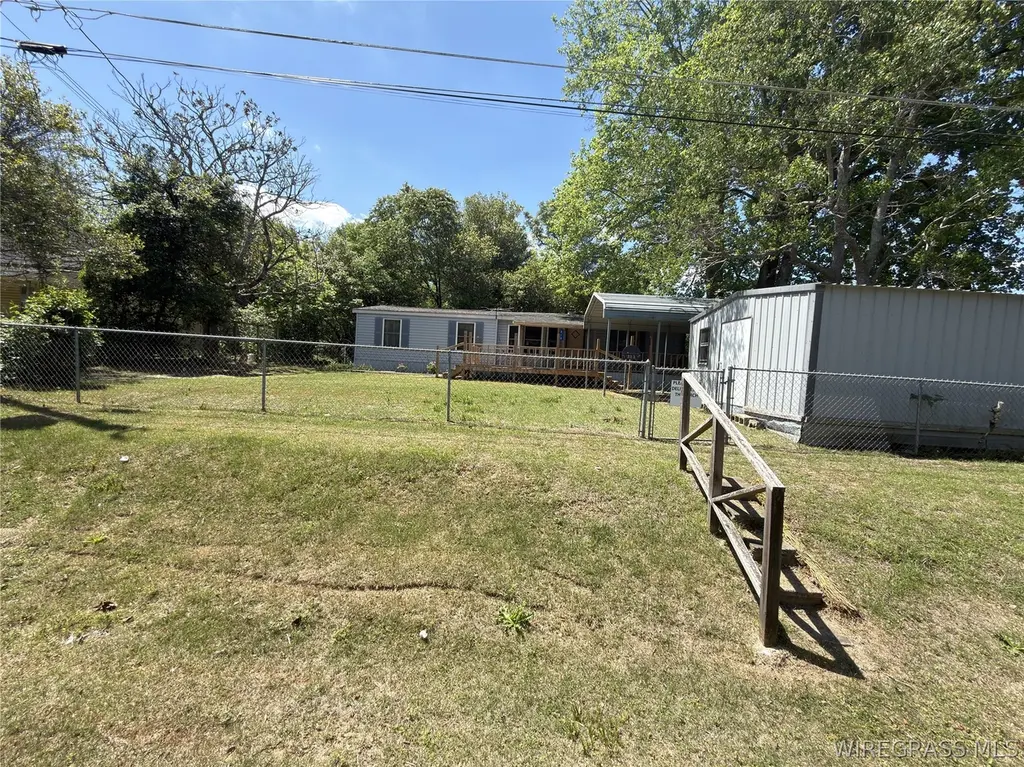
313 Fitzsimmons St · New Brockton, AL
Flood risk 1/10 · Minimal
- FEMA flood zone
- X (unshaded)
- Chance of flooding over 30 yrs
- 0.0%
- Est. flood insurance / yr
- $507 – $1,088
Fire risk 3/10 · Minor
- Est. fire insurance / yr
- $916 – $1,700
Heat risk 8/10 · Major
- Hot days now (above 106°F)
- 7 days/yr
- Hot days in 30 yrs
- 19 days/yr
Wind risk 8/10 · Major
- Chance of severe wind over 30 yrs
- 99.0%
Air-quality risk 1/10 · Minimal
- Unhealthy air days now
- 0 days/yr
- Unhealthy air days in 30 yrs
- 0 days/yr
Risk factors via First Street. Map © Google.
Why this score? — see what drove the B+ grade
The composite is a weighted blend of 9 inputs, each scored 0–100. Each bar is that input's sub-score; the figure is the points it added to the 100-point composite (weight × sub-score).
- Cash flow +30.0/30.0
- ARV discount +15.0/15.0
- 1% rule +10.0/10.0
- DSCR +10.0/10.0
- Schools +3.3/10.0
- Livability +3.3/5.0
- Rent growth +2.5/5.0
- Condition / age +2.5/5.0
- Appreciation +0.0/10.0
$59,000
🖨 Deal sheet 📄 Offer letter ✓ Due diligence
Listing remarks MLS
Strategically located in the growing New Brockton area, this property offers both convenience and opportunity. Just 4 minutes from the Ben E. Keith Foods Southeast Distribution Center, 12 minutes to Enterprise, and only 26 minutes to Fort Rucker, the location makes daily commuting simple and efficient. This home is a wonderful find for a first-time homebuyer looking to step into homeownership or an investor seeking a solid addition to their portfolio. With its desirable proximity to major employers and surrounding communities, the property presents strong potential for both personal use and rental income. Whether you’re looking to settle in or invest in a property with promising location advantages, this one is worth a look! Property is sold as is where is. Buyer and Buyer’s Agent to satisfy self to all pertinent information.
Key facts
- 6,970 sq ft lot
- Parking
- Built 1980
Neighborhood map
What this means for you Summary
Snapshot
- This is a 3-bed/2.0-bath single-family listed at $59k.
Deal economics
- At list price, monthly cash flow is $304 ($4k/yr) — positive.
- The deal already cash-flows at list — no discount required.
- Meets the 1% rule at list price ($901 rent vs $59k).
- Recommended offer: $57k (3.0% below list) — sets the bar for market timing.
- Cap rate 12.5% vs local median 2.5% in New Brockton — top-decile yield for the area; either an underpriced asset or a hidden risk that comps aren't pricing in. Stress-test before assuming the spread holds.
Location & tenants
- Location reads 66/100 on livability (#100 in AL) — a middle-class / working-renter tenant base. Strengths: cost of living A+, housing A+, crime A-; Watch: health & safety D, schools F, amenities F.
- Coffee County (rural): math 27% / reading 50% proficiency, ranked #30 of 129 in AL (top 23%) — families likely to look elsewhere, expect single-tenant / working-renter base with shorter leases.
- Market conditions: 34 active listings in the ZIP; 2 comparable units currently listed for rent nearby; 137 units permitted in Coffee County in 2024 (0 in 5+ unit buildings).
Forward outlook
- Local home prices are declining (-3.0%/yr); year-one equity from $408 of loan paydown is wiped out by about $2k of value loss. Plan a longer hold.
- At projected returns (-3.0% appreciation + 3.0% rent growth), your $17k cash investment doubles in ~6 years — after that, you're playing with house money.
Negotiation context
- It's been on market 55 days — a 3% lower offer ($57k) is reasonable based on typical stale-listing flexibility.
Risks & watch-outs
- Climate carrying-cost: severe wind risk, 99% chance of damaging wind over 30y; extreme-heat days projected 7→19/yr by 2055 (HVAC capex compounding) — expect insurance premiums to compound above CPI over the hold.
Questions for the listing agent
- It's been on market 55 days. Have you received any prior offers? Is the seller open to a 3% concession, seller financing, or rate buy-down credit?
- Is there a deadline driving the sale (1031 exchange, divorce, estate, relocation)? That informs how much negotiation room exists.
- Schools are F-rated, which usually means shorter tenancies and higher turnover. Who's the typical renter profile here, and what's been the actual vacancy rate?
- What's the average days-on-market for RENTAL listings here right now (not sales)? A rising rental-DOM trend means longer vacancies and softer asking-rent achievability than the comps imply.
- What's the recent tenant-quality profile in this submarket — average credit score on applications, eviction rate, late-payment / NSF rate, and stable-employment percentage? A property-management company in the area should have these aggregated.
- How much new for-sale + rental construction is in the pipeline within 1–3 miles? Heavy new supply typically softens prices + rents 12–24 months out; constrained supply supports both.
Investment metrics
- 1% rule
- 1.53% ✓
- Cap rate
- 12.48%
- Cash-on-cash
- 22.08%
- DSCR
- 1.98
- GRM
- 5.5
CMA / ARV
- ARV (median comp)
- $76,464
- List price
- $59,000
- Delta
- -22.84%
- Verdict
- UNDERPRICED
- Comps
- 1 within 2.0 mi
Show comp detail 5 sales within ~0.75 mi
| Address | Dist | Beds/Ba | Sqft | Sold | Price | $/sf | Match |
|---|---|---|---|---|---|---|---|
| 319 Fitzsimmons St | 0.03mi | 2/1.0 (-1) | 1,080 (+2%) | 1mo | $80,000 | $74 | 85 |
| 357 Corey St | 0.10mi | 3/1.0 | 1,152 (+9%) | 21mo | $25,000 | $22 | 59 |
| 112 Faulk St | 0.41mi | 3/1.0 | 1,050 (-1%) | 22mo | $107,000 | $102 | 58 |
| 404 N John St | 0.53mi | 2/2.0 (-1) | 1,187 (+12%) | 5mo | $150,000 | $126 | 46 |
| 343 S Mcgowan St | 0.45mi | 2/1.0 (-1) | 1,131 (+7%) | 16mo | $40,000 | $35 | 45 |
Match score weights: distance 35% · size 25% · config 20% · recency 20%. Top-matched comps best support the ARV.
Projected returns pro-forma
-3.0% appreciation · 3.0% rent growth · sell at horizon
- IRR
- 14.8%
- Equity multiple
- 1.59×
- Total profit
- $9,812
- Equity at exit
- $8,797
- IRR
- 23.5%
- Equity multiple
- 3.03×
- Total profit
- $33,528
- Equity at exit
- $5,101
Cash invested: $16,520 (down + closing). Projections, not guarantees.
Landlord ↔ Tenant lean methodology
- Overall (STATE)
- 90 Strongly Landlord-Friendly
- State Alabama
- 90 Strongly Landlord-Friendly · R+15
- County
- — inherits STATE
- City
- — inherits STATE
ZIP-level market 36351
- Home prices YoY
- -10.9%
- Active inventory
- 34
- Price-to-rent
- 5.5×
Monthly cashflow live
- Estimated rent
- $901 medium interval (Pro) →
- Mortgage (P&I)
- −$309
- Tax est. 1.5%
- −$74 /mo · $885/yr
- Insurance
- −$25
- HOA
- −$0
- Vacancy / Maint / Mgmt
- −$189
- Net cashflow
- $304
Break-even live
UW: 25.0% down · 7.5% · 30yr · 1.5% tax · 5.0% vac · 8.0% maint · 8.0% mgmt
Financing live
Cash to close
- Down payment
- $14,750
- Closing costs
- $1,770
- Reserves months
- —
- Total cash needed
- —
Loan-product check · same deal, 3 products live
Conventional
25% down · 7.5% · 30yr
- Down + closing
- —
- Monthly P&I
- —
- Monthly cashflow
- —
- DSCR
- —
- Eligible?
- —
Personal DTI + credit; lowest rate.
DSCR
20% down · 8.5% · 30yr
- Down + closing
- —
- Monthly P&I
- —
- Monthly cashflow
- —
- DSCR
- —
- Eligible?
- —
No personal income docs; deal must DSCR.
Hard money
10% down · 12.0% · 12mo
- Down + closing
- —
- Monthly P&I
- —
- Monthly cashflow
- —
- DSCR
- —
- Eligible?
- —
Short-term bridge; refi at stabilization.
Rent comps 2 comps
| Address | Beds | Baths | Sqft | Rent | $/sqft | DOM | Units | Dist |
|---|---|---|---|---|---|---|---|---|
| 103 N Watkins St New Brockton, AL | 2.0 | 1.0 | 844 | $890 | $1.05 | 43d | 1 | 0.09mi |
| 106 N Metcalf St New Brockton, AL | 2.0 | 1.0 | 928 | $950 | $1.02 | 43d | 1 | 0.50mi |
Listing history 13 events
-
2026-06-19days on market $59,000 Active 55 DOM
-
2026-06-18days on market $59,000 Active 54 DOM
-
2026-06-17days on market $59,000 Active 53 DOM
-
2026-06-16days on market $59,000 Active 52 DOM
-
2026-06-15days on market $59,000 Active 51 DOM
-
2026-06-14days on market $59,000 Active 49 DOM
-
2026-06-12statusdays on market $59,000 Active 48 DOM
-
2026-06-03status $59,000 Pending 46 DOM
-
2026-06-02days on market $59,000 Active 46 DOM
-
2026-06-01days on market $59,000 Active 45 DOM
-
2026-05-31days on market $59,000 Active 44 DOM
-
2026-05-30days on market $59,000 Active 43 DOM
-
2026-04-17$59,000 Active 850-char remark
Show marketing remark (850 chars)
Strategically located in the growing New Brockton area, this property offers both convenience and opportunity. Just 4 minutes from the Ben E. Keith Foods Southeast Distribution Center, 12 minutes to Enterprise, and only 26 minutes to Fort Rucker, the location makes daily commuting simple and efficient. This home is a wonderful find for a first-time homebuyer looking to step into homeownership or an investor seeking a solid addition to their portfolio. With its desirable proximity to major employers and surrounding communities, the property presents strong potential for both personal use and rental income. Whether you’re looking to settle in or invest in a property with promising location advantages, this one is worth a look! Property is sold as is where is. Buyer and Buyer’s Agent to satisfy self to all pertinent information.
ⓘ Source: listings_history table (triggers on properties + properties_extension) + one-shot
backfill from property_details.listing_events for pre-trigger history.
Climate risk First Street
- Flood 1/10 Low FEMA zone X (unshaded) · 0% chance over 30 yrs
- Wildfire 3/10 Moderate
- Heat 8/10 Severe 7 d/yr ≥106°F today · 19 d/yr by 30 yrs out
- Wind 8/10 Severe 99% chance of damaging wind over 30 yrs
- Air quality 1/10 Low 0 unhealthy d/yr today · 0 by 30 yrs out
Nearby sold comps map
Loading sold comps map…
Walkable amenities ~0.75 mi
Loading nearby amenities…
Taxation est. · year 1
- Rental income
- $10,811
- − Mortgage interest
- −$3,305
- − Property taxes
- −$885
- − Insurance
- −$295
- − Repairs & maintenance
- −$865
- − Management
- −$865
- − Depreciation
- −$1,716
- Taxable income
- $2,880
- Est. tax owed @ 24.0%
- −$691
- After-tax cash flow
- $2,956/yr
For passive investors: Depreciation is non-cash, so a rental often shows a tax loss while cash-flowing — sheltering income. Rental losses are passive: they offset passive income freely, and up to $25,000/yr can offset ordinary (W-2) income if you actively participate and your MAGI is under $100k (phasing out to $0 by $150k); unused losses carry forward. On sale, claimed depreciation is recaptured at up to 25%, and gains may owe capital-gains tax (a 1031 exchange can defer both). Figures are a year-1 estimate at your 24.0% rate — not tax advice; consult a CPA.
Schools (NCES district)
- District
- Coffee County
- NCES district ID
- 0100810
- Math proficiency
- 27% ▼ -21.00%
- Reading proficiency
- 50% ▲ 3.00%
- Median HH income
- $43,693
- Composite
- 32.56/100
- National rank
- #5682
- State rank
- #30 of 129 in AL
Livability — New Brockton
- Score
- 66/100
- State rank
- #100
- US rank
- #11430
Category grades
Schools grade is shown separately in the Schools card above.
Census & demographics
- Census place
- New Brockton, AL
- Population (ZIP)
- 3,926
Population outlook (Coffee County) Hauer SSP2
- Today (2025)
- 53,133 people
- By 2030
- 53,832 · +1.3%
- By 2040
- 54,504 · +2.6%
- By 2050
- 54,289 · +2.2%
- By 2075
- 51,175 · -3.7%
- By 2100
- 46,793 · -11.9%
Race, ethnicity, and origin ACS 2023
- Neighborhood character
- Predominantly White (77%)
- Race & ethnicity
- White 77% Black 9% Hispanic / Latino 8% Two or more races 7%
- Hispanic origin (detail)
- Mexican 6%
- Common ancestry
- Serbian 4% Slovak 3% Lithuanian 3%
- Foreign-born
- 3% · Canada, South Korea
- Languages at home
- 94% English-only · Spanish 5%
Political lean MEDSL · Coffee
- 2024 margin
- Solid R (+57.9) · D 20.7% · R 78.6%
- 2008→2024 swing
- -9.0pp toward R · 2008: -48.9pp · 2024: -57.9pp
- All cycles
- 2024: R+57.9 2020: R+53.1 2016: R+56.7 2012: R+49.4 2008: R+48.9
Not yet ingested
- Civics
- —
Market trends
- HPI YoY
- ▼ -20.17%
- Current HPI
- 164.0922
- Rent YoY
- —
- Metro
- —
- State GDP YoY
- ▲ 2.94%
- F500 in state
- 4
Industry mix (Fortune 500 HQ in AL)
| Industry | F500 HQs | Revenue |
|---|---|---|
| Financial Services | 1 | $8B |
|
||
| Healthcare | 1 | $5B |
|
||
Price history
1 event — show timeline
- 2026-04-17 Listed $59,000 WBR
Property tax history
+2.5%/yrLatest (2025): $66 · +2.1% YoY. Source: county tax records.
Cash-flow waterfall
monthlySold comps — $/sqft
last 12 mo · ≤1 miLoading sold comps…