 🌊 Lakefront
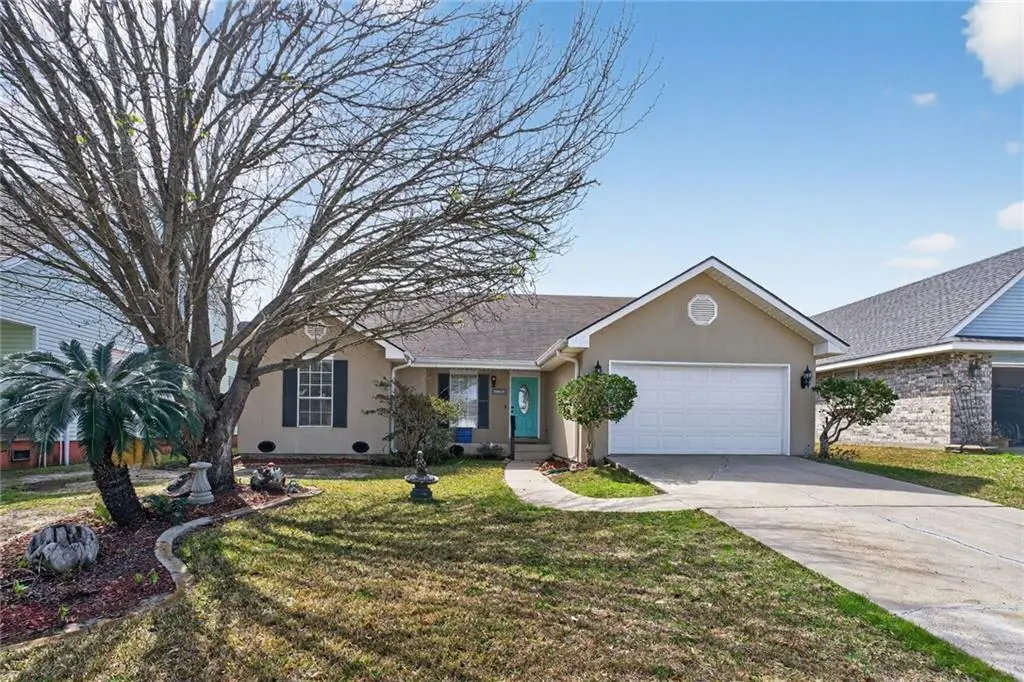
139 Eden Isles Blvd · Eden Isle, LA
Flood risk 9/10 · Severe
- FEMA flood zone
- AE
- Chance of flooding over 30 yrs
- 0.99%
- Est. flood insurance / yr
- $1,737 – $8,500
Fire risk 4/10 · Minor
- Est. fire insurance / yr
- $1,269 – $2,357
Heat risk 10/10 · Severe
- Hot days now (above 108°F)
- 7 days/yr
- Hot days in 30 yrs
- 22 days/yr
Wind risk 9/10 · Severe
- Chance of severe wind over 30 yrs
- 99.0%
Air-quality risk 2/10 · Minimal
- Unhealthy air days now
- 1 days/yr
- Unhealthy air days in 30 yrs
- 2 days/yr
Risk factors via First Street. Map © Google.
Why this score? — see what drove the C- grade
The composite is a weighted blend of 9 inputs, each scored 0–100. Each bar is that input's sub-score; the figure is the points it added to the 100-point composite (weight × sub-score).
- ARV discount +15.0/15.0
- Cash flow +14.8/30.0
- DSCR +4.5/10.0
- Schools +4.3/10.0
- 1% rule +3.5/10.0
- Livability +3.1/5.0
- Rent growth +2.9/5.0
- Condition / age +2.5/5.0
- Appreciation +0.0/10.0
$249,000
🖨 Deal sheet 📄 Offer letter ✓ Due diligence
Listing remarks MLS
Live the Waterfront Lifestyle You've Been Dreaming Of! Sunsets that stop you in your tracks. Fishing from your own backyard. Hop in your boat and cruise the canals with Lake Pontchartrain just minutes away! Inside, the open concept floor plan is perfect for entertaining with a warm and cozy fireplace! Step outside and the magic continues. Sip your morning coffee or unwind in the evening on the covered, screened patio overlooking the water. Host unforgettable gatherings under the pergola. Every day feels like a getaway. All this plus unbeatable convenience to shopping, restaurants, schools, and fun neighborhood block parties. Waterfront. Move-in ready. Incredible lifestyle. Don't miss it!
Key facts
- Cozy fireplace
- Garage
- Built 1993
Tags
Neighborhood map
What this means for you Summary
Snapshot
- This is a 3-bed/2.0-bath single-family listed at $249k.
Deal economics
- At list price, monthly cash flow is $-360 ($-4k/yr) — negative.
- To cash-flow at today's rent, offer at most $185k (25.5% below list).
- To meet the 1% rule (rent ≥ 1% of price), the offer needs to be $211k (15.1% below list).
- Recommended offer: $185k (25.5% below list) — sets the bar for cash-flow.
- Cap rate 6.6% vs local median 2.8% in Eden Isle — top-decile yield for the area; either an underpriced asset or a hidden risk that comps aren't pricing in. Stress-test before assuming the spread holds.
Location & tenants
- Location reads 62/100 on livability (#207 in LA) — a middle-class / working-renter tenant base. Strengths: crime A, housing A, employment B; Watch: schools D, amenities F, commute F.
- St. Tammany Parish (suburban): math 43% / reading 55% proficiency, ranked #11 of 98 in LA (top 11%) — families likely to look elsewhere, expect single-tenant / working-renter base with shorter leases.
- Market conditions: Rents rising (+1.5%/yr); 489 active listings in the ZIP; 15 comparable units currently listed for rent nearby; rentals at typical pace (median 24d on market — plan ~3-4 weeks tenant-placement turnaround); 47% of comp listings sitting > 30 days — soft ceiling on asking rent; 1,064 units permitted in St. Tammany Parish in 2024 (0 in 5+ unit buildings).
- This rent runs 35% of the median local income ($73k/yr) — at the standard rent-burdened threshold; future hikes will face affordability resistance.
Forward outlook
- Local home prices are declining (-3.0%/yr); year-one equity from $2k of loan paydown is wiped out by about $7k of value loss. Plan a longer hold.
- St. Tammany County population projected at +27% by 2050 — long-run rental-demand tailwind backs the buy-and-hold thesis.
Negotiation context
- It's been on market 108 days — a 9% lower offer ($227k) is reasonable based on typical stale-listing flexibility.
- 6 sale attempts since 8y ago; this cycle's ask has dropped $40k (14%) from the opening price — seller is motivated, your offer sets the floor, not the list.
Risks & watch-outs
- Watch-outs: flood insurance adds $427/mo.
- Climate carrying-cost: in FEMA flood zone AE (mandatory federal flood insurance); severe wind risk, 99% chance of damaging wind over 30y; extreme-heat days projected 7→22/yr by 2055 (HVAC capex compounding) — expect insurance premiums to compound above CPI over the hold.
Questions for the listing agent
- What do current leases actually rent for vs. the listed asking? Can we see a recent rent roll and the last 12 months of T-12 income?
- It's been on market 108 days. Have you received any prior offers? Is the seller open to a 26% concession, seller financing, or rate buy-down credit?
- What's the actual annual flood-insurance premium (NFIP or private), and is the property in a SFHA with mandatory coverage?
- What does the HOA fee cover, when was the last increase, and are there any pending special assessments or reserve-fund shortfalls?
- Why hasn't it sold? Are there any deal-killer items the seller is aware of (foundation, flood, title, zoning, code violations)?
- Is there a deadline driving the sale (1031 exchange, divorce, estate, relocation)? That informs how much negotiation room exists.
- Schools are D-rated, which usually means shorter tenancies and higher turnover. Who's the typical renter profile here, and what's been the actual vacancy rate?
- This sits on a lake — are riparian / water-frontage rights deeded with the parcel? Any dock permits, shoreline easements, or HOA water-use restrictions?
- What's the documented flood / surge / shoreline-erosion history here (FEMA AND non-FEMA — e.g., storm surge, creek backup, septic-field saturation)?
- Any water-quality or seasonal algae-bloom issues that affect tenant satisfaction or short-term-rental demand?
- What's the average days-on-market for RENTAL listings here right now (not sales)? A rising rental-DOM trend means longer vacancies and softer asking-rent achievability than the comps imply.
- What's the recent tenant-quality profile in this submarket — average credit score on applications, eviction rate, late-payment / NSF rate, and stable-employment percentage? A property-management company in the area should have these aggregated.
- How much new for-sale + rental construction is in the pipeline within 1–3 miles? Heavy new supply typically softens prices + rents 12–24 months out; constrained supply supports both.
Investment metrics
- 1% rule
- 0.85% ✗
- Cap rate
- 6.61%
- Cash-on-cash
- 1.15%
- DSCR
- 1.05
- GRM
- 9.8
CMA / ARV
- ARV (median comp)
- $326,772
- List price
- $249,000
- Delta
- -23.80%
- Verdict
- UNDERPRICED
- Comps
- 20 within 1.0 mi
Show comp detail 12 sales within ~0.75 mi
| Address | Dist | Beds/Ba | Sqft | Sold | Price | $/sf | Match |
|---|---|---|---|---|---|---|---|
| 194 Moonraker Dr | 0.43mi | 3/2.0 | 1,740 (-1%) | 7mo | $255,000 | $147 | 72 |
| 100 Blackfin Cv | 0.17mi | 3/2.0 | 1,650 (-6%) | 12mo | $266,000 | $161 | 71 |
| 215 Blackfin Cv | 0.24mi | 3/2.0 | 1,659 (-6%) | 10mo | $289,900 | $175 | 71 |
| 106 Eydie Ln | 0.50mi | 3/2.0 | 1,710 (-3%) | 2mo | $260,000 | $152 | 71 |
| 422 Eden Isles Blvd | 0.54mi | 3/2.0 | 1,736 (-1%) | 9mo | $245,000 | $141 | 66 |
| 127 Windward Passage St | 0.46mi | 3/2.0 | 1,684 (-4%) | 10mo | $310,000 | $184 | 63 |
| 113 Ondine Ln | 0.72mi | 3/2.5 | 1,685 (-4%) | 10mo | $349,500 | $207 | 50 |
| 428 Charles Ct | 0.66mi | 3/2.0 | 1,871 (+6%) | 12mo | $320,000 | $171 | 48 |
| 234 Constellation Dr | 0.60mi | 3/2.0 | 2,013 (+15%) | 2mo | $300,000 | $149 | 46 |
| 425 Eden Isles Blvd | 0.56mi | 3/3.5 | 1,931 (+10%) | 8mo | $285,000 | $148 | 44 |
| 433 Charles Ct | 0.71mi | 3/2.0 | 1,940 (+10%) | 7mo | $260,000 | $134 | 44 |
| 435 Charles Ct | 0.72mi | 3/2.0 | 2,018 (+15%) | 4mo | $319,600 | $158 | 39 |
Match score weights: distance 35% · size 25% · config 20% · recency 20%. Top-matched comps best support the ARV.
Projected returns pro-forma
-3.0% appreciation · 1.47% rent growth · sell at horizon
- IRR
- -28.9%
- Equity multiple
- 0.05×
- Total profit
- $-66,252
- Equity at exit
- $37,127
- IRR
- -37.8%
- Equity multiple
- -0.42×
- Total profit
- $-99,060
- Equity at exit
- $21,529
Cash invested: $69,720 (down + closing). Projections, not guarantees.
Landlord ↔ Tenant lean methodology
- Overall (STATE)
- 90 Strongly Landlord-Friendly
- State Louisiana
- 90 Strongly Landlord-Friendly · R+12
- County
- — inherits STATE
- City
- — inherits STATE
ZIP-level market 70458
- Rents YoY
- 1.5%
- Active inventory
- 489
- Price-to-rent
- 9.8×
Monthly cashflow live
- Estimated rent
- $2,115 high interval (Pro) →
- Mortgage (P&I)
- −$1,306
- Tax from tax record
- −$181 /mo · $2,177/yr
- Insurance
- −$104
- Flood insurance flood zone
- −$427 /mo · $5,118/yr
- HOA
- −$13
- Vacancy / Maint / Mgmt
- −$444
- Net cashflow
- $-360
Break-even live
UW: 25.0% down · 7.5% · 30yr · 1.5% tax · 5.0% vac · 8.0% maint · 8.0% mgmt
Financing live
Cash to close
- Down payment
- $62,250
- Closing costs
- $7,470
- Reserves months
- —
- Total cash needed
- —
Loan-product check · same deal, 3 products live
Conventional
25% down · 7.5% · 30yr
- Down + closing
- —
- Monthly P&I
- —
- Monthly cashflow
- —
- DSCR
- —
- Eligible?
- —
Personal DTI + credit; lowest rate.
DSCR
20% down · 8.5% · 30yr
- Down + closing
- —
- Monthly P&I
- —
- Monthly cashflow
- —
- DSCR
- —
- Eligible?
- —
No personal income docs; deal must DSCR.
Hard money
10% down · 12.0% · 12mo
- Down + closing
- —
- Monthly P&I
- —
- Monthly cashflow
- —
- DSCR
- —
- Eligible?
- —
Short-term bridge; refi at stabilization.
Rent comps 15 comps
| Address | Beds | Baths | Sqft | Rent | $/sqft | DOM | Units | Dist |
|---|---|---|---|---|---|---|---|---|
| 101 Moonraker Dr Slidell, LA | 3.0 | 2.0 | 1811 | $2,300 | $1.27 | 23d | 1 | 0.09mi |
| 228 Constellation Dr Slidell, LA | 3.0 | 2.0 | 1724 | $2,300 | $1.33 | 21d | 1 | 0.59mi |
| 119 Ondine Ln Slidell, LA | 4.0 | 2.0 | 2616 | $3,000 | $1.15 | 43d | 1 | 0.69mi |
| 100 Marina Dr Unit 100 Slidell, LA | 3.0 | 3.0 | 1850 | $1,925 | $1.04 | 3d | 1 | 0.73mi |
| 152 Marina Dr Slidell, LA | 2.0 | 2.0 | 1250 | $1,400 | $1.12 | 20d | 1 | 0.74mi |
| 1505 Cuttysark Cv Slidell, LA | 4.0 | 2.5 | 2588 | $2,950 | $1.14 | 43d | 1 | 0.75mi |
| 224 Marina Dr Slidell, LA | 2.0 | 1.5 | 1287 | $1,400 | $1.09 | 43d | 1 | 0.78mi |
| 232 Marina Dr Slidell, LA | 2.0 | 1.5 | 1250 | $1,500 | $1.20 | 43d | 1 | 0.79mi |
| 277 Moonraker Dr Slidell, LA | 3.0 | 3.0 | 2100 | $2,200 | $1.05 | 43d | 1 | 0.95mi |
| 870 Marina Dr Unit B Slidell, LA | 3.0 | 2.5 | 1700 | $2,000 | $1.18 | 43d | 1 | 1.10mi |
| 870 Marina Dr Unit A Slidell, LA | 3.0 | 2.5 | 1600 | $1,950 | $1.22 | 3d | 1 | 1.11mi |
| 102 Spartan Trace Blvd Slidell, LA | 3.0 | 2.0 | 1516 | $2,000 | $1.32 | 23d | 1 | 1.16mi |
| 25 Oak Tree Dr Slidell, LA | 4.0 | 2.5 | 2530 | $2,900 | $1.15 | 1d | 1 | 1.19mi |
| 427 Moonraker Dr Slidell, LA | 3.0 | 2.0 | 2120 | $2,500 | $1.18 | 43d | 1 | 1.19mi |
| 519 Spartan Dr #9101 Slidell, LA | 2.0 | 2.0 | 1304 | $1,400 | $1.07 | 23d | 1 | 1.38mi |
HOA detail
- Monthly dues
- $13 · $156/yr
- Likely covers
- water
Listing history 30 events
-
2026-06-18days on market $249,000 Active 108 DOM
-
2026-06-17days on market $249,000 Active 107 DOM
-
2026-06-16days on market $249,000 Active 106 DOM
-
2026-06-15days on market $249,000 Active 105 DOM
-
2026-06-13days on market $249,000 Active 103 DOM
-
2026-06-10pricedays on market $249,000 Active 100 DOM
-
2026-06-09days on market $279,000 Active 99 DOM
-
2026-06-08days on market $279,000 Active 98 DOM
-
2026-06-07days on market $279,000 Active 97 DOM
-
2026-06-03days on market $279,000 Active 93 DOM
-
2026-06-02days on market $279,000 Active 92 DOM
-
2026-06-01days on market $279,000 Active 91 DOM
-
2026-05-31days on market $279,000 Active 90 DOM
-
2026-04-20price $279,000 696-char remark
Show marketing remark (709 chars)
Live the Waterfront Lifestyle You’ve Been Dreaming Of! Sunsets that stop you in your tracks. Fishing from your own backyard. Hop in your boat and cruise the canals with Lake Pontchartrain just minutes away! Inside, the open concept floor plan is perfect for entertaining with a warm and cozy fireplace! Step outside and the magic continues. Sip your morning coffee or unwind in the evening on the covered, screened patio overlooking the water. Host unforgettable gatherings under the pergola. Every day feels like a getaway. All this plus unbeatable convenience to shopping, restaurants, schools, and fun neighborhood block parties. Waterfront. Move-in ready. Incredible lifestyle. Don’t miss it!
-
2026-04-20price $279,000 709-char remark
Show marketing remark (709 chars)
Live the Waterfront Lifestyle You’ve Been Dreaming Of! Sunsets that stop you in your tracks. Fishing from your own backyard. Hop in your boat and cruise the canals with Lake Pontchartrain just minutes away! Inside, the open concept floor plan is perfect for entertaining with a warm and cozy fireplace! Step outside and the magic continues. Sip your morning coffee or unwind in the evening on the covered, screened patio overlooking the water. Host unforgettable gatherings under the pergola. Every day feels like a getaway. All this plus unbeatable convenience to shopping, restaurants, schools, and fun neighborhood block parties. Waterfront. Move-in ready. Incredible lifestyle. Don’t miss it!
-
2026-03-02$289,000 Active 696-char remark
Show marketing remark (709 chars)
Live the Waterfront Lifestyle You’ve Been Dreaming Of! Sunsets that stop you in your tracks. Fishing from your own backyard. Hop in your boat and cruise the canals with Lake Pontchartrain just minutes away! Inside, the open concept floor plan is perfect for entertaining with a warm and cozy fireplace! Step outside and the magic continues. Sip your morning coffee or unwind in the evening on the covered, screened patio overlooking the water. Host unforgettable gatherings under the pergola. Every day feels like a getaway. All this plus unbeatable convenience to shopping, restaurants, schools, and fun neighborhood block parties. Waterfront. Move-in ready. Incredible lifestyle. Don’t miss it!
-
2026-03-02$289,000 Active 709-char remark
Show marketing remark (709 chars)
Live the Waterfront Lifestyle You’ve Been Dreaming Of! Sunsets that stop you in your tracks. Fishing from your own backyard. Hop in your boat and cruise the canals with Lake Pontchartrain just minutes away! Inside, the open concept floor plan is perfect for entertaining with a warm and cozy fireplace! Step outside and the magic continues. Sip your morning coffee or unwind in the evening on the covered, screened patio overlooking the water. Host unforgettable gatherings under the pergola. Every day feels like a getaway. All this plus unbeatable convenience to shopping, restaurants, schools, and fun neighborhood block parties. Waterfront. Move-in ready. Incredible lifestyle. Don’t miss it!
-
2020-03-11soldstatus $224,500
-
2020-03-09soldstatus $224,500 Closed
-
2020-02-07status Pending
-
2020-01-28price $229,500
-
2019-12-12$239,900 Active
-
2019-12-12$229,500
-
2018-09-10soldstatus $189,500
-
2018-09-07soldstatus $189,500 Sold
-
2018-09-05historical Pending Continue to Show
-
2018-07-20price $234,900
-
2018-06-20price $239,900
-
2018-04-12$249,000 Active
-
2018-04-12$234,900
ⓘ Source: listings_history table (triggers on properties + properties_extension) + one-shot
backfill from property_details.listing_events for pre-trigger history.
Tax reassessment forecast LA · Resets to sale price
- Current annual tax
- $2,177 · $181/mo
- Projected year-2 tax
- $2,177 · $181/mo
- Expected delta
- $0/yr ($0/mo · 0.0%)
ⓘ Screening estimate from a state-policy table — verify with the county assessor before closing.
Climate risk First Street
- Flood 9/10 Extreme FEMA zone AE · 99% chance over 30 yrs
- Wildfire 4/10 Moderate
- Heat 10/10 Extreme 7 d/yr ≥108°F today · 22 d/yr by 30 yrs out
- Wind 9/10 Extreme 99% chance of damaging wind over 30 yrs
- Air quality 2/10 Low 1 unhealthy d/yr today · 2 by 30 yrs out
Nearby sold comps map
Loading sold comps map…
Walkable amenities ~0.75 mi
Loading nearby amenities…
Taxation est. · year 1
- Rental income
- $25,377
- − Mortgage interest
- −$13,948
- − Property taxes
- −$2,177
- − Insurance
- −$6,364
- − Repairs & maintenance
- −$2,030
- − Management
- −$2,030
- − HOA
- −$156
- − Depreciation
- −$7,244
- Taxable loss
- −$8,571
- Est. tax savings @ 24.0%
- +$2,057
- After-tax cash flow
- $-2,261/yr
For passive investors: Depreciation is non-cash, so a rental often shows a tax loss while cash-flowing — sheltering income. Rental losses are passive: they offset passive income freely, and up to $25,000/yr can offset ordinary (W-2) income if you actively participate and your MAGI is under $100k (phasing out to $0 by $150k); unused losses carry forward. On sale, claimed depreciation is recaptured at up to 25%, and gains may owe capital-gains tax (a 1031 exchange can defer both). Figures are a year-1 estimate at your 24.0% rate — not tax advice; consult a CPA.
Schools (NCES district)
- District
- St. Tammany Parish
- NCES district ID
- 2201650
- Math proficiency
- 43% ▼ -32.00%
- Reading proficiency
- 55% ▼ -26.00%
- Median HH income
- $61,752
- Composite
- 43.04/100
- National rank
- #3098
- State rank
- #11 of 98 in LA
Livability — Eden Isle
- Score
- 62/100
- State rank
- #207
- US rank
- #16121
Category grades
Schools grade is shown separately in the Schools card above.
Census & demographics
- Census place
- Eden Isle, LA
- County
- Saint Tammany Parish · 228,296 people
- Metro
- New Orleans-Metairie, LA
- Population (ZIP)
- 39,034
- Household income
- $72,843
- Rent vs Own
- Severe rent burden
- 1331.0
Population outlook (St. Tammany County) Hauer SSP2
- Today (2025)
- 286,725 people
- By 2030
- 304,175 · +6.1%
- By 2040
- 336,203 · +17.3%
- By 2050
- 364,590 · +27.2%
- By 2075
- 433,362 · +51.1%
- By 2100
- 470,333 · +64.0%
Race, ethnicity, and origin ACS 2023
- Neighborhood character
- Predominantly White (66%)
- Race & ethnicity
- White 66% Black 17% Two or more races 10% Hispanic / Latino 9% Native American 2% Asian 1%
- Hispanic origin (detail)
- Mexican 3% Puerto Rican 1%
- Common ancestry
- Lithuanian 15% Slovak 2% Romanian 1%
- Foreign-born
- 3% · Canada, Vietnam
- Languages at home
- 93% English-only · Spanish 5% Vietnamese 1%
Political lean MEDSL · St. Tammany
- 2024 margin
- Solid R (+43.8) · D 27.3% · R 71.1% · Other 1.6%
- 2008→2024 swing
- +9.6pp toward D · 2008: -53.4pp · 2024: -43.8pp
- All cycles
- 2024: R+43.8 2020: R+44.2 2016: R+50.8 2012: R+52.2 2008: R+53.4
Not yet ingested
- Civics
- —
Market trends
- HPI YoY
- ▼ -173.60%
- Current HPI
- 147.4749
- Rent YoY
- ▲ 1.47%
- Metro
- New Orleans-Metairie, LA
- State GDP YoY
- ▲ 3.29%
- F500 in state
- 10
Industry mix (Fortune 500 HQ in LA)
| Industry | F500 HQs | Revenue |
|---|---|---|
| Telecommunications | 2 | $23B |
|
||
| Utilities | 1 | $12B |
|
||
| Wholesale / Distribution | 1 | $5B |
|
||
| Advertising | 1 | $2B |
|
||
Price history
+12.0% since first listed17 events — show timeline
- 2026-04-20 Price Changed $279,000 AcadianaMLS
- 2026-04-20 Price Changed $279,000 GSREIN
- 2026-03-02 Listed $289,000 GSREIN
- 2026-03-02 Listed $289,000 AcadianaMLS
- 2020-03-11 Sold (Public Records) $224,500 Public Records
- 2020-03-09 Sold (MLS) $224,500 GSREIN
- 2020-02-07 Pending — GSREIN
- 2020-01-28 Price Changed $229,500 GSREIN
- 2019-12-12 Listed $229,500 AcadianaMLS
- 2019-12-12 Listed $239,900 GSREIN
- 2018-09-10 Sold (Public Records) $189,500 Public Records
- 2018-09-07 Sold (MLS) $189,500 GSREIN
- 2018-09-05 Contingent — GSREIN
- 2018-07-20 Price Changed $234,900 GSREIN
- 2018-06-20 Price Changed $239,900 GSREIN
- 2018-04-12 Listed $234,900 AcadianaMLS
- 2018-04-12 Listed $249,000 GSREIN
Property tax history
+4.8%/yrLatest (2025): $2,177 · -14.7% YoY. Source: county tax records.
Cash-flow waterfall
monthlySold comps — $/sqft
last 12 mo · ≤1 miLoading sold comps…