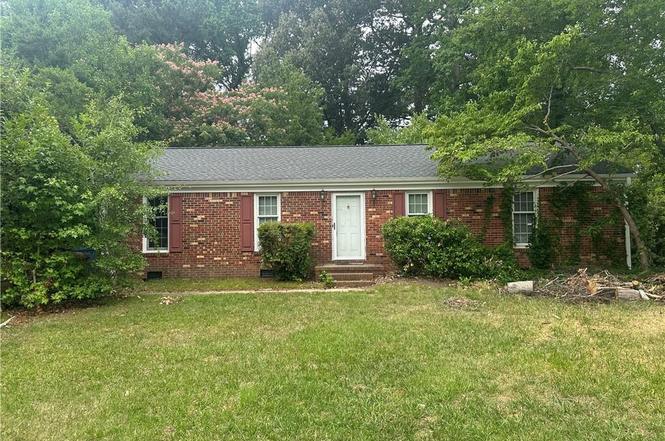
532 Sunderland Ter · Chesapeake, VA
Flood risk 1/10 · Minimal
- FEMA flood zone
- X (unshaded)
- Chance of flooding over 30 yrs
- 0.0%
- Est. flood insurance / yr
- $507 – $1,088
Fire risk 4/10 · Minor
- Est. fire insurance / yr
- $666 – $1,236
Heat risk 8/10 · Major
- Hot days now (above 106°F)
- 7 days/yr
- Hot days in 30 yrs
- 16 days/yr
Wind risk 8/10 · Major
- Chance of severe wind over 30 yrs
- 80.0%
Air-quality risk 1/10 · Minimal
- Unhealthy air days now
- 0 days/yr
- Unhealthy air days in 30 yrs
- 0 days/yr
Risk factors via First Street. Map © Google.
Why this score? — see what drove the B- grade
The composite is a weighted blend of 9 inputs, each scored 0–100. Each bar is that input's sub-score; the figure is the points it added to the 100-point composite (weight × sub-score).
- Cash flow +27.8/30.0
- DSCR +9.8/10.0
- 1% rule +8.0/10.0
- ARV discount +7.5/15.0
- Schools +5.8/10.0
- Rent growth +3.6/5.0
- Livability +3.5/5.0
- Condition / age +2.5/5.0
- Appreciation +0.0/10.0
$200,000
🖨 Deal sheet 📄 Offer letter ✓ Due diligence
Listing remarks
Investor Special in Etheridge Manor! This 3-bedroom, 2-bath ranch offers approximately 1,500 square feet of potential in one of Chesapeake's established neighborhoods. Built in 1982, the home features a brand-new roof (2025) and provides an excellent opportunity for investors, flippers, or buyers looking to renovate and build equity. Sold as-is, this property is ready for its next chapter. Bring your vision and transform this home into something special. Conveniently located near shopping, dining, schools, and major commuter routes
Key facts
- Brand new roof
- 0.3 acre lot
- Built 1982
Tags
Property features AI
Finance
- HOA & community: No HOA fees indicated
Exterior
- Parking: Off-street parking via driveway spaces
- Utilities: City/County water; City/County sewer; Electric water heater; Electric power
- Home design: Detached single-family home; Ranch-style, single-story
- Construction: Crawl foundation; Asphalt shingle roof
- Exterior features: Brick siding; Back yard fenced; Lot dimensions approximately 140 x 95 (≈0.305 acres)
Interior
- Kitchen: Dishwasher; Electric range; Refrigerator
- Bedrooms: Master bedroom on first floor; One bedroom with ensuite (first floor master with full bath)
- Flooring: Carpet; Vinyl
- Bathrooms: Two full bathrooms; Bedroom and full bathroom on first floor
- Heating & cooling: Forced hot air heating; Central air conditioning
- Interior features: One fireplace; Carpet and vinyl flooring; Six total rooms; Fixer upper
- Laundry & utility: Utility room
Neighborhood map
What this means for you Summary
Snapshot
- This is a 3-bed/2.0-bath single-family listed at $200k.
Deal economics
- At list price, monthly cash flow is $608 ($7k/yr) — positive.
- The deal already cash-flows at list — no discount required.
- Meets the 1% rule at list price ($3k rent vs $200k).
- Cap rate 9.9% vs local median 3.7% in Chesapeake — top-decile yield for the area; either an underpriced asset or a hidden risk that comps aren't pricing in. Stress-test before assuming the spread holds.
Location & tenants
- Location reads 70/100 on livability (#236 in VA) — a middle-class / working-renter tenant base. Strengths: employment A+, housing A+; Watch: crime C-, cost of living C-, amenities F.
- Chesapeake City Public School District (suburban): math 58% / reading 74% proficiency, ranked #31 of 131 in VA (top 24%) — acceptable for families but not a draw, mixed tenant base, ~2y average lease.
- Zoned schools: Butts Road Primary (545 students, 13% FRL); Hickory High (math 74% / reading 89%, grade A, #50 of 319 statewide, top 16%, 1,581 students, 11% FRL) — zoned schools average 12% FRL vs 28% district-wide (15 pts lower); this property's tenant base skews higher-income than the district average.
- Zoned-school proficiency averages 82% at this address vs 66% district-wide (+16 pts) — the actual schools serving this property are materially stronger than the Chesapeake City Public School District average implies; a family-tenant draw the district grade alone would hide.
- Market conditions: Rents rising fast (+4.5%/yr); 596 active listings in the ZIP; 1 comparable units currently listed for rent nearby; high-income renter base; 597 units permitted in Chesapeake city in 2024 (0 in 5+ unit buildings).
Forward outlook
- Local home prices are declining (-3.0%/yr); year-one equity from $1k of loan paydown is wiped out by about $6k of value loss. Plan a longer hold.
- Chesapeake County population projected at +21% by 2050 — long-run rental-demand tailwind backs the buy-and-hold thesis.
- At projected returns (-3.0% appreciation + 4.5% rent growth), your $56k cash investment doubles in ~8 years — after that, you're playing with house money.
Negotiation context
- Only 1 days on market — expect competitive offers; lowballing is unlikely to land.
- Current owner paid $103k; list at $200k implies a 94% gain — meaningful room to come down on a strong offer.
Risks & watch-outs
- Climate carrying-cost: severe wind risk, 80% chance of damaging wind over 30y; extreme-heat days projected 7→16/yr by 2055 (HVAC capex compounding) — expect insurance premiums to compound above CPI over the hold.
Questions for the listing agent
- Is there a deadline driving the sale (1031 exchange, divorce, estate, relocation)? That informs how much negotiation room exists.
- Schools are A-rated — typically a magnet for longer-tenancy family renters. What's the average tenant stay here, and is there a school-zone premium baked into asking?
- What's the average days-on-market for RENTAL listings here right now (not sales)? A rising rental-DOM trend means longer vacancies and softer asking-rent achievability than the comps imply.
- What's the recent tenant-quality profile in this submarket — average credit score on applications, eviction rate, late-payment / NSF rate, and stable-employment percentage? A property-management company in the area should have these aggregated.
- How much new for-sale + rental construction is in the pipeline within 1–3 miles? Heavy new supply typically softens prices + rents 12–24 months out; constrained supply supports both.
Investment metrics
- 1% rule
- 1.30% ✓
- Cap rate
- 9.94%
- Cash-on-cash
- 13.04%
- DSCR
- 1.58
- GRM
- 6.4
CMA / ARV
- ARV (on-the-fly)
- $412,992
- Comps found
- 7
Show comp detail 7 sales within ~0.75 mi
| Address | Dist | Beds/Ba | Sqft | Sold | Price | $/sf | Match |
|---|---|---|---|---|---|---|---|
| 580 Etheridge Rd | 0.32mi | 3/2.0 | 1,464 (+2%) | 1mo | $385,000 | $263 | 80 |
| 814 Bellingham Dr | 0.16mi | 3/2.0 | 1,473 (+3%) | 12mo | $460,000 | $312 | 78 |
| 813 Bellingham Dr | 0.13mi | 3/2.0 | 1,600 (+12%) | 2mo | $480,000 | $300 | 73 |
| 700 Lindenbrook Ln | 0.53mi | 3/2.0 | 1,476 (+3%) | 2mo | $395,000 | $268 | 69 |
| 544 Aylesbury Dr | 0.09mi | 4/2.5 (+1) | 1,616 (+13%) | 8mo | $465,000 | $288 | 61 |
| 1108 Shifford Ln | 0.44mi | 4/2.0 (+1) | 1,590 (+11%) | 3mo | $512,400 | $322 | 54 |
| 516 Ravenstone Dr | 0.31mi | 4/2.0 (+1) | 1,644 (+15%) | 10mo | $457,500 | $278 | 48 |
Match score weights: distance 35% · size 25% · config 20% · recency 20%. Top-matched comps best support the ARV.
Projected returns pro-forma
-3.0% appreciation · 4.46% rent growth · sell at horizon
- IRR
- 4.7%
- Equity multiple
- 1.18×
- Total profit
- $10,280
- Equity at exit
- $29,821
- IRR
- 15.5%
- Equity multiple
- 2.35×
- Total profit
- $75,473
- Equity at exit
- $17,292
Cash invested: $56,000 (down + closing). Projections, not guarantees.
Landlord ↔ Tenant lean methodology
- Overall (STATE)
- 55 Moderately Landlord-Leaning
- State Virginia
- 55 Moderately Landlord-Leaning · D+2
- County
- — inherits STATE
- City
- — inherits STATE
ZIP-level market 23322
- Rents YoY
- 4.5%
- Active inventory
- 596
- Price-to-rent
- 6.4×
Monthly cashflow live
- Estimated rent
- $2,590 medium interval (Pro) →
- Mortgage (P&I)
- −$1,049
- Tax from tax record
- −$306 /mo · $3,670/yr
- Insurance
- −$83
- HOA
- −$0
- Vacancy / Maint / Mgmt
- −$544
- Net cashflow
- $608
Break-even live
UW: 25.0% down · 7.5% · 30yr · 1.5% tax · 5.0% vac · 8.0% maint · 8.0% mgmt
Financing live
Cash to close
- Down payment
- $50,000
- Closing costs
- $6,000
- Reserves months
- —
- Total cash needed
- —
Loan-product check · same deal, 3 products live
Conventional
25% down · 7.5% · 30yr
- Down + closing
- —
- Monthly P&I
- —
- Monthly cashflow
- —
- DSCR
- —
- Eligible?
- —
Personal DTI + credit; lowest rate.
DSCR
20% down · 8.5% · 30yr
- Down + closing
- —
- Monthly P&I
- —
- Monthly cashflow
- —
- DSCR
- —
- Eligible?
- —
No personal income docs; deal must DSCR.
Hard money
10% down · 12.0% · 12mo
- Down + closing
- —
- Monthly P&I
- —
- Monthly cashflow
- —
- DSCR
- —
- Eligible?
- —
Short-term bridge; refi at stabilization.
Rent comps 1 comps
| Address | Beds | Baths | Sqft | Rent | $/sqft | DOM | Units | Dist |
|---|---|---|---|---|---|---|---|---|
| 209 N Hill Ln Chesapeake, VA | 2.0 | 2.5 | 1586 | $2,250 | $1.42 | 17d | 1 | 1.22mi |
Listing history 2 events
-
2026-06-18remarks 537-char remark
-
2026-06-18$200,000 Active 1 DOM
ⓘ Source: listings_history table (triggers on properties + properties_extension) + one-shot
backfill from property_details.listing_events for pre-trigger history.
Tax reassessment forecast VA · Resets to sale price
- Current annual tax
- $3,670 · $306/mo
- Projected year-2 tax
- $3,670 · $306/mo
- Expected delta
- $0/yr ($0/mo · 0.0%)
ⓘ Screening estimate from a state-policy table — verify with the county assessor before closing.
Climate risk First Street
- Flood 1/10 Low FEMA zone X (unshaded) · 0% chance over 30 yrs
- Wildfire 4/10 Moderate
- Heat 8/10 Severe 7 d/yr ≥106°F today · 16 d/yr by 30 yrs out
- Wind 8/10 Severe 80% chance of damaging wind over 30 yrs
- Air quality 1/10 Low 0 unhealthy d/yr today · 0 by 30 yrs out
Nearby sold comps map
Loading sold comps map…
Walkable amenities ~0.75 mi
Loading nearby amenities…
Taxation est. · year 1
- Rental income
- $31,086
- − Mortgage interest
- −$11,203
- − Property taxes
- −$3,670
- − Insurance
- −$1,000
- − Repairs & maintenance
- −$2,487
- − Management
- −$2,487
- − Depreciation
- −$5,818
- Taxable income
- $4,421
- Est. tax owed @ 24.0%
- −$1,061
- After-tax cash flow
- $6,241/yr
For passive investors: Depreciation is non-cash, so a rental often shows a tax loss while cash-flowing — sheltering income. Rental losses are passive: they offset passive income freely, and up to $25,000/yr can offset ordinary (W-2) income if you actively participate and your MAGI is under $100k (phasing out to $0 by $150k); unused losses carry forward. On sale, claimed depreciation is recaptured at up to 25%, and gains may owe capital-gains tax (a 1031 exchange can defer both). Figures are a year-1 estimate at your 24.0% rate — not tax advice; consult a CPA.
Schools (NCES district)
- District
- Chesapeake City Public School District
- NCES district ID
- 5100810
- Math proficiency
- 58% ▼ -29.00%
- Reading proficiency
- 74% ▼ -7.00%
- Median HH income
- $69,356
- Composite
- 57.84/100
- National rank
- #1047
- State rank
- #31 of 131 in VA
Livability — Chesapeake
- Score
- 70/100
- State rank
- #236
- US rank
- #7942
Category grades
Schools grade is shown separately in the Schools card above.
Census & demographics
- Census place
- Chesapeake, VA
- County
- Chesapeake City · 253,091 people
- City population
- 253,091
- Metro
- Virginia Beach-Norfolk-Newport News, VA-NC
- Population (ZIP)
- 66,956
- Household income
- $134,880
- Rent vs Own
- Severe rent burden
- 507.0
Population outlook (Chesapeake County) Hauer SSP2
- Today (2025)
- 263,804 people
- By 2030
- 276,798 · +4.9%
- By 2040
- 299,906 · +13.7%
- By 2050
- 318,284 · +20.7%
- By 2075
- 362,137 · +37.3%
- By 2100
- 372,225 · +41.1%
Race, ethnicity, and origin ACS 2023
- Neighborhood character
- Predominantly White (77%)
- Race & ethnicity
- White 77% Black 9% Two or more races 7% Hispanic / Latino 6% Asian 4%
- Hispanic origin (detail)
- Mexican 2% Puerto Rican 1%
- Common ancestry
- Slovak 2% Italian 2% Lithuanian 2%
- Foreign-born
- 5% · Canada, South Korea
- Languages at home
- 93% English-only · Spanish 2% Tagalog/Filipino 1% Other Indo-European 1%
Political lean MEDSL · Chesapeake
- 2024 margin
- Toss-up / Even · D 51.3% · R 47.5% · Other 1.2%
- 2008→2024 swing
- +2.5pp toward D · 2008: 1.3pp · 2024: 3.8pp
- All cycles
- 2024: D+3.8 2020: D+6.5 2016: R+1.3 2012: D+1.1 2008: D+1.3
Not yet ingested
- Civics
- —
Market trends
- HPI YoY
- ▼ -357.58%
- Current HPI
- 312.495
- Rent YoY
- ▲ 4.46%
- Metro
- Virginia Beach-Norfolk-Newport News, VA-NC
- State GDP YoY
- ▲ 2.40%
- F500 in state
- 50
Industry mix (Fortune 500 HQ in VA)
| Industry | F500 HQs | Revenue |
|---|---|---|
| Aerospace / Defense | 4 | $236B |
|
||
| Technology / Defense | 3 | $32B |
|
||
| Financial Services | 2 | $176B |
|
||
| Utilities | 2 | $27B |
|
||
| Insurance | 2 | $25B |
|
||
| Technology | 2 | $15B |
|
||
Price history
+122.2% since first listed4 events — show timeline
- 2026-06-17 Listed $200,000 REINMLS
- 1994-11-14 Sold (Public Records) $103,000 Public Records
- 1992-01-10 Sold (Public Records) $87,000 Public Records
- 1991-01-03 Sold (Public Records) $90,000 Public Records
Property tax history
+3.3%/yrLatest (2025): $3,670 · +3.5% YoY. Source: county tax records.
Cash-flow waterfall
monthlySold comps — $/sqft
last 12 mo · ≤1 miLoading sold comps…