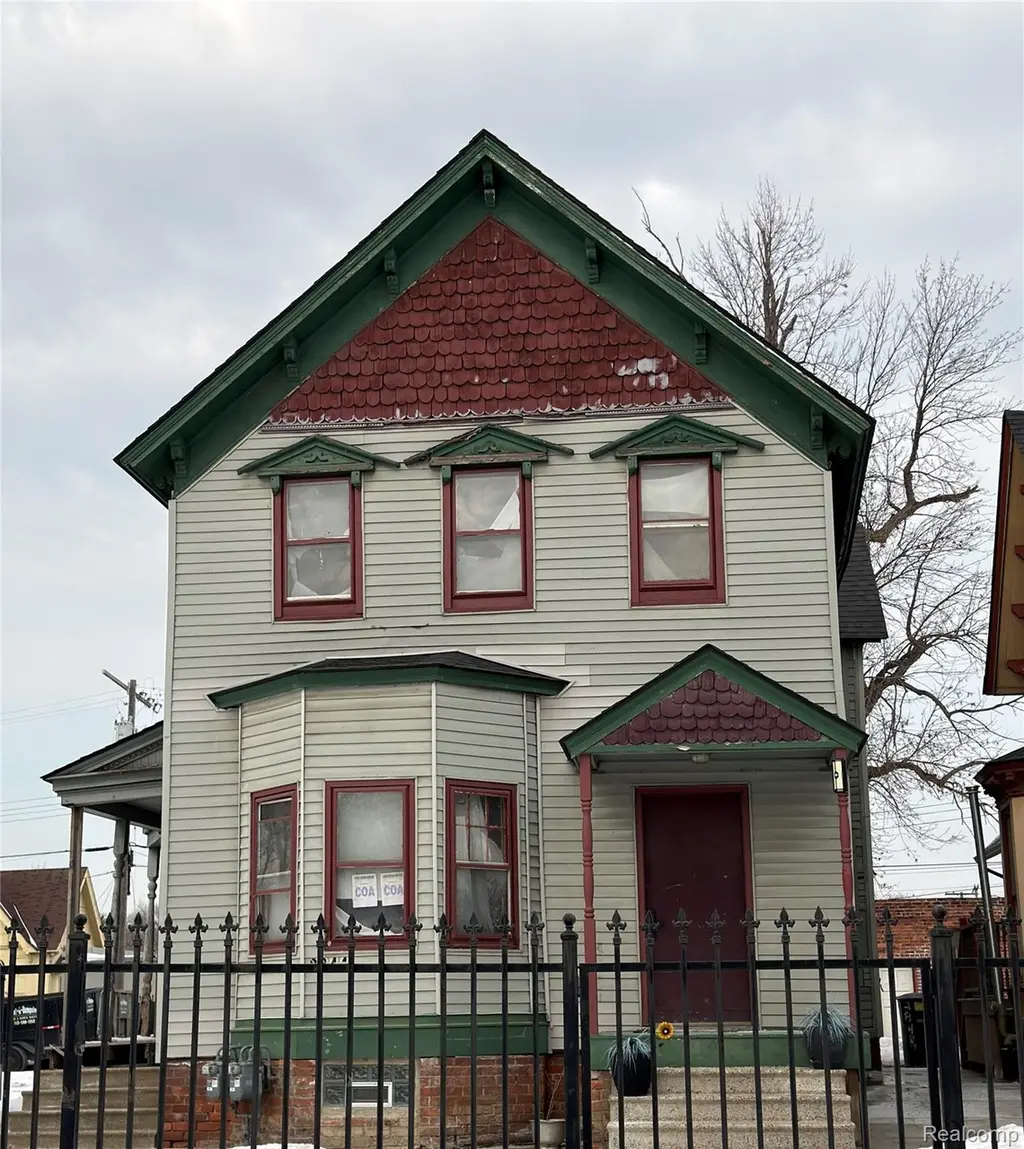
3844 Bagley St · Detroit, MI
Flood risk 1/10 · Minimal
- FEMA flood zone
- X (unshaded)
- Chance of flooding over 30 yrs
- 0.0%
- Est. flood insurance / yr
- $473 – $860
Fire risk 1/10 · Minimal
- Est. fire insurance / yr
- $784 – $1,456
Heat risk 3/10 · Minor
- Hot days now (above 97°F)
- 7 days/yr
- Hot days in 30 yrs
- 15 days/yr
Wind risk 2/10 · Minimal
- Chance of severe wind over 30 yrs
- —
Air-quality risk 4/10 · Minor
- Unhealthy air days now
- 6 days/yr
- Unhealthy air days in 30 yrs
- 8 days/yr
Risk factors via First Street. Map © Google.
Why this score? — see what drove the B+ grade
The composite is a weighted blend of 9 inputs, each scored 0–100. Each bar is that input's sub-score; the figure is the points it added to the 100-point composite (weight × sub-score).
- Cash flow +27.5/30.0
- ARV discount +15.0/15.0
- 1% rule +9.8/10.0
- DSCR +9.7/10.0
- Rent growth +4.3/5.0
- Livability +3.7/5.0
- Appreciation +2.7/10.0
- Condition / age +2.5/5.0
- Schools +1.3/10.0
$135,000
🖨 Deal sheet (PDF) 📄 Offer letter ✓ Due diligence
Listing remarks MLS
Opportunity awaits in one of Detroit’s most vibrant and popular areas. This property is in need of a full interior renovation, but priced accordingly, making it an excellent investment opportunity for the right buyer. With surrounding properties selling for significantly higher prices, this is a great chance to add value and build equity. Located within walking and biking distance to Clark Park and Riverside Park, the area offers outdoor recreation, green space, and access to the Detroit Riverfront. The home is also surrounded by many well-known restaurants, shops, and local businesses, making this a highly desirable and walkable neighborhood. Whether you are an investor looking for your next fix and flip, an Airbnb opportunity, or a buyer looking to renovate and live in a growing area, this property offers strong potential and upside value. BATVAI. Sold as-is.
Key facts
- Green space
- Outdoor recreation
- 6,534 sq ft lot
Tags
Neighborhood map
What this means for you Summary
Snapshot
- This is a 4-bed/2.0-bath townhouse listed at $135k.
Deal economics
- At list price, monthly cash flow is $401 ($5k/yr) — positive.
- The deal already cash-flows at list — no discount required.
- Meets the 1% rule at list price ($2k rent vs $135k).
- Recommended offer: $127k (6.0% below list) — sets the bar for market timing.
Location & tenants
- Location reads 73/100 on livability (#218 in MI) — a middle-class / working-renter tenant base. Strengths: amenities A+, commute A+, cost of living A+; Watch: schools F, crime F, employment F.
- Detroit Public Schools Community District (urban): math 10% / reading 24% proficiency, ranked #499 of 540 in MI (top 92%) — low school quality limits family demand, transient renter base, plan for 1-2y turnover; 90% free/reduced lunch — lower-income household profile, screen leases tightly.
- Market conditions: Rents rising fast (+7.3%/yr); 105 active listings in the ZIP; 3 comparable units currently listed for rent nearby; rentals leasing fast (median 6d on market — plan ~1-2 weeks tenant-placement turnaround); lower-income renter base — watch delinquency; 2,639 units permitted in Wayne County in 2024 (1,216 in 5+ unit buildings).
- At $2,001/mo this rent would consume 54% of the median local household income ($44k/yr) (locally 431% of renters already pay >50% of income on rent) — very limited rent-growth headroom before tenants either downsize or default.
Forward outlook
- Local home prices are declining (-3.0%/yr); year-one equity from $933 of loan paydown is wiped out by about $4k of value loss. Plan a longer hold.
- Wayne County population projected at -17% by 2050 — secular population decline; favor cash flow + early exit over multi-decade hold.
- At projected returns (-3.0% appreciation + 7.3% rent growth), your $38k cash investment doubles in ~7 years — after that, you're playing with house money.
Negotiation context
- It's been on market 71 days — a 6% lower offer ($127k) is reasonable based on typical stale-listing flexibility.
- 12 sale attempts since 9y ago with the ask held roughly flat each time — persistent listings suggest the price (not the market) is what's stuck; bring a comps-based counter.
Risks & watch-outs
- Watch-outs: property tax is 3.7% of price; built in 1900 — expect roof / HVAC / electrical / plumbing capex.
Questions for the listing agent
- It's been on market 71 days. Have you received any prior offers? Is the seller open to a 6% concession, seller financing, or rate buy-down credit?
- Built in 1900 — when were the roof, HVAC, electrical panel, plumbing, and water heater last replaced?
- Property tax is high relative to price — has the assessment been appealed recently, and will the sale trigger a re-assessment?
- Why hasn't it sold? Are there any deal-killer items the seller is aware of (foundation, flood, title, zoning, code violations)?
- Is there a deadline driving the sale (1031 exchange, divorce, estate, relocation)? That informs how much negotiation room exists.
- Schools are F-rated, which usually means shorter tenancies and higher turnover. Who's the typical renter profile here, and what's been the actual vacancy rate?
- Crime grade is F in this area — have there been break-ins, vandalism, or insurance claims at this property in the last 3 years? What carrier currently insures it and at what premium?
- What's the average days-on-market for RENTAL listings here right now (not sales)? A rising rental-DOM trend means longer vacancies and softer asking-rent achievability than the comps imply.
- What's the recent tenant-quality profile in this submarket — average credit score on applications, eviction rate, late-payment / NSF rate, and stable-employment percentage? A property-management company in the area should have these aggregated.
- How much new for-sale + rental construction is in the pipeline within 1–3 miles? Heavy new supply typically softens prices + rents 12–24 months out; constrained supply supports both.
Investment metrics
- 1% rule
- 1.48% ✓
- Cap rate
- 9.85%
- Cash-on-cash
- 12.72%
- DSCR
- 1.57
- GRM
- 5.6
CMA / ARV
- ARV (median comp)
- $239,000
- List price
- $135,000
- Delta
- -43.51%
- Verdict
- UNDERPRICED
- Comps
- 20 within 1.0 mi
Projected returns pro-forma
-3.0% appreciation · 7.3% rent growth · sell at horizon
- IRR
- 8.2%
- Equity multiple
- 1.34×
- Total profit
- $12,856
- Equity at exit
- $20,129
- IRR
- 21.4%
- Equity multiple
- 3.26×
- Total profit
- $85,303
- Equity at exit
- $11,672
Cash invested: $37,800 (down + closing). Projections, not guarantees.
Landlord ↔ Tenant lean methodology
- Overall (STATE)
- 62 Landlord-Friendly
- State Michigan
- 62 Landlord-Friendly · EVEN
- County
- — inherits STATE
- City
- — inherits STATE
ZIP-level market 48216
- Home prices YoY
- -2.3%
- Rents YoY
- 7.3%
- Active inventory
- 105
- Price-to-rent
- 5.6×
Monthly cashflow live
- Estimated rent
- $2,001 medium interval (Pro) →
- Mortgage (P&I)
- −$708
- Tax from tax record
- −$416 /mo · $4,994/yr
- Insurance
- −$56
- HOA
- −$0
- Vacancy / Maint / Mgmt
- −$420
- Net cashflow
- $401
Break-even live
Sensitivity live
| Price | -10% $477 | -5% $439 | +0% $401 | +5% $362 | +10% $324 |
|---|---|---|---|---|---|
| Rent | -10% $243 | -5% $322 | +0% $401 | +5% $480 | +10% $559 |
| Rate | -1.0pp $469 | -0.5pp $435 | base $401 | +0.5pp $366 | +1.0pp $330 |
UW: 25.0% down · 7.5% · 30yr · 1.5% tax · 5.0% vac · 8.0% maint · 8.0% mgmt
Financing live
Cash to close
- Down payment
- $33,750
- Closing costs
- $4,050
- Reserves months
- —
- Total cash needed
- —
Loan-product check · same deal, 3 products live
Conventional
25% down · 7.5% · 30yr
- Down + closing
- —
- Monthly P&I
- —
- Monthly cashflow
- —
- DSCR
- —
- Eligible?
- —
Personal DTI + credit; lowest rate.
DSCR
20% down · 8.5% · 30yr
- Down + closing
- —
- Monthly P&I
- —
- Monthly cashflow
- —
- DSCR
- —
- Eligible?
- —
No personal income docs; deal must DSCR.
Hard money
10% down · 12.0% · 12mo
- Down + closing
- —
- Monthly P&I
- —
- Monthly cashflow
- —
- DSCR
- —
- Eligible?
- —
Short-term bridge; refi at stabilization.
Rent comps 3 comps
| Address | Beds | Baths | Sqft | Rent | $/sqft | DOM | Units | Dist |
|---|---|---|---|---|---|---|---|---|
| 1646 Mc Kinstry St Unit 1F McKinstry Detroit, MI | 4.0 | 1.0 | 1879 | $1,200 | $0.64 | 6d | 1 | 0.38mi |
| 1714 Bagley St Detroit, MI | 3.0 | 2.5 | 2500 | $3,500 | $1.40 | 5d | 1 | 1.15mi |
| 1039 N Rademacher St Detroit, MI | 3.0 | 1.0 | 2400 | $1,300 | $0.54 | 25d | 1 | 1.40mi |
Listing history 40 events
-
2026-06-04status $135,000 Pending 71 DOM
-
2026-06-03days on market $135,000 Active 71 DOM
-
2026-06-02days on market $135,000 Active 70 DOM
-
2026-06-01days on market $135,000 Active 69 DOM
-
2026-05-31days on market $135,000 Active 68 DOM
-
2026-03-24$135,000 Active 879-char remark
Show marketing remark (873 chars)
Opportunity awaits in one of Detroit's most vibrant and popular areas. This property is in need of a full interior renovation, but priced accordingly, making it an excellent investment opportunity for the right buyer. With surrounding properties selling for significantly higher prices, this is a great chance to add value and build equity. Located within walking and biking distance to Clark Park and Riverside Park, the area offers outdoor recreation, green space, and access to the Detroit Riverfront. The home is also surrounded by many well-known restaurants, shops, and local businesses, making this a highly desirable and walkable neighborhood. Whether you are an investor looking for your next fix and flip, an Airbnb opportunity, or a buyer looking to renovate and live in a growing area, this property offers strong potential and upside value. BATVAI. Sold as-is.
-
2026-03-24$135,000 Active 873-char remark
Show marketing remark (873 chars)
Opportunity awaits in one of Detroit's most vibrant and popular areas. This property is in need of a full interior renovation, but priced accordingly, making it an excellent investment opportunity for the right buyer. With surrounding properties selling for significantly higher prices, this is a great chance to add value and build equity. Located within walking and biking distance to Clark Park and Riverside Park, the area offers outdoor recreation, green space, and access to the Detroit Riverfront. The home is also surrounded by many well-known restaurants, shops, and local businesses, making this a highly desirable and walkable neighborhood. Whether you are an investor looking for your next fix and flip, an Airbnb opportunity, or a buyer looking to renovate and live in a growing area, this property offers strong potential and upside value. BATVAI. Sold as-is.
-
2024-01-06historical
-
2024-01-06historical
-
2023-12-05price $135,000
-
2023-12-05price $135,000
-
2023-11-08$140,000 Active
-
2023-11-08$140,000 Active
-
2022-08-24soldstatus $495,000
-
2022-07-15soldstatus $335,000
-
2021-09-23soldstatus $155,000
-
2021-09-17soldstatus $155,000 Sold
-
2021-09-17soldstatus $155,000 Closed
-
2021-07-25status Pending
-
2021-07-25status Pending
-
2021-07-08$275,000 Active
-
2021-07-08$275,000 Active
-
2021-07-06historical $275,000
-
2021-07-06historical $275,000
-
2019-10-02historical
-
2019-10-02historical
-
2019-07-22price $175,000
-
2019-07-22price $175,000
-
2019-05-01price $199,900
-
2019-05-01price $199,900
-
2019-04-30$295,000 Active
-
2019-04-30$295,000 Active
-
2017-10-30historical
-
2017-10-30historical
-
2017-10-11historical
-
2017-10-11historical
-
2017-08-11$195,000
-
2017-08-11$335,000
-
2017-08-11$335,000
-
2017-08-11$195,000
ⓘ Source: listings_history table (triggers on properties + properties_extension) + one-shot
backfill from property_details.listing_events for pre-trigger history.
Tax reassessment forecast MI · Partial reset (capped growth)
- Current annual tax
- $4,994 · $416/mo
- Projected year-2 tax
- $4,994 · $416/mo
- Expected delta
- $0/yr ($0/mo · 0.0%)
ⓘ Screening estimate from a state-policy table — verify with the county assessor before closing.
Climate risk First Street
- Flood 1/10 Low FEMA zone X (unshaded) · 0% chance over 30 yrs
- Wildfire 1/10 Low
- Heat 3/10 Moderate 7 d/yr ≥97°F today · 15 d/yr by 30 yrs out
- Wind 2/10 Low
- Air quality 4/10 Moderate 6 unhealthy d/yr today · 8 by 30 yrs out
Nearby sold comps map
Loading sold comps map…
Walkable amenities ~0.75 mi
Loading nearby amenities…
Taxation est. · year 1
- Rental income
- $24,015
- − Mortgage interest
- −$7,562
- − Property taxes
- −$4,994
- − Insurance
- −$675
- − Repairs & maintenance
- −$1,921
- − Management
- −$1,921
- − Depreciation
- −$3,927
- Taxable income
- $3,014
- Est. tax owed @ 24.0%
- −$723
- After-tax cash flow
- $4,084/yr
For passive investors: Depreciation is non-cash, so a rental often shows a tax loss while cash-flowing — sheltering income. Rental losses are passive: they offset passive income freely, and up to $25,000/yr can offset ordinary (W-2) income if you actively participate and your MAGI is under $100k (phasing out to $0 by $150k); unused losses carry forward. On sale, claimed depreciation is recaptured at up to 25%, and gains may owe capital-gains tax (a 1031 exchange can defer both). Figures are a year-1 estimate at your 24.0% rate — not tax advice; consult a CPA.
Schools (NCES district)
- District
- Detroit Public Schools Community District
- NCES district ID
- 2601103
- Math proficiency
- 10% ▼ -2.00%
- Reading proficiency
- 24% ▲ 6.00%
- Median HH income
- $25,815
- Composite
- 13.06/100
- National rank
- #9564
- State rank
- #499 of 540 in MI
Livability — Detroit
- Score
- 73/100
- State rank
- #218
- US rank
- #5427
Category grades
Schools grade is shown separately in the Schools card above.
Census & demographics
- Census place
- Detroit, MI
- County
- Wayne County · 1,562,939 people
- City population
- 572,865
- Metro
- Detroit-Warren-Dearborn, MI
- Population (ZIP)
- 5,865
- Household income
- $44,335
- Rent vs Own
- Severe rent burden
- 431.0
Population outlook (Wayne County) Hauer SSP2
- Today (2025)
- 1,675,273 people
- By 2030
- 1,620,300 · -3.3%
- By 2040
- 1,502,341 · -10.3%
- By 2050
- 1,384,039 · -17.4%
- By 2075
- 1,124,592 · -32.9%
- By 2100
- 881,193 · -47.4%
Race, ethnicity, and origin ACS 2023
- Neighborhood character
- Highly diverse neighborhood (Simpson 0.70)
- Race & ethnicity
- Black 37% White 32% Hispanic / Latino 24% Two or more races 10%
- Hispanic origin (detail)
- Mexican 18% Puerto Rican 2%
- Common ancestry
- Romanian 3% Slovak 2% Lithuanian 1%
- Foreign-born
- 8% · Canada, Jamaica
- Languages at home
- 83% English-only · Spanish 15% Arabic 1%
Political lean MEDSL · Wayne
- 2024 margin
- Strong D (+29.0) · D 62.7% · R 33.7% · Other 3.6%
- 2008→2024 swing
- -20.5pp toward R · 2008: 49.5pp · 2024: 29.0pp
- All cycles
- 2024: D+29.0 2020: D+38.1 2016: D+37.3 2012: D+46.9 2008: D+49.5
Not yet ingested
- Civics
- —
Market trends
- HPI YoY
- ▼ -4.60%
- Current HPI
- 194.458
- Rent YoY
- ▲ 7.30%
- Metro
- Detroit-Warren-Dearborn, MI
- State GDP YoY
- ▲ 1.37%
- F500 in state
- 28
Industry mix (Fortune 500 HQ in MI)
| Industry | F500 HQs | Revenue |
|---|---|---|
| Automotive Parts | 3 | $48B |
|
||
| Automotive | 2 | $372B |
|
||
| Chemicals | 1 | $45B |
|
||
| Automotive Retail | 1 | $29B |
|
||
| Healthcare / Medical Devices | 1 | $23B |
|
||
| Automotive Technology | 1 | $20B |
|
||
Price history
-30.8% since first listed35 events — show timeline
- 2026-03-24 Listed $135,000 REALCOMP
- 2026-03-24 Listed $135,000 MiRealSource-MiMLS
- 2024-01-06 Listing Removed — MiRealSource-MiMLS
- 2024-01-06 Listing Removed — REALCOMP
- 2023-12-05 Price Changed $135,000 MiRealSource-MiMLS
- 2023-12-05 Price Changed $135,000 REALCOMP
- 2023-11-08 Listed $140,000 MiRealSource-MiMLS
- 2023-11-08 Listed $140,000 REALCOMP
- 2022-08-24 Sold (Public Records) $495,000 Public Records
- 2022-07-15 Sold (Public Records) $335,000 Public Records
- 2021-09-23 Sold (Public Records) $155,000 Public Records
- 2021-09-17 Sold (MLS) $155,000 MiRealSource-MiMLS
- 2021-09-17 Sold (MLS) $155,000 REALCOMP
- 2021-07-25 Pending — MiRealSource-MiMLS
- 2021-07-25 Pending — REALCOMP
- 2021-07-08 Listed $275,000 MiRealSource-MiMLS
- 2021-07-08 Listed $275,000 REALCOMP
- 2021-07-06 Coming Soon $275,000 MiRealSource-MiMLS
- 2021-07-06 Coming Soon $275,000 REALCOMP
- 2019-10-02 Listing Removed — REALCOMP
- 2019-10-02 Listing Removed — MiRealSource-MiMLS
- 2019-07-22 Price Changed $175,000 MiRealSource-MiMLS
- 2019-07-22 Price Changed $175,000 REALCOMP
- 2019-05-01 Price Changed $199,900 MiRealSource-MiMLS
- 2019-05-01 Price Changed $199,900 REALCOMP
- 2019-04-30 Listed $295,000 MiRealSource-MiMLS
- 2019-04-30 Listed $295,000 REALCOMP
- 2017-10-30 Listing Removed — REALCOMP
- 2017-10-30 Listing Removed — MiRealSource-MiMLS
- 2017-10-11 Listing Removed — MiRealSource-MiMLS
- 2017-10-11 Listing Removed — REALCOMP
- 2017-08-11 Listed $195,000 MiRealSource-MiMLS
- 2017-08-11 Listed $335,000 REALCOMP
- 2017-08-11 Listed $335,000 MiRealSource-MiMLS
- 2017-08-11 Listed $195,000 REALCOMP
Property tax history
+17.7%/yrLatest (2025): $4,994 · +12.9% YoY. Source: county tax records.
Cash-flow waterfall
monthlySold comps — $/sqft
last 12 mo · ≤1 miLoading sold comps…