376 Broadway Unit 3F · New York, NY
Flood risk 1/10 · Minimal
- FEMA flood zone
- X (unshaded)
- Chance of flooding over 30 yrs
- 0.0%
- Est. flood insurance / yr
- $507 – $1,088
Fire risk 1/10 · Minimal
- Est. fire insurance / yr
- $691 – $1,283
Heat risk 7/10 · Major
- Hot days now (above 99°F)
- 7 days/yr
- Hot days in 30 yrs
- 15 days/yr
Wind risk 6/10 · Moderate
- Chance of severe wind over 30 yrs
- 27.0%
Air-quality risk 4/10 · Minor
- Unhealthy air days now
- 5 days/yr
- Unhealthy air days in 30 yrs
- 7 days/yr
Risk factors via First Street. Map © Google.
Why this score? — see what drove the D+ grade
The composite is a weighted blend of 9 inputs, each scored 0–100. Each bar is that input's sub-score; the figure is the points it added to the 100-point composite (weight × sub-score).
- Appreciation +10.0/10.0
- Cash flow +8.3/30.0
- ARV discount +7.5/15.0
- Schools +5.0/10.0
- Rent growth +4.9/5.0
- Livability +3.8/5.0
- 1% rule +3.4/10.0
- Condition / age +2.5/5.0
- DSCR +2.3/10.0
$1,050,000
🖨 Deal sheet 📄 Offer letter ✓ Due diligence
Listing remarks MLS
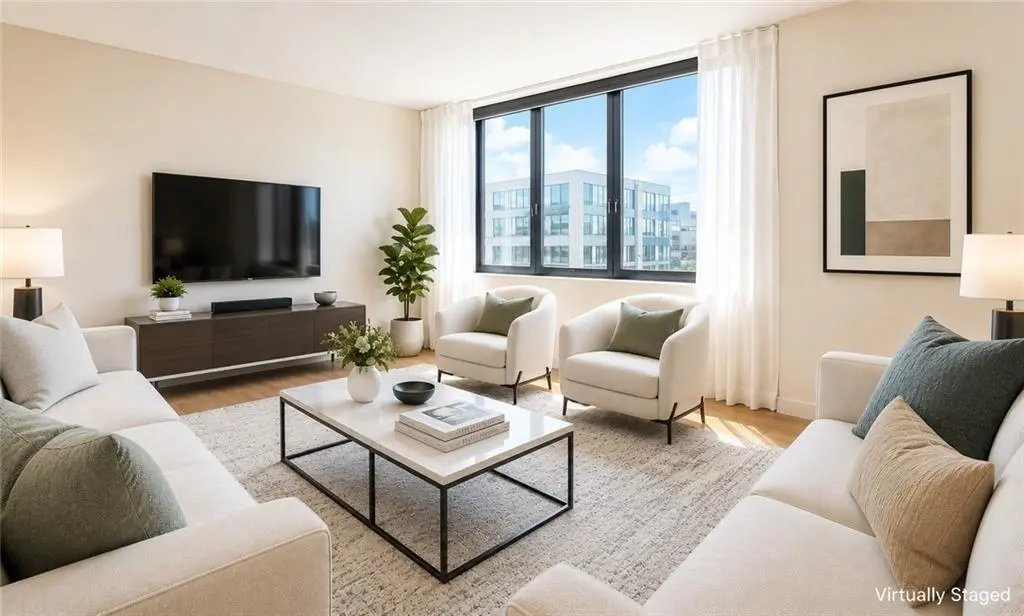
376 Broadway #3F, New York, NY 10013Welcome to this spacious and sun-filled true 2-bedroom, 1.5-bathroom residence offering approximately 820 square feet of comfortable living space in the heart of Tribeca. The thoughtfully designed layout features a generously sized living room, ideal for both entertaining and everyday living. The corner bedroom enjoys multiple exposures and abundant natural sunlight, creating a bright and inviting atmosphere throughout the day. Both bedrooms are spacious enough to accommodate king-size beds. Located within the Mandarin Plaza Condominium, this full-service building offers 24-hour doorman service, a live-in superintendent, elevator access, and on-site laundry facilities. With combined monthly common charges and real estate taxes of approximately $1,791 per month, this residence provides an attractive ownership opportunity with competitive carrying costs in Tribeca, one of Manhattan's most desirable residential neighborhoods. Situated in one of Manhattan's most prestigious and sought-after neighborhoods, this residence offers an exceptional opportunity to enjoy the very best of New York City living. Tribeca is renowned for its historic architecture, luxury residences, world-class dining, boutique shopping, acclaimed art galleries, and charming cobblestone streets. Long recognized as one of Manhattan's most affluent residential enclaves, the neighborhood continues to attract discerning homeowners seeking a unique blend of downtown energy and neighborhood charm. Residents enjoy close proximity to Hudson River Park, SoHo, the Financial District, and some of New York City's most celebrated restaurants and cultural destinations. Commuting is effortless with convenient access to the 1, 2, 3, 6, A, C, E, J, M, Z, N, Q, R, and W subway lines. Apartment FeaturesTrue 2 Bedrooms1 Full Bathroom + 1 Half BathroomApproximately 820 SFDishwasherExcellent Natural LightBedrooms Accommodate King-Size BedsNo PetsNo SmokingBuilding Features24-Hour DoormanLive-In SuperintendentElevator BuildingLaundry RoomFull-Service CondominiumBedroom DimensionsCorner Bedroom: 15'11" x 9'7"Primary Bedroom: 10'2" x 13'9"Monthly Carrying CostsCommon Charges: $988.87Real Estate Taxes: $802.07Don't miss this opportunity to own a spacious two-bedroom home in one of Manhattan's most coveted neighborhoods. Sold as is condition. For additional information or to schedule a private showing, please call or text for immediate response.
Key facts
- Sun-filled residence
- Corner bedroom
- Multiple exposures
Tags
Property features AI
Finance
- Other: Building contains 164 units
- Financial info: Financing options: exchange considered, bank mortgage, or cash; Typical down payment: 20%
- HOA & community: Monthly maintenance common fee of $989; Managed by Bethel Mgmt
Exterior
- Security: Secure lobby; Full-time doorman
- Utilities: Heat included; Water included
- Home design: Residential unit on the 25th floor
- Exterior features: Located in a detached building; Secure lobby; Full-time doorman; Non-resident superintendent; Storage rooms
Interior
- Kitchen: Stove; Refrigerator; Dishwasher
- Bedrooms: Two bedrooms on the first floor
- Bathrooms: One full bathroom on the first floor; One half bathroom on the first floor
- Heating & cooling: A/C units (3)
- Interior features: Central A/C with three units; Dishwasher; Elevator access; Laundry area; Refrigerator; Stove
- Laundry & utility: On-site laundry area
Neighborhood map
What this means for you Summary
Snapshot
- This is a 2-bed/1.5-bath condo listed at $1.05M.
Deal economics
- At list price, monthly cash flow is $-958 ($-11k/yr) — negative.
- The deal already cash-flows at list — no discount required.
- To meet the 1% rule (rent ≥ 1% of price), the offer needs to be $881k (16.1% below list).
- Recommended offer: $881k (16.1% below list) — sets the bar for 1% rule.
- Cap rate 5.2% vs local median 2.6% in New York — top-decile yield for the area; either an underpriced asset or a hidden risk that comps aren't pricing in. Stress-test before assuming the spread holds.
Location & tenants
- Location reads 75/100 on livability (#268 in NY, #4,188 nationally) — a middle-class / working-renter tenant base. Strengths: amenities A+, commute A+, health & safety A; Watch: crime F, cost of living F.
- Market conditions: Rents rising fast (+9.4%/yr); 225 active listings in the ZIP; 40 comparable units currently listed for rent nearby; rentals leasing fast (median 8d on market — plan ~1-2 weeks tenant-placement turnaround); high-income renter base; 4,467 units permitted in New York County in 2024 (4,463 in 5+ unit buildings).
- At $8,806/mo this rent would consume 66% of the median local household income ($161k/yr) (locally 2000% of renters already pay >50% of income on rent) — very limited rent-growth headroom before tenants either downsize or default.
Forward outlook
- In year one you build about $112k of equity ($7k loan paydown + $105k appreciation (10.0% local appreciation)).
- New York County population projected at +21% by 2050 — long-run rental-demand tailwind backs the buy-and-hold thesis.
- By year 2, paydown + projected appreciation supports a ~$180k cash-out refi (75% LTV) — recoverable capital for the next deal without selling this one.
Negotiation context
- It's been on market 20 days — a 2% lower offer ($1.03M) is reasonable based on typical stale-listing flexibility.
- 2 sale attempts with the ask held roughly flat each time — persistent listings suggest the price (not the market) is what's stuck; bring a comps-based counter.
Risks & watch-outs
- Climate carrying-cost: major wind risk, 27% chance of damaging wind over 30y; extreme-heat days projected 7→15/yr by 2055 (HVAC capex compounding) — expect insurance premiums to compound above CPI over the hold.
Questions for the listing agent
- What do current leases actually rent for vs. the listed asking? Can we see a recent rent roll and the last 12 months of T-12 income?
- What does the HOA fee cover, when was the last increase, and are there any pending special assessments or reserve-fund shortfalls?
- Any open or pending special assessments — roof, HVAC, plumbing, elevator, façade? What's the per-unit balance and payoff schedule, and is the seller paying it off at close or rolling it to the buyer?
- Is there a deadline driving the sale (1031 exchange, divorce, estate, relocation)? That informs how much negotiation room exists.
- Schools are B-rated — typically a magnet for longer-tenancy family renters. What's the average tenant stay here, and is there a school-zone premium baked into asking?
- Crime grade is F in this area — have there been break-ins, vandalism, or insurance claims at this property in the last 3 years? What carrier currently insures it and at what premium?
- The area grade is low — what's the realistic commute time and amenity access for the typical tenant pool here? Any planned neighborhood developments (good or bad) we should know about?
- What's the average days-on-market for RENTAL listings here right now (not sales)? A rising rental-DOM trend means longer vacancies and softer asking-rent achievability than the comps imply.
- What's the recent tenant-quality profile in this submarket — average credit score on applications, eviction rate, late-payment / NSF rate, and stable-employment percentage? A property-management company in the area should have these aggregated.
- How much new apartment / multifamily construction is in the pipeline within 1–3 miles? Heavy new supply (>2% of stock underway) typically softens rents 12–24 months out; light construction supports rent growth.
Investment metrics
- 1% rule
- 0.84% ✗
- Cap rate
- 5.20%
- Cash-on-cash
- -3.91%
- DSCR
- 0.83
- GRM
- 9.9
CMA / ARV
No comps found within radius.
Projected returns pro-forma
10.0% appreciation · 8.0% rent growth · sell at horizon
- IRR
- 23.2%
- Equity multiple
- 2.90×
- Total profit
- $557,939
- Equity at exit
- $945,923
- IRR
- 22.1%
- Equity multiple
- 7.15×
- Total profit
- $1,807,363
- Equity at exit
- $2,039,919
Cash invested: $294,000 (down + closing). Projections, not guarantees.
Landlord ↔ Tenant lean methodology
- Overall (CITY)
- 0 Strongly Tenant-Friendly
- State New York
- 15 Strongly Tenant-Friendly · D+10
- County
- — inherits STATE
- City New York
- 0 Strongly Tenant-Friendly · D+34
ZIP-level market 10013
- Home prices YoY
- 4.4%
- Rents YoY
- 9.4%
- Active inventory
- 225
- Price-to-rent
- 9.9×
Monthly cashflow live
- Estimated rent
- $8,806 high interval (Pro) →
- Mortgage (P&I)
- −$5,506
- Tax from tax record
- −$983 /mo · $11,792/yr
- Insurance
- −$438
- HOA est. from 2 same-building comps
- −$988
- Vacancy / Maint / Mgmt
- −$1,849
- Net cashflow
- $-958
Break-even live
UW: 25.0% down · 7.5% · 30yr · 1.5% tax · 5.0% vac · 8.0% maint · 8.0% mgmt
Financing live
Cash to close
- Down payment
- $262,500
- Closing costs
- $31,500
- Reserves months
- —
- Total cash needed
- —
Loan-product check · same deal, 3 products live
Conventional
25% down · 7.5% · 30yr
- Down + closing
- —
- Monthly P&I
- —
- Monthly cashflow
- —
- DSCR
- —
- Eligible?
- —
Personal DTI + credit; lowest rate.
DSCR
20% down · 8.5% · 30yr
- Down + closing
- —
- Monthly P&I
- —
- Monthly cashflow
- —
- DSCR
- —
- Eligible?
- —
No personal income docs; deal must DSCR.
Hard money
10% down · 12.0% · 12mo
- Down + closing
- —
- Monthly P&I
- —
- Monthly cashflow
- —
- DSCR
- —
- Eligible?
- —
Short-term bridge; refi at stabilization.
Rent comps 40 comps
| Address | Beds | Baths | Sqft | Rent | $/sqft | DOM | Units | Dist |
|---|---|---|---|---|---|---|---|---|
| 88 Leonard St New York, NY | 1.0 | 1.0 | 598 | $7,966 | $13.32 | 7d | 13 | 0.11mi |
| 111 Worth St New York, NY | 1.0–2.0 | 1.0–2.0 | 747 | $8,238 | $11.03 | 7d | 7 | 0.14mi |
| 105 Duane St #183 New York, NY | 2.0 | 1.0–2.0 | 821 | $11,410 | $13.89 | 1d | 3 | 0.22mi |
| 120 Mulberry St Unit 1257050P New York, NY | 2.0 | 1.0 | 645 | $12,372 | $19.18 | 24d | 1 | 0.27mi |
| 8 Spruce St Unit 31S New York, NY | 3.0 | 2.0 | 1100 | $8,000 | $7.27 | 7d | 1 | 0.50mi |
| 400 Chambers St #587 New York, NY | 2.0 | 1.0–1.5 | 675 | $8,810 | $13.04 | 7d | 3 | 0.63mi |
| 229 Chrystie St New York, NY | 1.0–2.0 | 1.0–2.0 | 810 | $10,485 | $12.94 | 4d | 3 | 0.71mi |
| 140 Broadway Unit 1298277P New York, NY | 1.0 | 1.0 | 699 | $9,406 | $13.46 | 22d | 1 | 0.73mi |
| 11 E 1st St New York, NY | 2.0 | 1.0–2.0 | 1060 | $11,225 | $10.59 | 1d | 1 | 0.74mi |
| 211 Front St Unit 1255364P New York, NY | 1.0 | 1.0 | 990 | $11,206 | $11.32 | 24d | 1 | 0.75mi |
| 180 Water St #537 New York, NY | 1.0–2.0 | 1.0–2.0 | 728 | $9,400 | $12.91 | 2d | 2 | 0.77mi |
| 10 Downing St #131 New York, NY | 1.0 | 1.0 | 731 | $9,050 | $12.38 | 4d | 2 | 0.77mi |
| 125 Delancey St #1523 New York, NY | 1.0–2.0 | 1.0–2.0 | 850 | $9,670 | $11.38 | 1d | 2 | 0.79mi |
| 252 South St Unit 74B New York, NY | 2.0 | 2.0 | 1034 | $8,995 | $8.70 | 17d | 1 | 0.79mi |
| 389 S End Ave New York, NY | 3.0 | 1.0–2.0 | 1080 | $9,014 | $8.34 | 1d | 36 | 0.87mi |
| 180 Broome St #1521 New York, NY | 1.0–2.0 | 1.0–2.0 | 850 | $10,630 | $12.51 | 1d | 2 | 0.88mi |
| 67 Wall St #13 New York, NY | 1.0–2.0 | 1.0 | 636 | $7,380 | $11.59 | 2d | 2 | 0.91mi |
| 75 Wall St Unit 251 New York, NY | 1.0 | 1.5 | 653 | $6,580 | $10.08 | 24d | 1 | 0.92mi |
| 95 Wall St New York, NY | 2.0 | 1.0–2.0 | 733 | $7,998 | $10.91 | 1d | 39 | 0.95mi |
| 15 William St New York, NY | 1.0–2.0 | 1.0–2.0 | 822 | $6,550 | $7.96 | 7d | 10 | 0.95mi |
| 171 Suffolk St #1265 New York, NY | 1.0–2.0 | 1.0 | 650 | $8,710 | $13.40 | 7d | 2 | 0.97mi |
| 3 Hanover Sq New York, NY | 3.0 | 1.0–2.0 | 600 | $6,072 | $10.12 | 24d | 5 | 0.97mi |
| 52 Barrow St #2123 New York, NY | 1.0–2.0 | 1.0 | 547 | $15,116 | $27.61 | 10d | 3 | 0.97mi |
| 10 Hanover Sq New York, NY | 2.0 | 1.0–2.0 | 790 | $8,086 | $10.24 | 2d | 25 | 0.97mi |
| 120 Christopher St #1886 New York, NY | 1.0–2.0 | 1.0 | 574 | $10,018 | $17.44 | 1d | 3 | 1.05mi |
| 10 5th Ave Unit 1255906P New York, NY | 2.0 | 1.0 | 990 | $18,150 | $18.33 | 5d | 2 | 1.06mi |
| 10 Sheridan Sq #949 New York, NY | 2.0 | 2.0 | 1000 | $12,050 | $12.05 | 20d | 1 | 1.06mi |
| 139 Christopher St Unit 1021914P New York, NY | 1.0–2.0 | 1.0 | 667 | $8,160 | $12.23 | 7d | 2 | 1.06mi |
| 30 West St Unit 3004 New York, NY | 3.0 | 2.0 | 700 | $8,000 | $11.43 | 7d | 1 | 1.09mi |
| 3 E 9th St Unit 1541442P New York, NY | 1.0–2.0 | 1.0 | 1119 | $15,690 | $14.02 | 5d | 2 | 1.10mi |
| 1 West St #546 New York, NY | 1.0 | 1.0 | 700 | $5,770 | $8.24 | 20d | 1 | 1.11mi |
| 140 Charles St Unit 14A New York, NY | 1.0 | 1.0 | 648 | $8,000 | $12.35 | 7d | 1 | 1.13mi |
| 401 West St Unit 5A New York, NY | 1.0 | 2.0 | 811 | $39,500 | $48.71 | 22d | 1 | 1.14mi |
| 112 E 10th St Unit 1021937P New York, NY | 1.0–3.0 | 1.0–2.5 | 1296 | $13,688 | $10.56 | 3d | 2 | 1.14mi |
| 535 Hudson St #1032 New York, NY | 1.0–2.0 | 1.0 | 550 | $8,160 | $14.84 | 7d | 2 | 1.16mi |
| 101 E 10th St #1153 New York, NY | 1.0–2.0 | 1.0–2.0 | 575 | $16,510 | $28.71 | 1d | 2 | 1.16mi |
| 166 2nd Ave Unit 9KK New York, NY | 2.0 | 1.5 | 950 | $8,100 | $8.53 | 7d | 1 | 1.20mi |
| 87 Perry St New York, NY | 2.0 | 2.0 | 748 | $18,500 | $24.73 | 24d | 1 | 1.21mi |
| 302 W 11th St #990 New York, NY | 2.0–3.0 | 1.0–2.0 | 1050 | $8,360 | $7.96 | 3d | 2 | 1.23mi |
| 1 Union Sq S #1174 New York, NY | 2.0 | 1.0–2.0 | 775 | $13,210 | $17.05 | 10d | 3 | 1.31mi |
HOA detail condo
- Monthly dues
- $0 · $0/yr
- Likely covers
- doorman
- Assessments
- None detected in remarks — confirm with the listing agent.
Listing history 13 events
-
2026-06-18days on market $1,050,000 Active 20 DOM
-
2026-06-17days on market $1,050,000 Active 19 DOM
-
2026-06-16days on market $1,050,000 Active 18 DOM
-
2026-06-15days on market $1,050,000 Active 17 DOM
-
2026-06-13days on market $1,050,000 Active 15 DOM
-
2026-06-09days on market $1,050,000 Active 11 DOM
-
2026-06-08days on market $1,050,000 Active 10 DOM
-
2026-06-08days on market $1,050,000 Active 9 DOM
-
2026-06-04days on market $1,050,000 Active 6 DOM
-
2026-06-03days on market $1,050,000 Active 5 DOM
-
2026-06-02days on market $1,050,000 Active 4 DOM
-
2026-06-01days on market $1,050,000 Active 3 DOM
-
2026-05-31days on market $1,050,000 Active 2 DOM
ⓘ Source: listings_history table (triggers on properties + properties_extension) + one-shot
backfill from property_details.listing_events for pre-trigger history.
Tax reassessment forecast NY · Partial reset (capped growth)
- Current annual tax
- $11,792 · $983/mo
- Projected year-2 tax
- $14,768 · $1,231/mo
- Expected delta
- +$2,977/yr (+$248/mo · 25.2%)
ⓘ Screening estimate from a state-policy table — verify with the county assessor before closing.
Climate risk First Street
- Flood 1/10 Low FEMA zone X (unshaded) · 0% chance over 30 yrs
- Wildfire 1/10 Low
- Heat 7/10 Severe 7 d/yr ≥99°F today · 15 d/yr by 30 yrs out
- Wind 6/10 Major 27% chance of damaging wind over 30 yrs
- Air quality 4/10 Moderate 5 unhealthy d/yr today · 7 by 30 yrs out
Nearby sold comps map
Loading sold comps map…
Walkable amenities ~0.75 mi
Loading nearby amenities…
Taxation est. · year 1
- Rental income
- $105,673
- − Mortgage interest
- −$58,816
- − Property taxes
- −$11,792
- − Insurance
- −$5,250
- − Repairs & maintenance
- −$8,454
- − Management
- −$8,454
- − HOA
- −$11,856
- − Depreciation
- −$30,545
- Taxable loss
- −$29,494
- Est. tax savings @ 24.0%
- +$7,079
- After-tax cash flow
- $-4,413/yr
For passive investors: Depreciation is non-cash, so a rental often shows a tax loss while cash-flowing — sheltering income. Rental losses are passive: they offset passive income freely, and up to $25,000/yr can offset ordinary (W-2) income if you actively participate and your MAGI is under $100k (phasing out to $0 by $150k); unused losses carry forward. On sale, claimed depreciation is recaptured at up to 25%, and gains may owe capital-gains tax (a 1031 exchange can defer both). Figures are a year-1 estimate at your 24.0% rate — not tax advice; consult a CPA.
Schools (NCES district)
No district data.
Livability — New York
- Score
- 75/100
- State rank
- #268
- US rank
- #4188
Category grades
Schools grade is shown separately in the Schools card above.
Census & demographics
- Census place
- New York, NY
- County
- New York County · 1,599,927 people
- City population
- 7,731,280
- Metro
- New York-Newark-Jersey City, NY-NJ-PA
- Population (ZIP)
- 27,219
- Household income
- $161,154
- Rent vs Own
- Severe rent burden
- 2000.0
Population outlook (New York County) Hauer SSP2
- Today (2025)
- 1,825,725 people
- By 2030
- 1,904,611 · +4.3%
- By 2040
- 2,052,719 · +12.4%
- By 2050
- 2,206,601 · +20.9%
- By 2075
- 2,509,427 · +37.4%
- By 2100
- 2,702,933 · +48.0%
Race, ethnicity, and origin ACS 2023
- Neighborhood character
- Diverse neighborhood (Simpson 0.62)
- Race & ethnicity
- White 53% Asian 31% Hispanic / Latino 8% Two or more races 7% Black 3%
- Hispanic origin (detail)
- Mexican 1%
- Common ancestry
- Scotch-Irish 4% Romanian 3% Scandinavian 3%
- Foreign-born
- 31% · China, Canada, South Korea
- Languages at home
- 65% English-only · Chinese 19% Other Indo-European 7% Spanish 3%
Political lean MEDSL · New York
- 2024 margin
- Solid D (+64.8) · D 82.4% · R 17.6%
- 2008→2024 swing
- -7.4pp toward R · 2008: 72.2pp · 2024: 64.8pp
- All cycles
- 2024: D+64.8 2020: D+74.5 2016: D+77.2 2012: D+69.6 2008: D+72.2
Not yet ingested
- Civics
- —
Market trends
- HPI YoY
- ▲ 10.12%
- Current HPI
- 239.8397
- Rent YoY
- ▲ 9.40%
- Metro
- New York-Newark-Jersey City, NY-NJ-PA
- State GDP YoY
- ▲ 2.60%
- F500 in state
- 92
Industry mix (Fortune 500 HQ in NY)
| Industry | F500 HQs | Revenue |
|---|---|---|
| Financial Services | 10 | $950B |
|
||
| Consumer Goods | 9 | $162B |
|
||
| Insurance | 4 | $225B |
|
||
| Telecommunications | 2 | $144B |
|
||
| Pharmaceuticals | 2 | $112B |
|
||
| Media / Entertainment | 2 | $69B |
|
||
Price history
+273.7% since first listed5 events — show timeline
- 2026-05-29 Listed $1,050,000 BNYMLS
- 2026-05-29 Listed $1,050,000 RLS at REBNY
- 2025-07-31 Sold (Public Records) $939,900 Public Records
- 2013-08-28 Sold (Public Records) $835,000 Public Records
- 1990-10-15 Sold (Public Records) $281,000 Public Records
Property tax history
+2.9%/yrLatest (2025): $11,792 · +0.2% YoY. Source: county tax records.
Cash-flow waterfall
monthlySold comps — $/sqft
last 12 mo · ≤1 miLoading sold comps…