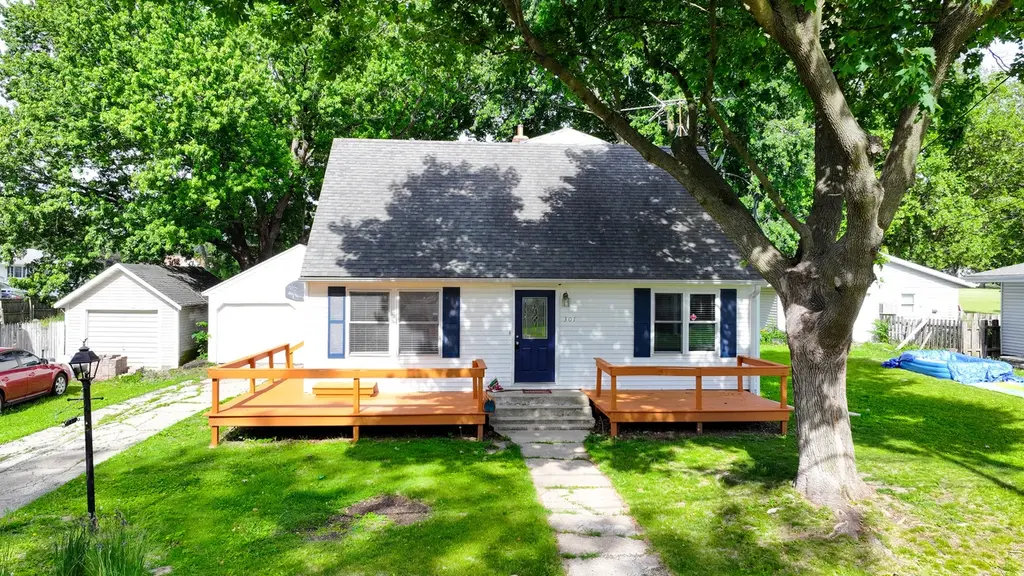
301 Ash Ave · Morrison, IL
Flood risk 1/10 · Minimal
- FEMA flood zone
- X (unshaded)
- Chance of flooding over 30 yrs
- 0.0%
- Est. flood insurance / yr
- $473 – $860
Fire risk 1/10 · Minimal
- Est. fire insurance / yr
- $804 – $1,492
Heat risk 3/10 · Minor
- Hot days now (above 104°F)
- 7 days/yr
- Hot days in 30 yrs
- 16 days/yr
Wind risk 2/10 · Minimal
- Chance of severe wind over 30 yrs
- —
Air-quality risk 3/10 · Minor
- Unhealthy air days now
- 2 days/yr
- Unhealthy air days in 30 yrs
- 3 days/yr
Risk factors via First Street. Map © Google.
Why this score? — see what drove the D- grade
The composite is a weighted blend of 9 inputs, each scored 0–100. Each bar is that input's sub-score; the figure is the points it added to the 100-point composite (weight × sub-score).
- Cash flow +13.4/30.0
- ARV discount +6.6/15.0
- DSCR +4.0/10.0
- Livability +4.0/5.0
- 1% rule +3.5/10.0
- Rent growth +2.5/5.0
- Condition / age +2.5/5.0
- Schools +2.3/10.0
- Appreciation +0.0/10.0
$152,900
🖨 Deal sheet (PDF) 📄 Offer letter ✓ Due diligence
Listing remarks MLS
Opportunity! This home was rehabbed in 2003 - 2006. It is a spacious family home on a 60' x 153' lot. The main floor offers 1 bedroom, 1/2 bath and laundry besides living and family room areas. Upstairs are 3 bedrooms and a full bath. Off the rear deck is a small pond. Lots of back yard space. There is a newer a/c unit. Carpeting was new in 2020. Quick possession is available on this one.
Key facts
- Fresh flooring
- Brand new appliances
- Convenient dog run
Tags
Property features AI
Finance
- HOA & community: No master association fees required
Exterior
- Utilities: Public water; Public sewer
- Home design: Detached single-family home; 1.5-story design; Entry on main level
- Construction: Built 21–25 years ago; Vinyl siding; Asphalt roof; Block foundation
- Exterior features: Level lot; Less than 1/4 acre
Interior
- Kitchen: Range; Refrigerator
- Bedrooms: 4 bedrooms (master on main level; three additional bedrooms on second level)
- Flooring: Luxury vinyl flooring in main living areas (living room, family room, kitchen, dining, laundry); Carpet in bedrooms
- Bathrooms: 1 full bathroom; 1 half bathroom
- Heating & cooling: Natural gas heating; Central air conditioning
- Interior features: Partially finished full basement; Total of 9 rooms
- Laundry & utility: Washer; Dryer; Main-level laundry room
Neighborhood map
What this means for you Summary
Snapshot
- This is a 4-bed/1.5-bath single-family listed at $153k.
Deal economics
- At list price, monthly cash flow is $3 ($42/yr) — positive.
- The deal already cash-flows at list — no discount required.
- To meet the 1% rule (rent ≥ 1% of price), the offer needs to be $129k (15.3% below list).
- Recommended offer: $129k (15.3% below list) — sets the bar for 1% rule.
- Cap rate 6.3% vs local median 4.6% in Morrison — top-decile yield for the area; either an underpriced asset or a hidden risk that comps aren't pricing in. Stress-test before assuming the spread holds.
Location & tenants
- Location reads 81/100 on livability (#85 in IL, #1,376 nationally) — a professional / high-income tenant draw. Strengths: cost of living A+, housing A+, health & safety A+; Watch: commute F.
- Morrison CUSD 6 (town): math 22% / reading 31% proficiency, ranked #292 of 620 in IL (top 47%) — low school quality limits family demand, transient renter base, plan for 1-2y turnover.
- Zoned schools: Northside School (252 students, 0% FRL); Morrison Jr High School (math 21% / reading 27%, grade F, #364 of 665 statewide, top 56%, 220 students, 0% FRL); Morrison High School (math 22% / reading 32%, grade F, #218 of 693 statewide, top 35%, 296 students, 0% FRL) — zoned schools average 0% FRL vs 32% district-wide (32 pts lower); this property's tenant base skews higher-income than the district average.
- Market conditions: 36 active listings in the ZIP; 19 units permitted in Whiteside County in 2024 (0 in 5+ unit buildings).
Forward outlook
- Local home prices are declining (-3.0%/yr); year-one equity from $1k of loan paydown is wiped out by about $5k of value loss. Plan a longer hold.
- Whiteside County population projected at -21% by 2050 — secular population decline; favor cash flow + early exit over multi-decade hold.
Negotiation context
- Only 4 days on market — expect competitive offers; lowballing is unlikely to land.
- 2 sale attempts with the ask held roughly flat each time — persistent listings suggest the price (not the market) is what's stuck; bring a comps-based counter.
- Current owner paid $87k; list at $153k implies a 76% gain — meaningful room to come down on a strong offer.
Questions for the listing agent
- Is there a deadline driving the sale (1031 exchange, divorce, estate, relocation)? That informs how much negotiation room exists.
- The area grade is low — what's the realistic commute time and amenity access for the typical tenant pool here? Any planned neighborhood developments (good or bad) we should know about?
- What's the average days-on-market for RENTAL listings here right now (not sales)? A rising rental-DOM trend means longer vacancies and softer asking-rent achievability than the comps imply.
- What's the recent tenant-quality profile in this submarket — average credit score on applications, eviction rate, late-payment / NSF rate, and stable-employment percentage? A property-management company in the area should have these aggregated.
- How much new for-sale + rental construction is in the pipeline within 1–3 miles? Heavy new supply typically softens prices + rents 12–24 months out; constrained supply supports both.
Investment metrics
- 1% rule
- 0.85% ✗
- Cap rate
- 6.32%
- Cash-on-cash
- 0.10%
- DSCR
- 1.00
- GRM
- 9.8
CMA / ARV
- ARV (on-the-fly)
- $149,760
- Comps found
- 9
Show comp detail 9 sales within ~0.75 mi
| Address | Dist | Beds/Ba | Sqft | Sold | Price | $/sf | Match |
|---|---|---|---|---|---|---|---|
| 301 Ash Ave | 0.00mi | 4/1.5 | 2,368 (+3%) | 9mo | $87,000 | $37 | 88 |
| 201 E Morris St | 0.25mi | 4/2.0 | 2,192 (-5%) | 9mo | $115,000 | $52 | 71 |
| 401 Ash Ave | 0.06mi | 5/2.0 (+1) | 2,484 (+8%) | 10mo | $125,000 | $50 | 69 |
| 630 Genesee Ave | 0.44mi | 4/2.0 | 2,300 (-0%) | 14mo | $195,000 | $85 | 66 |
| 406 S Genesee St | 0.33mi | 4/1.5 | 2,044 (-11%) | 3mo | $99,000 | $48 | 63 |
| 507 E Lincolnway Rd | 0.24mi | 4/2.0 | 2,480 (+8%) | 14mo | $160,000 | $65 | 63 |
| 602 S Jackson St | 0.29mi | 3/2.5 (-1) | 2,023 (-12%) | 11mo | $199,000 | $98 | 48 |
| 503 W Winfield St | 0.67mi | 3/2.0 (-1) | 2,100 (-9%) | 5mo | $157,000 | $75 | 43 |
| 108 Prospect St | 0.68mi | 3/3.0 (-1) | 2,250 (-2%) | 14mo | $227,000 | $101 | 42 |
Match score weights: distance 35% · size 25% · config 20% · recency 20%. Top-matched comps best support the ARV.
Projected returns pro-forma
-3.0% appreciation · 3.0% rent growth · sell at horizon
- IRR
- -16.2%
- Equity multiple
- 0.43×
- Total profit
- $-24,558
- Equity at exit
- $22,798
- IRR
- -7.8%
- Equity multiple
- 0.51×
- Total profit
- $-21,113
- Equity at exit
- $13,220
Cash invested: $42,812 (down + closing). Projections, not guarantees.
Landlord ↔ Tenant lean methodology
- Overall (STATE)
- 43 Moderately Tenant-Leaning
- State Illinois
- 43 Moderately Tenant-Leaning · D+7
- County
- — inherits STATE
- City
- — inherits STATE
ZIP-level market 61270
- Home prices YoY
- -22.4%
- Active inventory
- 36
- Price-to-rent
- 9.8×
Monthly cashflow live
- Estimated rent
- $1,295 medium interval (Pro) →
- Mortgage (P&I)
- −$802
- Tax from tax record
- −$154 /mo · $1,847/yr
- Insurance
- −$64
- HOA
- −$0
- Lot rent
- −$0
- Vacancy / Maint / Mgmt
- −$272
- Net cashflow
- $3
Break-even live
Sensitivity live
| Price | -10% $90 | -5% $47 | +0% $3 | +5% $-40 | +10% $-83 |
|---|---|---|---|---|---|
| Rent | -10% $-99 | -5% $-48 | +0% $3 | +5% $55 | +10% $106 |
| Rate | -1.0pp $80 | -0.5pp $42 | base $3 | +0.5pp $-36 | +1.0pp $-76 |
UW: 25.0% down · 7.5% · 30yr · 1.5% tax · 5.0% vac · 8.0% maint · 8.0% mgmt
Financing live
Cash to close
- Down payment
- $38,225
- Closing costs
- $4,587
- Reserves months
- —
- Total cash needed
- —
Loan-product check · same deal, 3 products live
Conventional
25% down · 7.5% · 30yr
- Down + closing
- —
- Monthly P&I
- —
- Monthly cashflow
- —
- DSCR
- —
- Eligible?
- —
Personal DTI + credit; lowest rate.
DSCR
20% down · 8.5% · 30yr
- Down + closing
- —
- Monthly P&I
- —
- Monthly cashflow
- —
- DSCR
- —
- Eligible?
- —
No personal income docs; deal must DSCR.
Hard money
10% down · 12.0% · 12mo
- Down + closing
- —
- Monthly P&I
- —
- Monthly cashflow
- —
- DSCR
- —
- Eligible?
- —
Short-term bridge; refi at stabilization.
Listing history 5 events
-
2026-06-04statusdays on market $152,900 Pending 4 DOM
-
2026-06-02days on market $152,900 Active 3 DOM
-
2026-06-01days on market $152,900 Active 2 DOM
-
2026-05-31remarks 699-char remark
-
2026-05-31$152,900 Active 1 DOM
ⓘ Source: listings_history table (triggers on properties + properties_extension) + one-shot
backfill from property_details.listing_events for pre-trigger history.
Tax reassessment forecast IL · Partial reset (capped growth)
- Current annual tax
- $1,847 · $154/mo
- Projected year-2 tax
- $2,659 · $222/mo
- Expected delta
- +$812/yr (+$68/mo · 44.0%)
ⓘ Screening estimate from a state-policy table — verify with the county assessor before closing.
Climate risk First Street
- Flood 1/10 Low FEMA zone X (unshaded) · 0% chance over 30 yrs
- Wildfire 1/10 Low
- Heat 3/10 Moderate 7 d/yr ≥104°F today · 16 d/yr by 30 yrs out
- Wind 2/10 Low
- Air quality 3/10 Moderate 2 unhealthy d/yr today · 3 by 30 yrs out
Nearby sold comps map
Loading sold comps map…
Walkable amenities ~0.75 mi
Loading nearby amenities…
Taxation est. · year 1
- Rental income
- $15,538
- − Mortgage interest
- −$8,565
- − Property taxes
- −$1,847
- − Insurance
- −$764
- − Repairs & maintenance
- −$1,243
- − Management
- −$1,243
- − Depreciation
- −$4,448
- Taxable loss
- −$2,572
- Est. tax savings @ 24.0%
- +$617
- After-tax cash flow
- $659/yr
For passive investors: Depreciation is non-cash, so a rental often shows a tax loss while cash-flowing — sheltering income. Rental losses are passive: they offset passive income freely, and up to $25,000/yr can offset ordinary (W-2) income if you actively participate and your MAGI is under $100k (phasing out to $0 by $150k); unused losses carry forward. On sale, claimed depreciation is recaptured at up to 25%, and gains may owe capital-gains tax (a 1031 exchange can defer both). Figures are a year-1 estimate at your 24.0% rate — not tax advice; consult a CPA.
Schools (NCES district)
- District
- Morrison CUSD 6
- NCES district ID
- 1726710
- Math proficiency
- 22% ▼ -10.00%
- Reading proficiency
- 31% ▼ -12.00%
- Median HH income
- $51,562
- Composite
- 23.42/100
- National rank
- #7889
- State rank
- #292 of 620 in IL
Livability — Morrison
- Score
- 81/100
- State rank
- #85
- US rank
- #1376
Category grades
Schools grade is shown separately in the Schools card above.
Census & demographics
- Census place
- Morrison, IL
- Population (ZIP)
- 7,067
Population outlook (Whiteside County) Hauer SSP2
- Today (2025)
- 53,736 people
- By 2030
- 51,657 · -3.9%
- By 2040
- 47,169 · -12.2%
- By 2050
- 42,613 · -20.7%
- By 2075
- 32,691 · -39.2%
- By 2100
- 22,638 · -57.9%
Race, ethnicity, and origin ACS 2023
- Neighborhood character
- Predominantly White (92%)
- Race & ethnicity
- White 92% Two or more races 4% Hispanic / Latino 4% Black 1%
- Common ancestry
- Iranian 14% Lithuanian 4% Slovak 2%
- Foreign-born
- 2% · Canada
- Languages at home
- 96% English-only · Spanish 1%
Political lean MEDSL · Whiteside
- 2024 margin
- R (+14.7) · D 41.7% · R 56.4% · Other 2.0%
- 2008→2024 swing
- -32.3pp toward R · 2008: 17.6pp · 2024: -14.7pp
- All cycles
- 2024: R+14.7 2020: R+8.3 2016: R+6.3 2012: D+17.3 2008: D+17.6
Not yet ingested
- Civics
- —
Market trends
- HPI YoY
- ▼ -42.25%
- Current HPI
- 146.0419
- Rent YoY
- —
- Metro
- —
- State GDP YoY
- ▲ 1.59%
- F500 in state
- 60
Industry mix (Fortune 500 HQ in IL)
| Industry | F500 HQs | Revenue |
|---|---|---|
| Insurance | 4 | $201B |
|
||
| Consumer Goods | 4 | $87B |
|
||
| Industrial Machinery | 3 | $64B |
|
||
| Healthcare | 2 | $55B |
|
||
| Retail / Pharmacy | 1 | $148B |
|
||
| Agriculture / Food | 1 | $86B |
|
||
Price history
+39.0% since first listed5 events — show timeline
- 2026-05-30 Listed $152,900 MRED as Distributed by MLS Grid
- 2025-09-19 Sold (MLS) $87,000 MRED as Distributed by MLS Grid
- 2025-09-02 Contingent — MRED as Distributed by MLS Grid
- 2025-08-25 Listed $89,900 MRED as Distributed by MLS Grid
- 2006-11-22 Sold (Public Records) $110,000 Public Records
Property tax history
-4.0%/yrLatest (2024): $1,847 · +10.2% YoY. Source: county tax records.
Cash-flow waterfall
monthlySold comps — $/sqft
last 12 mo · ≤1 miLoading sold comps…