 24-Plex
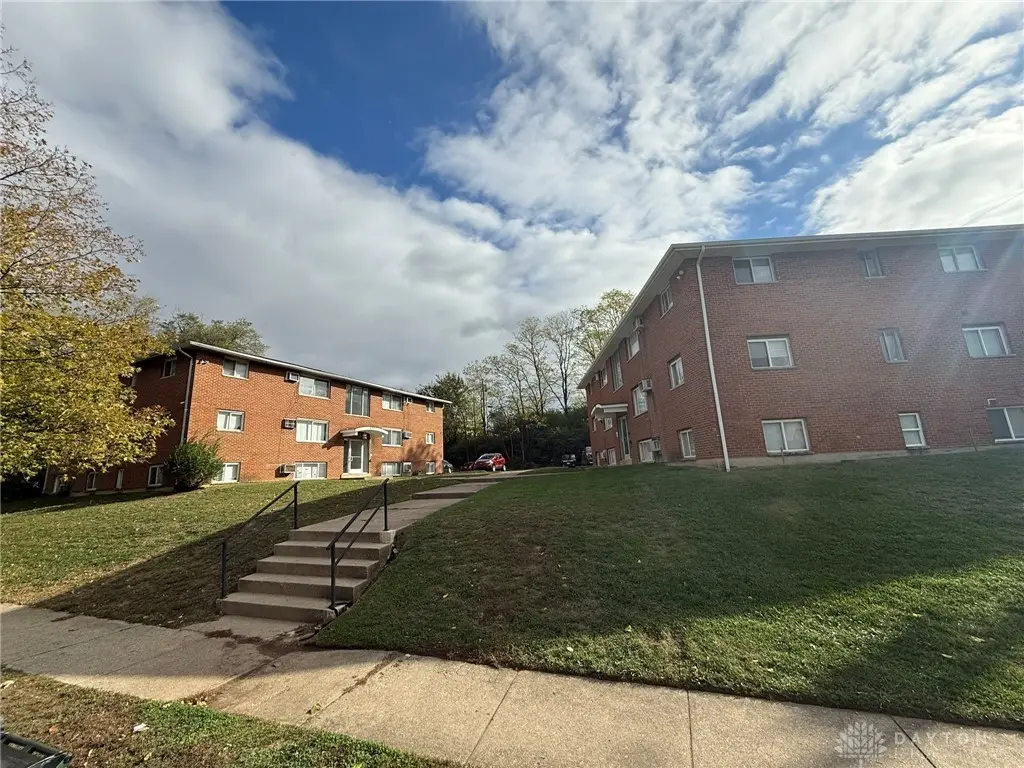
410 N Cherrywood Ave · Dayton, OH
Flood risk 1/10 · Minimal
- FEMA flood zone
- X (unshaded)
- Chance of flooding over 30 yrs
- 0.0%
- Est. flood insurance / yr
- $473 – $860
Fire risk 1/10 · Minimal
- Est. fire insurance / yr
- $713 – $1,323
Heat risk 4/10 · Minor
- Hot days now (above 101°F)
- 7 days/yr
- Hot days in 30 yrs
- 18 days/yr
Wind risk 2/10 · Minimal
- Chance of severe wind over 30 yrs
- 0.0%
Air-quality risk 4/10 · Minor
- Unhealthy air days now
- 4 days/yr
- Unhealthy air days in 30 yrs
- 5 days/yr
Risk factors via First Street. Map © Google.
Why this score? — see what drove the B- grade
The composite is a weighted blend of 9 inputs, each scored 0–100. Each bar is that input's sub-score; the figure is the points it added to the 100-point composite (weight × sub-score).
- Cash flow +30.0/30.0
- 1% rule +10.0/10.0
- DSCR +10.0/10.0
- ARV discount +7.5/15.0
- Rent growth +3.4/5.0
- Livability +3.2/5.0
- Condition / age +2.5/5.0
- Schools +1.3/10.0
- Appreciation +0.0/10.0
$1,479,900
🖨 Deal sheet 📄 Offer letter ✓ Due diligence
Multi-family units
County records classify this as Multi-Family (5+ Unit). Listing-text estimate: 24 units. confirmed
5+ unit building — per-unit beds/baths from public records are typically unavailable; the breakdown below (if shown) is an estimate from the listing text.
Listing remarks MLS
Discover an exceptional investment opportunity in the heart of Dayton with this impressive 24-unit multifamily property featuring both 410 & 420 Cherrywood Ave. Tucked away in a private, well-maintained setting, these two buildings surround a beautifully kept shared courtyard and spacious parking area, creating an attractive environment for tenants and owners alike. Residents enjoy desirable amenities including on-site laundry, added security features, and convenient access to major highways, shopping, dining, and downtown Dayton. With strong rental appeal and income potential from day one, this turnkey property is an outstanding opportunity for investors looking to expand their portfolio with a stable, income-producing asset.
Key facts
- On site laundry
- Shared courtyard
- Shopping
Tags
Neighborhood map
What this means for you Summary
Snapshot
- This is a 24 × 34-bed/24.0-bath units multifamily listed at $1.48M.
Deal economics
- At list price, monthly cash flow is $14k ($163k/yr) — positive. Per door: $567/mo.
- The deal already cash-flows at list — no discount required.
- Meets the 1% rule at list price ($29k rent vs $1.48M).
- Recommended offer: $1.44M (3.0% below list) — sets the bar for market timing.
- Cap rate 17.3% vs local median 7.4% in Dayton — top-decile yield for the area; either an underpriced asset or a hidden risk that comps aren't pricing in. Stress-test before assuming the spread holds.
Location & tenants
- Location reads 65/100 on livability (#716 in OH) — a middle-class / working-renter tenant base. Strengths: cost of living A+, housing A+, health & safety A; Watch: schools C-, amenities C-, crime F.
- Dayton City (urban): math 12% / reading 21% proficiency, ranked #641 of 656 in OH (top 98%) — low school quality limits family demand, transient renter base, plan for 1-2y turnover; 74% free/reduced lunch — lower-income household profile, screen leases tightly.
- Market conditions: Rents rising (+3.7%/yr); 77 active listings in the ZIP; lower-income renter base — watch delinquency; 907 units permitted in Montgomery County in 2024 (416 in 5+ unit buildings).
- At $28,731/mo this rent would consume 900% of the median local household income ($38k/yr) (locally 1071% of renters already pay >50% of income on rent) — very limited rent-growth headroom before tenants either downsize or default.
Forward outlook
- Local home prices are declining (-3.0%/yr); year-one equity from $10k of loan paydown is wiped out by about $44k of value loss. Plan a longer hold.
- Montgomery County population projected at -10% by 2050 — secular population decline; favor cash flow + early exit over multi-decade hold.
- At projected returns (-3.0% appreciation + 3.7% rent growth), your $414k cash investment doubles in ~3 years — after that, you're playing with house money.
Negotiation context
- It's been on market 42 days — a 3% lower offer ($1.44M) is reasonable based on typical stale-listing flexibility.
- 7 sale attempts since 15y ago with the ask held roughly flat each time — persistent listings suggest the price (not the market) is what's stuck; bring a comps-based counter.
- Current owner paid $565k; list at $1.48M implies a 162% gain — meaningful room to come down on a strong offer.
Questions for the listing agent
- It's been on market 42 days. Have you received any prior offers? Is the seller open to a 3% concession, seller financing, or rate buy-down credit?
- Can we see the unit-by-unit rent roll, current vacancy, and any below-market leases? What's the average tenancy length?
- What capital expenditures (roof, boiler, parking lot, exteriors) have been made in the last 5 years, and what's planned in the next 2?
- Built in 1968 — when were the roof, HVAC, electrical panel, plumbing, and water heater last replaced?
- Is there a deadline driving the sale (1031 exchange, divorce, estate, relocation)? That informs how much negotiation room exists.
- Crime grade is F in this area — have there been break-ins, vandalism, or insurance claims at this property in the last 3 years? What carrier currently insures it and at what premium?
- What's the average days-on-market for RENTAL listings here right now (not sales)? A rising rental-DOM trend means longer vacancies and softer asking-rent achievability than the comps imply.
- What's the recent tenant-quality profile in this submarket — average credit score on applications, eviction rate, late-payment / NSF rate, and stable-employment percentage? A property-management company in the area should have these aggregated.
- How much new apartment / multifamily construction is in the pipeline within 1–3 miles? Heavy new supply (>2% of stock underway) typically softens rents 12–24 months out; light construction supports rent growth.
Investment metrics
- 1% rule
- 1.94% ✓
- Cap rate
- 17.33%
- Cash-on-cash
- 39.41%
- DSCR
- 2.75
- GRM
- 4.3
CMA / ARV
- ARV (median comp)
- $431,764
- List price
- $1,479,900
- Delta
- 242.76%
- Verdict
- OVERPRICED
- Comps
- 8 within 1.0 mi
Projected returns pro-forma
-3.0% appreciation · 3.71% rent growth · sell at horizon
- IRR
- 36.4%
- Equity multiple
- 2.56×
- Total profit
- $647,403
- Equity at exit
- $220,658
- IRR
- 43.4%
- Equity multiple
- 5.26×
- Total profit
- $1,764,867
- Equity at exit
- $127,955
Cash invested: $414,372 (down + closing). Projections, not guarantees.
Landlord ↔ Tenant lean methodology
- Overall (STATE)
- 73 Landlord-Friendly
- State Ohio
- 73 Landlord-Friendly · R+6
- County
- — inherits STATE
- City
- — inherits STATE
ZIP-level market 45403
- Home prices YoY
- -3.7%
- Rents YoY
- 3.7%
- Active inventory
- 77
- Price-to-rent
- 103.0×
Monthly cashflow live
- Estimated rent
- $28,731 medium interval (Pro) →
- Mortgage (P&I)
- −$7,761
- Tax from tax record
- −$710 /mo · $8,525/yr
- Insurance
- −$617
- HOA
- −$0
- Vacancy / Maint / Mgmt
- −$6,034
- Net cashflow
- $13,610
Break-even live
24-unit breakdown (identical units grouped — click to expand)
| Units | Beds | Baths | Est. rent |
|---|---|---|---|
| 24× units | 34 | 24 | $28,728 |
| #1 | 34 | 24 | $1,197 |
| #2 | 34 | 24 | $1,197 |
| #3 | 34 | 24 | $1,197 |
| #4 | 34 | 24 | $1,197 |
| #5 | 34 | 24 | $1,197 |
| #6 | 34 | 24 | $1,197 |
| #7 | 34 | 24 | $1,197 |
| #8 | 34 | 24 | $1,197 |
| #9 | 34 | 24 | $1,197 |
| #10 | 34 | 24 | $1,197 |
| #11 | 34 | 24 | $1,197 |
| #12 | 34 | 24 | $1,197 |
| #13 | 34 | 24 | $1,197 |
| #14 | 34 | 24 | $1,197 |
| #15 | 34 | 24 | $1,197 |
| #16 | 34 | 24 | $1,197 |
| #17 | 34 | 24 | $1,197 |
| #18 | 34 | 24 | $1,197 |
| #19 | 34 | 24 | $1,197 |
| #20 | 34 | 24 | $1,197 |
| #21 | 34 | 24 | $1,197 |
| #22 | 34 | 24 | $1,197 |
| #23 | 34 | 24 | $1,197 |
| #24 | 34 | 24 | $1,197 |
| Total (24 units) | $28,731 | ||
UW: 25.0% down · 7.5% · 30yr · 1.5% tax · 5.0% vac · 8.0% maint · 8.0% mgmt
Financing live
Cash to close
- Down payment
- $369,975
- Closing costs
- $44,397
- Reserves months
- —
- Total cash needed
- —
Loan-product check · same deal, 3 products live
Conventional
25% down · 7.5% · 30yr
- Down + closing
- —
- Monthly P&I
- —
- Monthly cashflow
- —
- DSCR
- —
- Eligible?
- —
Personal DTI + credit; lowest rate.
DSCR
20% down · 8.5% · 30yr
- Down + closing
- —
- Monthly P&I
- —
- Monthly cashflow
- —
- DSCR
- —
- Eligible?
- —
No personal income docs; deal must DSCR.
Hard money
10% down · 12.0% · 12mo
- Down + closing
- —
- Monthly P&I
- —
- Monthly cashflow
- —
- DSCR
- —
- Eligible?
- —
Short-term bridge; refi at stabilization.
Listing history 37 events
-
2026-06-18days on market $1,479,900 Active 42 DOM
-
2026-06-17days on market $1,479,900 Active 41 DOM
-
2026-06-16days on market $1,479,900 Active 40 DOM
-
2026-06-15days on market $1,479,900 Active 39 DOM
-
2026-06-14days on market $1,479,900 Active 37 DOM
-
2026-06-13days on market $1,479,900 Active 36 DOM
-
2026-06-10days on market $1,479,900 Active 34 DOM
-
2026-06-09days on market $1,479,900 Active 33 DOM
-
2026-06-08days on market $1,479,900 Active 32 DOM
-
2026-06-07days on market $1,479,900 Active 31 DOM
-
2026-06-05days on market $1,479,900 Active 28 DOM
-
2026-06-03days on market $1,479,900 Active 27 DOM
-
2026-06-02days on market $1,479,900 Active 26 DOM
-
2026-06-01days on market $1,479,900 Active 25 DOM
-
2026-05-31days on market $1,479,900 Active 24 DOM
-
2026-05-07$1,479,900 Active 742-char remark
Show marketing remark (742 chars)
Discover an exceptional investment opportunity in the heart of Dayton with this impressive 24-unit multifamily property featuring both 410 & 420 Cherrywood Ave. Tucked away in a private, well-maintained setting, these two buildings surround a beautifully kept shared courtyard and spacious parking area, creating an attractive environment for tenants and owners alike. Residents enjoy desirable amenities including on-site laundry, added security features, and convenient access to major highways, shopping, dining, and downtown Dayton. With strong rental appeal and income potential from day one, this turnkey property is an outstanding opportunity for investors looking to expand their portfolio with a stable, income-producing asset.
-
2026-03-31historical
-
2025-10-21$1,680,000 Active
-
2024-06-04soldstatus $565,000
-
2024-05-15historical
-
2024-05-14soldstatus $560,000 Closed
-
2024-05-14soldstatus $560,000 Sold
-
2024-05-14$560,000
-
2018-10-29historical
-
2018-09-26status Active
-
2018-09-18historical Active/Pending
-
2018-09-12status Active
-
2018-09-10historical Active/Pending
-
2018-08-24$352,000 Active
-
2017-03-10soldstatus $160,000
-
2013-11-20soldstatus $150,000
-
2012-09-19historical
-
2011-07-14$199,000
-
2007-07-06soldstatus $169,200
-
2007-07-06soldstatus $220,000
-
1996-05-17soldstatus $221,000
-
1991-07-02soldstatus $225,000
ⓘ Source: listings_history table (triggers on properties + properties_extension) + one-shot
backfill from property_details.listing_events for pre-trigger history.
Tax reassessment forecast OH · Partial reset (capped growth)
- Current annual tax
- $8,525 · $710/mo
- Projected year-2 tax
- $15,806 · $1,317/mo
- Expected delta
- +$7,281/yr (+$607/mo · 85.4%)
ⓘ Screening estimate from a state-policy table — verify with the county assessor before closing.
Climate risk First Street
- Flood 1/10 Low FEMA zone X (unshaded) · 0% chance over 30 yrs
- Wildfire 1/10 Low
- Heat 4/10 Moderate 7 d/yr ≥101°F today · 18 d/yr by 30 yrs out
- Wind 2/10 Low 0% chance of damaging wind over 30 yrs
- Air quality 4/10 Moderate 4 unhealthy d/yr today · 5 by 30 yrs out
Nearby sold comps map
Loading sold comps map…
Walkable amenities ~0.75 mi
Loading nearby amenities…
Taxation est. · year 1
- Rental income
- $344,772
- − Mortgage interest
- −$82,897
- − Property taxes
- −$8,525
- − Insurance
- −$7,400
- − Repairs & maintenance
- −$27,582
- − Management
- −$27,582
- − Depreciation
- −$43,052
- Taxable income
- $147,735
- Est. tax owed @ 24.0%
- −$35,456
- After-tax cash flow
- $127,860/yr
For passive investors: Depreciation is non-cash, so a rental often shows a tax loss while cash-flowing — sheltering income. Rental losses are passive: they offset passive income freely, and up to $25,000/yr can offset ordinary (W-2) income if you actively participate and your MAGI is under $100k (phasing out to $0 by $150k); unused losses carry forward. On sale, claimed depreciation is recaptured at up to 25%, and gains may owe capital-gains tax (a 1031 exchange can defer both). Figures are a year-1 estimate at your 24.0% rate — not tax advice; consult a CPA.
Schools (NCES district)
- District
- Dayton City
- NCES district ID
- 3904384
- Math proficiency
- 12% ▼ -12.00%
- Reading proficiency
- 21% ▼ -11.00%
- Median HH income
- $28,688
- Composite
- 12.94/100
- National rank
- #9579
- State rank
- #641 of 656 in OH
Livability — Dayton
- Score
- 65/100
- State rank
- #716
- US rank
- #12895
Category grades
Schools grade is shown separately in the Schools card above.
Census & demographics
- Census place
- Dayton, OH
- County
- Montgomery County · 459,541 people
- City population
- 164,387
- Metro
- Dayton-Kettering, OH
- Population (ZIP)
- 13,608
- Household income
- $38,323
- Rent vs Own
- Severe rent burden
- 1071.0
Population outlook (Montgomery County) Hauer SSP2
- Today (2025)
- 523,241 people
- By 2030
- 514,948 · -1.6%
- By 2040
- 493,378 · -5.7%
- By 2050
- 469,639 · -10.2%
- By 2075
- 418,360 · -20.0%
- By 2100
- 353,315 · -32.5%
Race, ethnicity, and origin ACS 2023
- Neighborhood character
- Predominantly White (66%)
- Race & ethnicity
- White 66% Hispanic / Latino 15% Black 14% Two or more races 8% Native American 1%
- Hispanic origin (detail)
- Mexican 7%
- Common ancestry
- Lithuanian 2% Slovak 1% Italian 1%
- Foreign-born
- 9% · Canada
- Languages at home
- 84% English-only · Spanish 13% Other Asian/Pacific 1%
Political lean MEDSL · Montgomery
- 2024 margin
- Toss-up / Even · D 49.8% · R 49.3%
- 2008→2024 swing
- -5.8pp toward R · 2008: 6.2pp · 2024: 0.5pp
- All cycles
- 2024: D+0.5 2020: D+2.2 2016: R+1.2 2012: D+3.1 2008: D+6.2
Not yet ingested
- Civics
- —
Market trends
- HPI YoY
- ▼ -17.40%
- Current HPI
- 447.4034
- Rent YoY
- ▲ 3.71%
- Metro
- Dayton-Kettering, OH
- State GDP YoY
- ▲ 1.98%
- F500 in state
- 48
Industry mix (Fortune 500 HQ in OH)
| Industry | F500 HQs | Revenue |
|---|---|---|
| Insurance | 3 | $145B |
|
||
| Industrial Machinery | 3 | $49B |
|
||
| Financial Services | 3 | $24B |
|
||
| Consumer Goods | 2 | $93B |
|
||
| Aerospace / Defense | 2 | $47B |
|
||
| Utilities | 2 | $33B |
|
||
Price history
+557.7% since first listed22 events — show timeline
- 2026-05-07 Listed $1,479,900 Dayton MLS
- 2026-03-31 Listing Removed — Dayton MLS
- 2025-10-21 Listed $1,680,000 Dayton MLS
- 2024-06-04 Sold (Public Records) $565,000 Public Records
- 2024-05-15 Listing Removed — Dayton MLS
- 2024-05-14 Listed $560,000 Dayton MLS
- 2024-05-14 Sold (MLS) $560,000 Dayton MLS
- 2024-05-14 Sold (MLS) $560,000 Dayton MLS
- 2018-10-29 Listing Removed — Dayton MLS
- 2018-09-26 Relisted — Dayton MLS
- 2018-09-18 Contingent — Dayton MLS
- 2018-09-12 Relisted — Dayton MLS
- 2018-09-10 Contingent — Dayton MLS
- 2018-08-24 Listed $352,000 Dayton MLS
- 2017-03-10 Sold (Public Records) $160,000 Public Records
- 2013-11-20 Sold (Public Records) $150,000 Public Records
- 2012-09-19 Listing Removed — Dayton MLS
- 2011-07-14 Listed $199,000 Dayton MLS
- 2007-07-06 Sold (Public Records) $220,000 Public Records
- 2007-07-06 Sold (Public Records) $169,200 Public Records
- 1996-05-17 Sold (Public Records) $221,000 Public Records
- 1991-07-02 Sold (Public Records) $225,000 Public Records
Property tax history
-3.7%/yrLatest (2025): $8,525 · -1.0% YoY. Source: county tax records.
Cash-flow waterfall
monthlySold comps — $/sqft
last 12 mo · ≤1 miLoading sold comps…