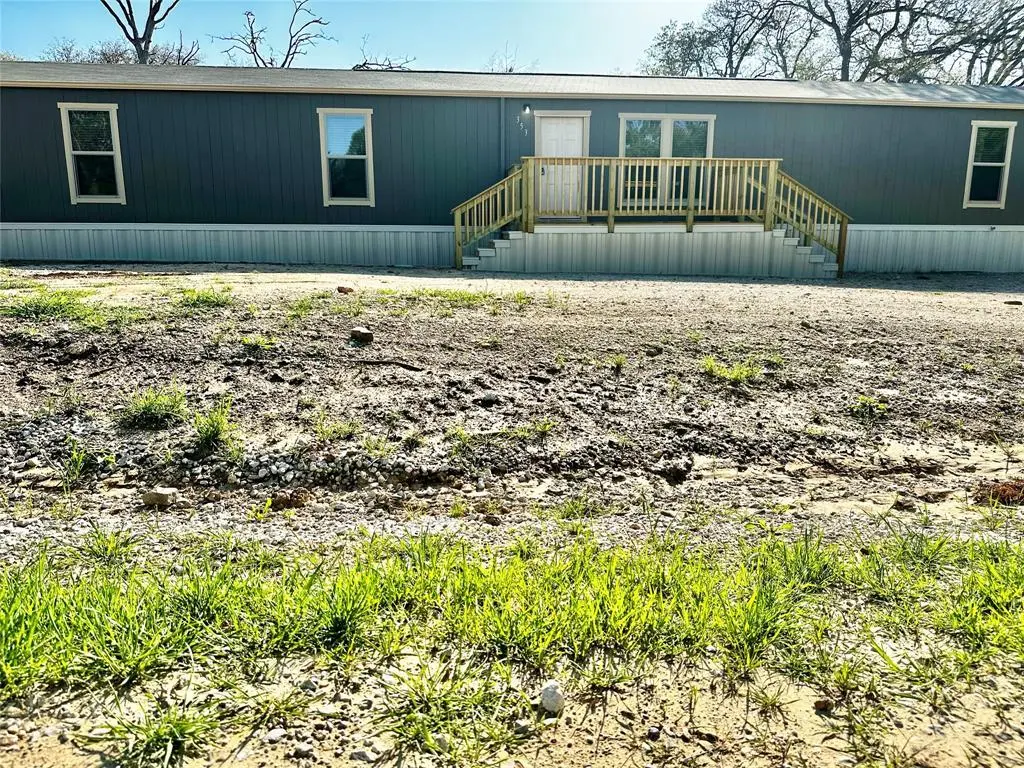
353 Conastoga Rd · Road Runner, TX
Flood risk 8/10 · Major
- FEMA flood zone
- X (unshaded)
- Chance of flooding over 30 yrs
- 0.99%
- Est. flood insurance / yr
- $507 – $1,088
Fire risk 7/10 · Major
- Est. fire insurance / yr
- $1,222 – $2,270
Heat risk 6/10 · Moderate
- Hot days now (above 110°F)
- 7 days/yr
- Hot days in 30 yrs
- 21 days/yr
Wind risk 4/10 · Minor
- Chance of severe wind over 30 yrs
- 16.0%
Air-quality risk 3/10 · Minor
- Unhealthy air days now
- 3 days/yr
- Unhealthy air days in 30 yrs
- 4 days/yr
Risk factors via First Street. Map © Google.
Why this score? — see what drove the C grade
The composite is a weighted blend of 9 inputs, each scored 0–100. Each bar is that input's sub-score; the figure is the points it added to the 100-point composite (weight × sub-score).
- Cash flow +18.6/30.0
- Appreciation +10.0/10.0
- ARV discount +7.5/15.0
- DSCR +5.9/10.0
- 1% rule +3.9/10.0
- Schools +3.7/10.0
- Rent growth +2.5/5.0
- Livability +2.5/5.0
- Condition / age +2.5/5.0
$193,000
🖨 Deal sheet (PDF) 📄 Offer letter ✓ Due diligence
Listing remarks MLS
Discover a unique investment opportunity in Valley View! This 2025 mobile home sits on a spacious 0.45-acre lot just outside city limits, offering both privacy and flexibility with fewer restrictions. Featuring 5 bedrooms and 5 bathrooms, this property is suited for income producing potential. It is currently operating as a successful investment property, with each room rented individually on month-to-month leases, generating approximately $2,600 in monthly income. Whether you’re looking to expand your rental portfolio or transition into a multi-use living space, this property offers immediate cash flow and long-term potential. With ample outdoor space and a modern layout, the possibilities here are endless. Don’t miss your chance to own a turnkey investment in a growing area!
Key facts
- Spacious lot
- Turnkey investment
- 0.45 acre lot
Tags
Neighborhood map
What this means for you Summary
Snapshot
- This is a 5-bed/5.0-bath single-family listed at $193k.
Deal economics
- At list price, monthly cash flow is $122 ($1k/yr) — positive.
- The deal already cash-flows at list — no discount required.
- To meet the 1% rule (rent ≥ 1% of price), the offer needs to be $173k (10.6% below list).
- Recommended offer: $173k (10.6% below list) — sets the bar for 1% rule.
Location & tenants
- Location reads: area grade C — affects rentability + tenant quality, not the cash-flow math above.
- Pilot Point ISD (town): math 41% / reading 43% proficiency, ranked #303 of 826 in TX (top 37%) — families likely to look elsewhere, expect single-tenant / working-renter base with shorter leases.
- Zoned schools: Pilot Point El (math 44% / reading 41%, grade F, #1,313 of 4,322 statewide, top 31%, 516 students, 56% FRL); Pilot Point Selz Middle (math 37% / reading 42%, grade F, #660 of 1,662 statewide, top 41%, 330 students, 59% FRL); Pilot Point H S (math 42% / reading 52%, grade D-, #591 of 1,632 statewide, top 38%, 452 students, 39% FRL) — zoned schools at 52% FRL track the district average.
- Market conditions: 151 active listings in the ZIP; 190 units permitted in Cooke County in 2024 (0 in 5+ unit buildings).
Forward outlook
- In year one you build about $21k of equity ($1k loan paydown + $19k appreciation (10.0% local appreciation)).
- At projected returns (10.0% appreciation + 3.0% rent growth), your $54k cash investment doubles in ~3 years — after that, you're playing with house money.
- By year 2, paydown + projected appreciation supports a ~$33k cash-out refi (75% LTV) — recoverable capital for the next deal without selling this one.
Negotiation context
- It's been on market 73 days — a 6% lower offer ($181k) is reasonable based on typical stale-listing flexibility.
Risks & watch-outs
- Watch-outs: flood insurance adds $66/mo.
- Climate carrying-cost: severe flood risk; major wildfire risk; extreme-heat days projected 7→21/yr by 2055 (HVAC capex compounding) — expect insurance premiums to compound above CPI over the hold.
Questions for the listing agent
- It's been on market 73 days. Have you received any prior offers? Is the seller open to a 11% concession, seller financing, or rate buy-down credit?
- What's the actual annual flood-insurance premium (NFIP or private), and is the property in a SFHA with mandatory coverage?
- Why hasn't it sold? Are there any deal-killer items the seller is aware of (foundation, flood, title, zoning, code violations)?
- Is there a deadline driving the sale (1031 exchange, divorce, estate, relocation)? That informs how much negotiation room exists.
- What's the average days-on-market for RENTAL listings here right now (not sales)? A rising rental-DOM trend means longer vacancies and softer asking-rent achievability than the comps imply.
- What's the recent tenant-quality profile in this submarket — average credit score on applications, eviction rate, late-payment / NSF rate, and stable-employment percentage? A property-management company in the area should have these aggregated.
- How much new for-sale + rental construction is in the pipeline within 1–3 miles? Heavy new supply typically softens prices + rents 12–24 months out; constrained supply supports both.
Investment metrics
- 1% rule
- 0.89% ✗
- Cap rate
- 7.47%
- Cash-on-cash
- 4.19%
- DSCR
- 1.19
- GRM
- 9.3
CMA / ARV
No comps found within radius.
Projected returns pro-forma
10.0% appreciation · 3.0% rent growth · sell at horizon
- IRR
- 26.2%
- Equity multiple
- 3.09×
- Total profit
- $112,856
- Equity at exit
- $173,870
- IRR
- 23.0%
- Equity multiple
- 7.04×
- Total profit
- $326,167
- Equity at exit
- $374,957
Cash invested: $54,040 (down + closing). Projections, not guarantees.
Landlord ↔ Tenant lean methodology
- Overall (STATE)
- 87 Strongly Landlord-Friendly
- State Texas
- 87 Strongly Landlord-Friendly · R+5
- County
- — inherits STATE
- City
- — inherits STATE
ZIP-level market 76272
- Home prices YoY
- 7.0%
- Active inventory
- 151
- Price-to-rent
- 9.3×
Monthly cashflow live
- Estimated rent
- $1,725 medium interval (Pro) →
- Mortgage (P&I)
- −$1,012
- Tax from tax record
- −$82 /mo · $981/yr
- Insurance
- −$80
- Flood insurance flood zone
- −$66 /mo · $798/yr
- HOA
- −$0
- Vacancy / Maint / Mgmt
- −$362
- Net cashflow
- $122
Break-even live
Sensitivity live
| Price | -10% $231 | -5% $177 | +0% $122 | +5% $67 | +10% $13 |
|---|---|---|---|---|---|
| Rent | -10% $-14 | -5% $54 | +0% $122 | +5% $190 | +10% $258 |
| Rate | -1.0pp $219 | -0.5pp $171 | base $122 | +0.5pp $72 | +1.0pp $21 |
UW: 25.0% down · 7.5% · 30yr · 1.5% tax · 5.0% vac · 8.0% maint · 8.0% mgmt
Financing live
Cash to close
- Down payment
- $48,250
- Closing costs
- $5,790
- Reserves months
- —
- Total cash needed
- —
Loan-product check · same deal, 3 products live
Conventional
25% down · 7.5% · 30yr
- Down + closing
- —
- Monthly P&I
- —
- Monthly cashflow
- —
- DSCR
- —
- Eligible?
- —
Personal DTI + credit; lowest rate.
DSCR
20% down · 8.5% · 30yr
- Down + closing
- —
- Monthly P&I
- —
- Monthly cashflow
- —
- DSCR
- —
- Eligible?
- —
No personal income docs; deal must DSCR.
Hard money
10% down · 12.0% · 12mo
- Down + closing
- —
- Monthly P&I
- —
- Monthly cashflow
- —
- DSCR
- —
- Eligible?
- —
Short-term bridge; refi at stabilization.
Listing history 22 events
-
2026-06-21days on market $193,000 Active 73 DOM
-
2026-06-18days on market $193,000 Active 70 DOM
-
2026-06-17days on market $193,000 Active 69 DOM
-
2026-06-15days on market $193,000 Active 67 DOM
-
2026-06-13days on market $193,000 Active 65 DOM
-
2026-06-13days on market $193,000 Active 64 DOM
-
2026-06-09days on market $193,000 Active 61 DOM
-
2026-06-08days on market $193,000 Active 60 DOM
-
2026-06-07days on market $193,000 Active 59 DOM
-
2026-06-04days on market $193,000 Active 56 DOM
-
2026-06-03days on market $193,000 Active 55 DOM
-
2026-06-02days on market $193,000 Active 54 DOM
-
2026-06-01days on market $193,000 Active 53 DOM
-
2026-05-31days on market $193,000 Active 52 DOM
-
2026-04-30price $193,000 808-char remark
Show marketing remark (808 chars)
Discover a unique investment opportunity in Valley View! This 2025 mobile home sits on a spacious 0.45-acre lot just outside city limits, offering both privacy and flexibility with fewer restrictions. Featuring 5 bedrooms and 5 bathrooms, this property is suited for income producing potential. It is currently operating as a successful investment property, with each room rented individually on month-to-month leases, generating approximately $2,600 in monthly income. Whether you’re looking to expand your rental portfolio or transition into a multi-use living space, this property offers immediate cash flow and long-term potential. With ample outdoor space and a modern layout, the possibilities here are endless. Don’t miss your chance to own a turnkey investment in a growing area!
-
2026-04-09$200,000 Active 808-char remark
Show marketing remark (808 chars)
Discover a unique investment opportunity in Valley View! This 2025 mobile home sits on a spacious 0.45-acre lot just outside city limits, offering both privacy and flexibility with fewer restrictions. Featuring 5 bedrooms and 5 bathrooms, this property is suited for income producing potential. It is currently operating as a successful investment property, with each room rented individually on month-to-month leases, generating approximately $2,600 in monthly income. Whether you’re looking to expand your rental portfolio or transition into a multi-use living space, this property offers immediate cash flow and long-term potential. With ample outdoor space and a modern layout, the possibilities here are endless. Don’t miss your chance to own a turnkey investment in a growing area!
-
2026-01-09soldstatus
-
2024-10-10soldstatus
-
2013-03-14soldstatus
-
2012-07-26soldstatus
-
2008-06-27soldstatus
-
2005-11-30soldstatus
ⓘ Source: listings_history table (triggers on properties + properties_extension) + one-shot
backfill from property_details.listing_events for pre-trigger history.
Tax reassessment forecast TX · Resets to sale price
- Current annual tax
- $981 · $82/mo
- Projected year-2 tax
- $3,532 · $294/mo
- Expected delta
- +$2,551/yr (+$213/mo · 260.1%)
ⓘ Screening estimate from a state-policy table — verify with the county assessor before closing.
Climate risk First Street
- Flood 8/10 Severe FEMA zone X (unshaded) · 99% chance over 30 yrs
- Wildfire 7/10 Severe
- Heat 6/10 Major 7 d/yr ≥110°F today · 21 d/yr by 30 yrs out
- Wind 4/10 Moderate 16% chance of damaging wind over 30 yrs
- Air quality 3/10 Moderate 3 unhealthy d/yr today · 4 by 30 yrs out
Nearby sold comps map
Loading sold comps map…
Walkable amenities ~0.75 mi
Loading nearby amenities…
Taxation est. · year 1
- Rental income
- $20,700
- − Mortgage interest
- −$10,811
- − Property taxes
- −$981
- − Insurance
- −$1,762
- − Repairs & maintenance
- −$1,656
- − Management
- −$1,656
- − Depreciation
- −$5,615
- Taxable loss
- −$1,780
- Est. tax savings @ 24.0%
- +$427
- After-tax cash flow
- $1,892/yr
For passive investors: Depreciation is non-cash, so a rental often shows a tax loss while cash-flowing — sheltering income. Rental losses are passive: they offset passive income freely, and up to $25,000/yr can offset ordinary (W-2) income if you actively participate and your MAGI is under $100k (phasing out to $0 by $150k); unused losses carry forward. On sale, claimed depreciation is recaptured at up to 25%, and gains may owe capital-gains tax (a 1031 exchange can defer both). Figures are a year-1 estimate at your 24.0% rate — not tax advice; consult a CPA.
Schools (NCES district)
- District
- Pilot Point ISD
- NCES district ID
- 4834920
- Math proficiency
- 41% ▼ -3.00%
- Reading proficiency
- 43% ▼ -3.00%
- Median HH income
- $57,332
- Composite
- 36.85/100
- National rank
- #4555
- State rank
- #303 of 826 in TX
Livability — Road Runner
No livability data for this city. (Only ~50 U.S. cities are tracked.)
Census & demographics
- Census place
- Road Runner, TX
- Population (ZIP)
- 4,947
Population outlook (Cooke County) Hauer SSP2
- Today (2025)
- 39,965 people
- By 2030
- 39,974 · +0.0%
- By 2040
- 39,772 · -0.5%
- By 2050
- 39,258 · -1.8%
- By 2075
- 37,262 · -6.8%
- By 2100
- 33,363 · -16.5%
Race, ethnicity, and origin ACS 2023
- Neighborhood character
- Predominantly White (74%)
- Race & ethnicity
- White 74% Hispanic / Latino 24% Two or more races 17%
- Hispanic origin (detail)
- Mexican 22%
- Common ancestry
- Slovak 3% Italian 2% Serbian 2%
- Foreign-born
- 9% · Canada
- Languages at home
- 81% English-only · Spanish 18% Russian/Polish/Slavic 1%
Political lean MEDSL · Cooke
- 2024 margin
- Solid R (+66.9) · D 16.2% · R 83.1%
- 2008→2024 swing
- -8.2pp toward R · 2008: -58.7pp · 2024: -66.9pp
- All cycles
- 2024: R+66.9 2020: R+65.2 2016: R+68.1 2012: R+67.6 2008: R+58.7
Not yet ingested
- Civics
- —
Market trends
- HPI YoY
- ▲ 21.32%
- Current HPI
- 326.29
- Rent YoY
- —
- Metro
- —
- State GDP YoY
- ▲ 3.95%
- F500 in state
- 110
Industry mix (Fortune 500 HQ in TX)
| Industry | F500 HQs | Revenue |
|---|---|---|
| Energy | 16 | $1,198B |
|
||
| Technology | 5 | $198B |
|
||
| Engineering / Construction | 4 | $72B |
|
||
| Energy Services | 3 | $60B |
|
||
| Utilities | 3 | $41B |
|
||
| Healthcare | 2 | $330B |
|
||
Price history
-3.5% since first listed8 events — show timeline
- 2026-04-30 Price Changed $193,000 NTREIS
- 2026-04-09 Listed $200,000 NTREIS
- 2026-01-09 Sold (Public Records) — Public Records
- 2024-10-10 Sold (Public Records) — Public Records
- 2013-03-14 Sold (Public Records) — Public Records
- 2012-07-26 Sold (Public Records) — Public Records
- 2008-06-27 Sold (Public Records) — Public Records
- 2005-11-30 Sold (Public Records) — Public Records
Property tax history
+3.8%/yrLatest (2025): $981 · -26.5% YoY. Source: county tax records.
Cash-flow waterfall
monthlySold comps — $/sqft
last 12 mo · ≤1 miLoading sold comps…