38833 Terri Ln · Oakhurst, CA
Flood risk 1/10 · Minimal
- FEMA flood zone
- X (unshaded)
- Chance of flooding over 30 yrs
- 0.0%
- Est. flood insurance / yr
- $507 – $1,088
Fire risk 8/10 · Major
- Est. fire insurance / yr
- $659 – $1,223
Heat risk 5/10 · Moderate
- Hot days now (above 97°F)
- 8 days/yr
- Hot days in 30 yrs
- 20 days/yr
Wind risk 1/10 · Minimal
- Chance of severe wind over 30 yrs
- —
Air-quality risk 10/10 · Severe
- Unhealthy air days now
- 53 days/yr
- Unhealthy air days in 30 yrs
- 63 days/yr
Risk factors via First Street. Map © Google.
Why this score? — see what drove the D grade
The composite is a weighted blend of 9 inputs, each scored 0–100. Each bar is that input's sub-score; the figure is the points it added to the 100-point composite (weight × sub-score).
- Cash flow +14.7/30.0
- ARV discount +7.5/15.0
- Schools +5.0/10.0
- DSCR +4.5/10.0
- 1% rule +4.1/10.0
- Livability +2.7/5.0
- Rent growth +2.5/5.0
- Condition / age +2.5/5.0
- Appreciation +0.0/10.0
$215,000
🖨 Deal sheet (PDF) 📄 Offer letter ✓ Due diligence
Listing remarks
Situated on a desirable 1.3-acre corner lot off Terry Lane and Road 426, this unique property offers two manufactured homes with plenty of potential. The primary residence is a double-wide home featuring three bedrooms and two bathrooms, complemented by an extra-large septic system designed to accommodate both dwellings. In addition, the property includes a secondary single-wide unit, ideal for extended family, guests, or possible rental income. Both homes were built prior to 1976 and are in fair condition, offering an excellent opportunity for a buyer willing to invest in maintenance and updates to bring out their full value. With its versatile layout, spacious acreage, and dual-living set
Key facts
- 1.3 acre lot
- Built 1967
- Listed 67 days
Property features AI
Finance
- Financial info: Property has two total units; Two ADUs (accessory dwelling units) noted
- HOA & community: Community features include biking and foothills
Exterior
- Parking: Driveway parking
- Security: Accessible doors (swing-in); Accessible parking
- Utilities: Well water; Sewer connected / sewer on bond; Electricity available / on property
- Home design: Manufactured house; Single-story; Entry at level 1; Accessory dwelling units present (2 ADUs)
- Construction: Metal roof; Pier jacks foundation; Guest house structure present; Property listed in fixer condition
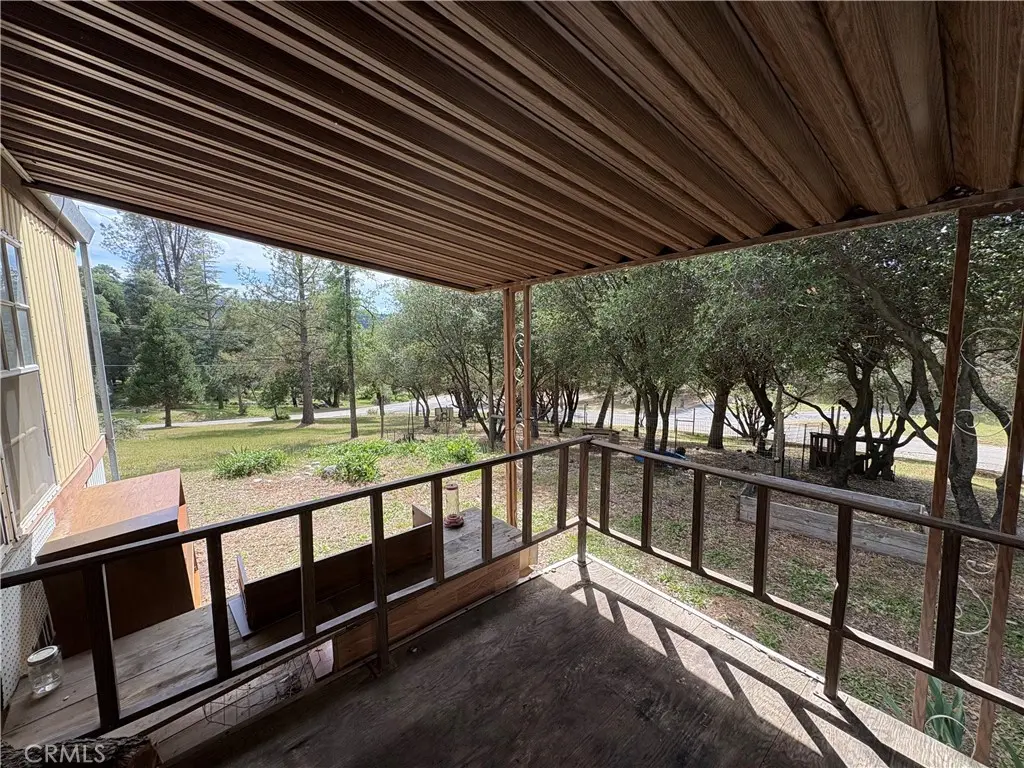
- Exterior features: Awning; Deck patio; Guest house on the property; Fenced yard (good condition); Corner lot; Landscaped grounds; Irregular lot shape; Horse property; Up slope from street; Has view
Interior
- Kitchen: Family-style kitchen; Water heater unit (appliance listed)
- Bedrooms: Main floor bedroom(s)
- Flooring: Laminated flooring
- Bathrooms: Two full bathrooms with bathtub and shower
- Heating & cooling: Wood heating; Evaporative cooling
- Interior features: One-level living; Main level bedrooms and bathrooms; Living room with fireplace; All bedrooms on the main floor; Family kitchen / eating area
- Laundry & utility: Laundry inside; Washer hookup; Gas dryer hookup
Neighborhood map
What this means for you Summary
Snapshot
- This is a 3-bed/2.0-bath other listed at $215k.
Deal economics
- At list price, monthly cash flow is $57 ($684/yr) — positive.
- The deal already cash-flows at list — no discount required.
- To meet the 1% rule (rent ≥ 1% of price), the offer needs to be $195k (9.2% below list).
- Recommended offer: $195k (9.2% below list) — sets the bar for 1% rule.
- Cap rate 6.6% vs local median 3.4% in Oakhurst — top-decile yield for the area; either an underpriced asset or a hidden risk that comps aren't pricing in. Stress-test before assuming the spread holds.
Location & tenants
- Location reads 54/100 on livability (#911 in CA) — a working-class tenant base; expect higher turnover. Strengths: housing A; Watch: crime D-, amenities F, commute F.
- Zoned schools: Oakhurst Elementary (math 22% / reading 32%, grade F, #917 of 1,571 statewide, top 60%, 352 students, 64% FRL); Oak Creek Intermediate (math 27% / reading 42%, grade F, #183 of 498 statewide, top 38%, 204 students, 68% FRL).
- Market conditions: 133 active listings in the ZIP; 1,346 units permitted in Madera County in 2024 (8 in 5+ unit buildings).
Forward outlook
- Local home prices are declining (-3.0%/yr); year-one equity from $1k of loan paydown is wiped out by about $6k of value loss. Plan a longer hold.
- Madera County population projected at +6% by 2050 — modest demand growth; plan on rents tracking national, not racing it.
Negotiation context
- It's been on market 68 days — a 6% lower offer ($202k) is reasonable based on typical stale-listing flexibility.
Risks & watch-outs
- Climate carrying-cost: severe wildfire risk; extreme-heat days projected 8→20/yr by 2055 (HVAC capex compounding) — expect insurance premiums to compound above CPI over the hold.
Questions for the listing agent
- It's been on market 68 days. Have you received any prior offers? Is the seller open to a 9% concession, seller financing, or rate buy-down credit?
- Built in 1967 — when were the roof, HVAC, electrical panel, plumbing, and water heater last replaced?
- Why hasn't it sold? Are there any deal-killer items the seller is aware of (foundation, flood, title, zoning, code violations)?
- Is there a deadline driving the sale (1031 exchange, divorce, estate, relocation)? That informs how much negotiation room exists.
- Crime grade is D in this area — have there been break-ins, vandalism, or insurance claims at this property in the last 3 years? What carrier currently insures it and at what premium?
- The area grade is low — what's the realistic commute time and amenity access for the typical tenant pool here? Any planned neighborhood developments (good or bad) we should know about?
- What's the average days-on-market for RENTAL listings here right now (not sales)? A rising rental-DOM trend means longer vacancies and softer asking-rent achievability than the comps imply.
- What's the recent tenant-quality profile in this submarket — average credit score on applications, eviction rate, late-payment / NSF rate, and stable-employment percentage? A property-management company in the area should have these aggregated.
- How much new for-sale + rental construction is in the pipeline within 1–3 miles? Heavy new supply typically softens prices + rents 12–24 months out; constrained supply supports both.
Investment metrics
- 1% rule
- 0.91% ✗
- Cap rate
- 6.61%
- Cash-on-cash
- 1.14%
- DSCR
- 1.05
- GRM
- 9.2
CMA / ARV
No comps found within radius.
Projected returns pro-forma
-3.0% appreciation · 3.0% rent growth · sell at horizon
- IRR
- -14.5%
- Equity multiple
- 0.48×
- Total profit
- $-31,181
- Equity at exit
- $32,057
- IRR
- -5.7%
- Equity multiple
- 0.63×
- Total profit
- $-22,360
- Equity at exit
- $18,589
Cash invested: $60,200 (down + closing). Projections, not guarantees.
Landlord ↔ Tenant lean methodology
- Overall (STATE)
- 18 Strongly Tenant-Friendly
- State California
- 18 Strongly Tenant-Friendly · D+13
- County
- — inherits STATE
- City
- — inherits STATE
ZIP-level market 93644
- Active inventory
- 133
- Price-to-rent
- 9.2×
Monthly cashflow live
- Estimated rent
- $1,953 medium interval (Pro) →
- Mortgage (P&I)
- −$1,127
- Tax est. 1.5%
- −$269 /mo · $3,225/yr
- Insurance
- −$90
- HOA
- −$0
- Vacancy / Maint / Mgmt
- −$410
- Net cashflow
- $57
Break-even live
Sensitivity live
| Price | -10% $206 | -5% $131 | +0% $57 | +5% $-17 | +10% $-92 |
|---|---|---|---|---|---|
| Rent | -10% $-97 | -5% $-20 | +0% $57 | +5% $134 | +10% $211 |
| Rate | -1.0pp $165 | -0.5pp $112 | base $57 | +0.5pp $1 | +1.0pp $-55 |
UW: 25.0% down · 7.5% · 30yr · 1.5% tax · 5.0% vac · 8.0% maint · 8.0% mgmt
Financing live
Cash to close
- Down payment
- $53,750
- Closing costs
- $6,450
- Reserves months
- —
- Total cash needed
- —
Loan-product check · same deal, 3 products live
Conventional
25% down · 7.5% · 30yr
- Down + closing
- —
- Monthly P&I
- —
- Monthly cashflow
- —
- DSCR
- —
- Eligible?
- —
Personal DTI + credit; lowest rate.
DSCR
20% down · 8.5% · 30yr
- Down + closing
- —
- Monthly P&I
- —
- Monthly cashflow
- —
- DSCR
- —
- Eligible?
- —
No personal income docs; deal must DSCR.
Hard money
10% down · 12.0% · 12mo
- Down + closing
- —
- Monthly P&I
- —
- Monthly cashflow
- —
- DSCR
- —
- Eligible?
- —
Short-term bridge; refi at stabilization.
Listing history 20 events
-
2026-06-22days on market $215,000 Active 68 DOM
-
2026-06-21days on market $215,000 Active 67 DOM
-
2026-06-19days on market $215,000 Active 65 DOM
-
2026-06-18days on market $215,000 Active 64 DOM
-
2026-06-17days on market $215,000 Active 63 DOM
-
2026-06-17price $215,000 Active 62 DOM
-
2026-06-16days on market $225,000 Active 62 DOM
-
2026-06-15days on market $225,000 Active 61 DOM
-
2026-06-14days on market $225,000 Active 59 DOM
-
2026-06-12days on market $225,000 Active 58 DOM
-
2026-06-09days on market $225,000 Active 55 DOM
-
2026-06-08days on market $225,000 Active 54 DOM
-
2026-06-07days on market $225,000 Active 53 DOM
-
2026-06-07days on market $225,000 Active 52 DOM
-
2026-06-04days on market $225,000 Active 49 DOM
-
2026-06-02days on market $225,000 Active 48 DOM
-
2026-06-01days on market $225,000 Active 47 DOM
-
2026-05-31days on market $225,000 Active 46 DOM
-
2026-05-31days on market $225,000 Active 45 DOM
-
2026-04-15$225,000 Active
ⓘ Source: listings_history table (triggers on properties + properties_extension) + one-shot
backfill from property_details.listing_events for pre-trigger history.
Climate risk First Street
- Flood 1/10 Low FEMA zone X (unshaded) · 0% chance over 30 yrs
- Wildfire 8/10 Severe
- Heat 5/10 Major 8 d/yr ≥97°F today · 20 d/yr by 30 yrs out
- Wind 1/10 Low
- Air quality 10/10 Extreme 53 unhealthy d/yr today · 63 by 30 yrs out
Nearby sold comps map
Loading sold comps map…
Walkable amenities ~0.75 mi
Loading nearby amenities…
Taxation est. · year 1
- Rental income
- $23,435
- − Mortgage interest
- −$12,043
- − Property taxes
- −$3,225
- − Insurance
- −$1,075
- − Repairs & maintenance
- −$1,875
- − Management
- −$1,875
- − Depreciation
- −$6,255
- Taxable loss
- −$2,913
- Est. tax savings @ 24.0%
- +$699
- After-tax cash flow
- $1,383/yr
For passive investors: Depreciation is non-cash, so a rental often shows a tax loss while cash-flowing — sheltering income. Rental losses are passive: they offset passive income freely, and up to $25,000/yr can offset ordinary (W-2) income if you actively participate and your MAGI is under $100k (phasing out to $0 by $150k); unused losses carry forward. On sale, claimed depreciation is recaptured at up to 25%, and gains may owe capital-gains tax (a 1031 exchange can defer both). Figures are a year-1 estimate at your 24.0% rate — not tax advice; consult a CPA.
Schools (NCES district)
No district data.
Livability — Oakhurst
- Score
- 54/100
- State rank
- #911
- US rank
- #24074
Category grades
Schools grade is shown separately in the Schools card above.
Census & demographics
- Census place
- Oakhurst, CA
- Population (ZIP)
- 6,490
Population outlook (Madera County) Hauer SSP2
- Today (2025)
- 157,915 people
- By 2030
- 159,604 · +1.1%
- By 2040
- 163,454 · +3.5%
- By 2050
- 167,071 · +5.8%
- By 2075
- 171,182 · +8.4%
- By 2100
- 162,781 · +3.1%
Race, ethnicity, and origin ACS 2023
- Neighborhood character
- Predominantly White (83%)
- Race & ethnicity
- White 83% Hispanic / Latino 12% Two or more races 6%
- Hispanic origin (detail)
- Mexican 9%
- Common ancestry
- Lithuanian 4% Italian 4% Slovak 4%
- Foreign-born
- 6% · Canada
- Languages at home
- 91% English-only · Spanish 6% Russian/Polish/Slavic 1% German/W. Germanic 1%
Political lean MEDSL · Madera
- 2024 margin
- Strong R (+20.8) · D 38.4% · R 59.2% · Other 2.4%
- 2008→2024 swing
- -7.5pp toward R · 2008: -13.3pp · 2024: -20.8pp
- All cycles
- 2024: R+20.8 2020: R+11.6 2016: R+17.3 2012: R+19.4 2008: R+13.3
Not yet ingested
- Civics
- —
Market trends
- HPI YoY
- ▼ -153.01%
- Current HPI
- 259.017
- Rent YoY
- —
- Metro
- —
- State GDP YoY
- ▲ 3.21%
- F500 in state
- 116
Industry mix (Fortune 500 HQ in CA)
| Industry | F500 HQs | Revenue |
|---|---|---|
| Technology | 27 | $1,492B |
|
||
| Financial Services | 3 | $174B |
|
||
| Retail | 3 | $44B |
|
||
| Insurance | 3 | $26B |
|
||
| Media / Entertainment | 2 | $115B |
|
||
| Pharmaceuticals / Biotech | 2 | $62B |
|
||
Price history
1 event — show timeline
- 2026-04-15 Listed $225,000 CRMLS
Cash-flow waterfall
monthlySold comps — $/sqft
last 12 mo · ≤1 miLoading sold comps…