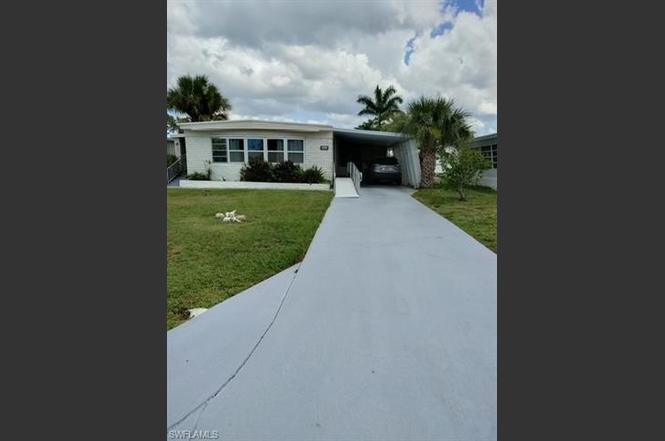
519 Riviera Blvd E · Naples, FL
Flood risk 8/10 · Major
- FEMA flood zone
- X (shaded)
- Chance of flooding over 30 yrs
- 0.97%
- Est. flood insurance / yr
- $507 – $1,088
Fire risk 3/10 · Minor
- Est. fire insurance / yr
- $947 – $1,759
Heat risk 9/10 · Severe
- Hot days now (above 107°F)
- 5 days/yr
- Hot days in 30 yrs
- 20 days/yr
Wind risk 10/10 · Severe
- Chance of severe wind over 30 yrs
- 99.0%
Air-quality risk 2/10 · Minimal
- Unhealthy air days now
- 2 days/yr
- Unhealthy air days in 30 yrs
- 2 days/yr
Risk factors via First Street. Map © Google.
Why this score? — see what drove the B grade
The composite is a weighted blend of 9 inputs, each scored 0–100. Each bar is that input's sub-score; the figure is the points it added to the 100-point composite (weight × sub-score).
- Cash flow +30.0/30.0
- 1% rule +10.0/10.0
- DSCR +10.0/10.0
- ARV discount +7.5/15.0
- Schools +5.0/10.0
- Livability +4.0/5.0
- Condition / age +2.5/5.0
- Rent growth +2.1/5.0
- Appreciation +0.0/10.0
$120,000
🖨 Deal sheet (PDF) 📄 Offer letter ✓ Due diligence
Listing remarks MLS
Enjoy owning a piece of Naples in Riviera Colony! This land owned home offers two bedrooms, offers two full baths, breakfast bar, separate dining area, living room with wall of windows and storage area with washer & dryer. The outdoor area offers a screened room for relaxing and two covered porches. Property is located right across from community pool. A little bit of elbow grease could make this a real show stopper.
Key facts
- Community pool
- Private storage area
- Garage
Tags
Property features AI
Finance
- Other: Property is a single-unit complex with 1 floor
- HOA & community: Mandatory HOA; Quarterly master HOA fee ($358); Total annual recurring fees $1,432; On-site management; HOA maintenance covers irrigation water, legal/accounting, manager, recreation facilities; Community amenities include clubhouse, community pool, exercise room, bocce court, internet access; Community type: Mobile/Manufactured
Exterior
- Parking: Attached carport (1 space)
- Utilities: Central water; Central sewer; Cable available
- Home design: Manufactured residential home; 1 story / ranch; Rear exposure facing north; Located in Riviera Colony (Subdivision 596500)
- Construction: Manufactured construction; Built in 1968
- Exterior features: Vinyl siding; Double-hung windows; Roof over
Interior
- Kitchen: Electric cooktop; Microwave; Refrigerator/ice maker
- Bedrooms: 2 bedrooms
- Flooring: Carpet
- Bathrooms: 2 full bathrooms; Master bathroom with shower only
- Heating & cooling: Central electric heat; Central electric air conditioning
- Interior features: Cable prewire; Great room floor plan; Dining area open to living (dining in living); Guest bath
- Laundry & utility: Furnished negotiable
Neighborhood map
What this means for you Summary
Snapshot
- This is a 2-bed/2.0-bath manufactured listed at $120k.
Deal economics
- At list price, monthly cash flow is $936 ($11k/yr) — positive.
- The deal already cash-flows at list — no discount required.
- Meets the 1% rule at list price ($2k rent vs $120k).
- Recommended offer: $106k (12.0% below list) — sets the bar for market timing.
Location & tenants
- Location reads 80/100 on livability (#126 in FL, #1,903 nationally) — a professional / high-income tenant draw. Strengths: crime A+, amenities A+, employment A+; Watch: commute D+, cost of living F.
- Collier (suburban): math 60% / reading 56% proficiency, ranked #16 of 73 in FL (top 22%) — acceptable for families but not a draw, mixed tenant base, ~2y average lease.
- Zoned schools: Lely Elementary School (math 45% / reading 46%, grade D-, #1,247 of 2,144 statewide, top 59%, 499 students, 62% FRL); East Naples Middle School (math 56% / reading 44%, grade C, #254 of 571 statewide, top 45%, 854 students, 63% FRL); Lely High School (math 40% / reading 39%, grade F, #304 of 667 statewide, top 47%, 1,504 students, 54% FRL) — zoned schools at 60% FRL track the district average.
- Zoned-school proficiency averages 45% at this address vs 58% district-wide (-13 pts) — the specific schools serving this property underperform the Collier average; the district grade overstates school quality for this exact location.
- Market conditions: Rents soft (-1.7%/yr); 776 active listings in the ZIP; 40 comparable units currently listed for rent nearby; rentals at typical pace (median 26d on market — plan ~3-4 weeks tenant-placement turnaround); 3,520 units permitted in Collier County in 2024 (959 in 5+ unit buildings).
- This rent runs 42% of the median local income ($70k/yr) — at the standard rent-burdened threshold; future hikes will face affordability resistance.
Forward outlook
- Local home prices are declining (-3.0%/yr); year-one equity from $830 of loan paydown is wiped out by about $4k of value loss. Plan a longer hold.
- Collier County population projected at +30% by 2050 — long-run rental-demand tailwind backs the buy-and-hold thesis.
- At projected returns (-3.0% appreciation + 0.0% rent growth), your $34k cash investment doubles in ~4 years — after that, you're playing with house money.
Negotiation context
- It's been on market 339 days — a 12% lower offer ($106k) is reasonable based on typical stale-listing flexibility.
- 4 sale attempts since 7y ago; this cycle's ask has dropped $55k (31%) from the opening price — seller is motivated, your offer sets the floor, not the list.
Risks & watch-outs
- Watch-outs: flood insurance adds $66/mo.
- Climate carrying-cost: severe flood risk; severe wind risk, 99% chance of damaging wind over 30y; extreme-heat days projected 5→20/yr by 2055 (HVAC capex compounding) — expect insurance premiums to compound above CPI over the hold.
Questions for the listing agent
- It's been on market 339 days. Have you received any prior offers? Is the seller open to a 12% concession, seller financing, or rate buy-down credit?
- Built in 1968 — when were the roof, HVAC, electrical panel, plumbing, and water heater last replaced?
- What's the actual annual flood-insurance premium (NFIP or private), and is the property in a SFHA with mandatory coverage?
- What does the HOA fee cover, when was the last increase, and are there any pending special assessments or reserve-fund shortfalls?
- Why hasn't it sold? Are there any deal-killer items the seller is aware of (foundation, flood, title, zoning, code violations)?
- Is there a deadline driving the sale (1031 exchange, divorce, estate, relocation)? That informs how much negotiation room exists.
- Schools are B-rated — typically a magnet for longer-tenancy family renters. What's the average tenant stay here, and is there a school-zone premium baked into asking?
- What's the average days-on-market for RENTAL listings here right now (not sales)? A rising rental-DOM trend means longer vacancies and softer asking-rent achievability than the comps imply.
- What's the recent tenant-quality profile in this submarket — average credit score on applications, eviction rate, late-payment / NSF rate, and stable-employment percentage? A property-management company in the area should have these aggregated.
- How much new for-sale + rental construction is in the pipeline within 1–3 miles? Heavy new supply typically softens prices + rents 12–24 months out; constrained supply supports both.
Investment metrics
- 1% rule
- 2.05% ✓
- Cap rate
- 16.32%
- Cash-on-cash
- 35.81%
- DSCR
- 2.59
- GRM
- 4.1
CMA / ARV
No comps found within radius.
Projected returns pro-forma
-3.0% appreciation · 0.0% rent growth · sell at horizon
- IRR
- 25.0%
- Equity multiple
- 1.99×
- Total profit
- $33,128
- Equity at exit
- $17,892
- IRR
- 30.6%
- Equity multiple
- 3.33×
- Total profit
- $78,380
- Equity at exit
- $10,375
Cash invested: $33,600 (down + closing). Projections, not guarantees.
Landlord ↔ Tenant lean methodology
- Overall (STATE)
- 87 Strongly Landlord-Friendly
- State Florida
- 87 Strongly Landlord-Friendly · R+3
- County
- — inherits STATE
- City
- — inherits STATE
ZIP-level market 34112
- Rents YoY
- -1.7%
- Active inventory
- 776
- Price-to-rent
- 4.1×
Monthly cashflow live
- Estimated rent
- $2,459 high interval (Pro) →
- Mortgage (P&I)
- −$629
- Tax from tax record
- −$141 /mo · $1,696/yr
- Insurance
- −$50
- Flood insurance flood zone
- −$66 /mo · $798/yr
- HOA
- −$119
- Vacancy / Maint / Mgmt
- −$516
- Net cashflow
- $936
Break-even live
Sensitivity live
| Price | -10% $1,004 | -5% $970 | +0% $936 | +5% $902 | +10% $868 |
|---|---|---|---|---|---|
| Rent | -10% $742 | -5% $839 | +0% $936 | +5% $1,033 | +10% $1,131 |
| Rate | -1.0pp $997 | -0.5pp $967 | base $936 | +0.5pp $905 | +1.0pp $874 |
UW: 25.0% down · 7.5% · 30yr · 1.5% tax · 5.0% vac · 8.0% maint · 8.0% mgmt
Financing live
Cash to close
- Down payment
- $30,000
- Closing costs
- $3,600
- Reserves months
- —
- Total cash needed
- —
Loan-product check · same deal, 3 products live
Conventional
25% down · 7.5% · 30yr
- Down + closing
- —
- Monthly P&I
- —
- Monthly cashflow
- —
- DSCR
- —
- Eligible?
- —
Personal DTI + credit; lowest rate.
DSCR
20% down · 8.5% · 30yr
- Down + closing
- —
- Monthly P&I
- —
- Monthly cashflow
- —
- DSCR
- —
- Eligible?
- —
No personal income docs; deal must DSCR.
Hard money
10% down · 12.0% · 12mo
- Down + closing
- —
- Monthly P&I
- —
- Monthly cashflow
- —
- DSCR
- —
- Eligible?
- —
Short-term bridge; refi at stabilization.
Rent comps 40 comps
| Address | Beds | Baths | Sqft | Rent | $/sqft | DOM | Units | Dist |
|---|---|---|---|---|---|---|---|---|
| 5419 Rattlesnake Hammock Rd Unit 307F Naples, FL | 2.0 | 2.0 | 1071 | $1,950 | $1.82 | 16d | 1 | 0.23mi |
| 332 Charlemagne Blvd Unit H103 Naples, FL | 2.0 | 2.0 | 1082 | $3,495 | $3.23 | 25d | 1 | 0.23mi |
| 332 Charlemagne Blvd Unit H101 Naples, FL | 2.0 | 2.0 | 1082 | $3,500 | $3.23 | 25d | 1 | 0.23mi |
| 200 Valley Stream Dr Unit 8B Naples, FL | 2.0 | 2.0 | 979 | $1,750 | $1.79 | 25d | 1 | 0.27mi |
| 360 Charlemagne Blvd Unit D105 Naples, FL | 2.0 | 2.0 | 1082 | $3,200 | $2.96 | 25d | 1 | 0.29mi |
| 300 Valley Stream Dr Unit 3D Naples, FL | 2.0 | 2.0 | 979 | $1,795 | $1.83 | 25d | 1 | 0.31mi |
| 300 Valley Stream Dr Unit 3D Naples, FL | 2.0 | 2.0 | 979 | $1,795 | $1.83 | 23d | 1 | 0.31mi |
| 5499 Rattlesnake Hammock Rd Naples, FL | 2.0 | 2.0 | 1071 | $1,775 | $1.66 | 16d | 2 | 0.31mi |
| 4410 Chantelle Dr Unit H-205 Naples, FL | 2.0 | 2.0 | 1349 | $3,500 | $2.59 | 16d | 1 | 0.34mi |
| 4977 Pepper Cir #205 Naples, FL | 2.0 | 2.0 | 1250 | $2,250 | $1.80 | 23d | 1 | 0.36mi |
| 232 Pebble Beach Blvd #104 Naples, FL | 3.0 | 2.0 | 1298 | $1,975 | $1.52 | 25d | 1 | 0.36mi |
| 5595 Greenwood Cir #92 Naples, FL | 3.0 | 2.0 | 1450 | $5,000 | $3.45 | 25d | 1 | 0.37mi |
| 240 Pebble Beach Blvd #702 Naples, FL | 2.0 | 2.0 | 1090 | $4,000 | $3.67 | 25d | 1 | 0.43mi |
| 4911 Catalina Dr Unit 22 Naples, FL | 3.0 | 1.5 | 1200 | $1,950 | $1.62 | 16d | 1 | 0.44mi |
| 190 Pebble Beach Blvd #301 Naples, FL | 2.0 | 2.0 | 954 | $1,700 | $1.78 | 25d | 1 | 0.44mi |
| 4907 Catalina Dr Unit 45 Naples, FL | 3.0 | 2.0 | 1270 | $1,900 | $1.50 | 16d | 1 | 0.46mi |
| 5502 Greenwood Cir #1 Naples, FL | 3.0 | 2.0 | 1450 | $2,400 | $1.66 | 25d | 1 | 0.49mi |
| 5535 Rattlesnake Hammock Rd #302 Naples, FL | 2.0 | 2.0 | 1205 | $2,800 | $2.32 | 25d | 1 | 0.50mi |
| 5778 Greenwood Cir Naples, FL | 3.0 | 2.0 | 1450 | $4,000 | $2.76 | 25d | 1 | 0.53mi |
| 4830 Cortez Cir Naples, FL | 3.0 | 2.0 | 1218 | $3,100 | $2.55 | 25d | 1 | 0.56mi |
| 4900 Biscayne Dr #22 Naples, FL | 2.0 | 2.0 | 1108 | $1,800 | $1.62 | 23d | 1 | 0.58mi |
| 5635 Rattlesnake Hammock Rd Apt 203D Naples, FL | 2.0 | 2.0 | 1054 | $1,700 | $1.61 | 23d | 1 | 0.59mi |
| 5651 Rattlesnake Hammock Rd Unit C-108 Naples, FL | 2.0 | 2.0 | 1054 | $1,800 | $1.71 | 25d | 1 | 0.63mi |
| 5483 Rattlesnake Hammock Rd Unit 201B Naples, FL | 2.0 | 2.0 | 1071 | $1,800 | $1.68 | 16d | 1 | 0.65mi |
| 4300 Gulfstream Dr Unit 2D Naples, FL | 2.0 | 2.0 | 1115 | $1,295 | $1.16 | 25d | 1 | 0.72mi |
| 4231 Gulfstream Dr Apt 102 Naples, FL | 3.0 | 2.0 | 1178 | $1,995 | $1.69 | 16d | 1 | 0.73mi |
| 4290 Gulfstream Dr #5 Naples, FL | 2.0 | 2.0 | 956 | $1,600 | $1.67 | 25d | 1 | 0.74mi |
| 2093 Pine Isle Ln #2093 Naples, FL | 2.0 | 2.0 | 927 | $1,695 | $1.83 | 25d | 1 | 0.82mi |
| 4360 Petal Dr Naples, FL | 3.0 | 1.0–2.0 | 1018 | $2,566 | $2.52 | 15d | 37 | 0.84mi |
| 5708 Deauville Cir Unit 308 Naples, FL | 3.0 | 2.0 | 1500 | $4,500 | $3.00 | 25d | 1 | 0.84mi |
| 3625 Boca Ciega Dr Naples, FL | 2.0 | 2.0 | 930 | $2,400 | $2.58 | 25d | 2 | 0.85mi |
| 452 Bristle Cone Ln #27 Naples, FL | 2.0 | 2.0 | 1129 | $2,000 | $1.77 | 25d | 1 | 0.86mi |
| 6984 Saona Ct Naples, FL | 2.0 | 2.0 | 1472 | $7,500 | $5.10 | 25d | 1 | 0.88mi |
| 5792 Deauville Cir Unit A103 Naples, FL | 2.0 | 2.0 | 1209 | $3,900 | $3.23 | 25d | 1 | 0.89mi |
| 3655 Boca Ciega Dr #202 Naples, FL | 2.0 | 2.0 | 966 | $1,800 | $1.86 | 25d | 1 | 0.93mi |
| 5733 Deauville Cir Unit G308 Naples, FL | 3.0 | 2.0 | 1427 | $3,600 | $2.52 | 25d | 1 | 0.93mi |
| 4556 Andover Way Unit E106 Naples, FL | 2.0 | 2.0 | 1172 | $1,900 | $1.62 | 16d | 1 | 0.93mi |
| 4556 Andover Way Unit E104 Naples, FL | 2.0 | 2.0 | 1072 | $5,000 | $4.66 | 16d | 1 | 0.93mi |
| 413 Augusta Blvd #302 Naples, FL | 2.0 | 2.0 | 1390 | $5,500 | $3.96 | 23d | 1 | 0.94mi |
| 520 Augusta Blvd Unit B204 Naples, FL | 3.0 | 2.0 | 1294 | $2,200 | $1.70 | 25d | 1 | 0.94mi |
HOA detail
- Monthly dues
- $119 · $1,428/yr
- Likely covers
- pool
Listing history 30 events
-
2026-06-22days on market $120,000 Active 339 DOM
-
2026-06-18days on market $120,000 Active 336 DOM
-
2026-06-17days on market $120,000 Active 335 DOM
-
2026-06-16days on market $120,000 Active 334 DOM
-
2026-06-15days on market $120,000 Active 333 DOM
-
2026-06-10days on market $120,000 Active 328 DOM
-
2026-06-09days on market $120,000 Active 327 DOM
-
2026-06-08days on market $120,000 Active 326 DOM
-
2026-06-07days on market $120,000 Active 325 DOM
-
2026-06-02days on market $120,000 Active 320 DOM
-
2026-06-01days on market $120,000 Active 319 DOM
-
2026-05-31days on market $120,000 Active 318 DOM
-
2026-05-30days on market $120,000 Active 317 DOM
-
2026-02-15price $120,000
-
2025-09-05price $167,990
-
2025-07-17$174,990 Active
-
2025-02-20historical
-
2024-11-13price $175,000
-
2024-10-22$189,000 Active
-
2022-12-27soldstatus $159,900
-
2022-12-21soldstatus $159,900 Closed 427-char remark
Show marketing remark (427 chars)
Enjoy owning a piece of Naples in Riviera Colony! This land owned home offers two bedrooms, offers two full baths, breakfast bar, separate dining area, living room with wall of windows and storage area with washer & dryer. The outdoor area offers a screened room for relaxing and two covered porches. Property is located right across from community pool. A little bit of elbow grease could make this a real show stopper.
-
2022-11-21status Pending 427-char remark
Show marketing remark (427 chars)
Enjoy owning a piece of Naples in Riviera Colony! This land owned home offers two bedrooms, offers two full baths, breakfast bar, separate dining area, living room with wall of windows and storage area with washer & dryer. The outdoor area offers a screened room for relaxing and two covered porches. Property is located right across from community pool. A little bit of elbow grease could make this a real show stopper.
-
2022-11-05price $159,900 427-char remark
Show marketing remark (427 chars)
Enjoy owning a piece of Naples in Riviera Colony! This land owned home offers two bedrooms, offers two full baths, breakfast bar, separate dining area, living room with wall of windows and storage area with washer & dryer. The outdoor area offers a screened room for relaxing and two covered porches. Property is located right across from community pool. A little bit of elbow grease could make this a real show stopper.
-
2022-10-08$179,900 Active 427-char remark
Show marketing remark (427 chars)
Enjoy owning a piece of Naples in Riviera Colony! This land owned home offers two bedrooms, offers two full baths, breakfast bar, separate dining area, living room with wall of windows and storage area with washer & dryer. The outdoor area offers a screened room for relaxing and two covered porches. Property is located right across from community pool. A little bit of elbow grease could make this a real show stopper.
-
2022-10-03soldstatus $75,000
-
2020-05-31historical
-
2019-09-26$122,000 Active
-
2006-03-30soldstatus $127,000
-
1994-12-30soldstatus $50,000
-
1993-10-05soldstatus $42,500
ⓘ Source: listings_history table (triggers on properties + properties_extension) + one-shot
backfill from property_details.listing_events for pre-trigger history.
Tax reassessment forecast FL · Resets to sale price
- Current annual tax
- $1,696 · $141/mo
- Projected year-2 tax
- $1,696 · $141/mo
- Expected delta
- $0/yr ($0/mo · 0.0%)
ⓘ Screening estimate from a state-policy table — verify with the county assessor before closing.
Climate risk First Street
- Flood 8/10 Severe FEMA zone X (shaded) · 97% chance over 30 yrs
- Wildfire 3/10 Moderate
- Heat 9/10 Extreme 5 d/yr ≥107°F today · 20 d/yr by 30 yrs out
- Wind 10/10 Extreme 99% chance of damaging wind over 30 yrs
- Air quality 2/10 Low 2 unhealthy d/yr today · 2 by 30 yrs out
Nearby sold comps map
Loading sold comps map…
Walkable amenities ~0.75 mi
Loading nearby amenities…
Taxation est. · year 1
- Rental income
- $29,504
- − Mortgage interest
- −$6,722
- − Property taxes
- −$1,696
- − Insurance
- −$1,398
- − Repairs & maintenance
- −$2,360
- − Management
- −$2,360
- − HOA
- −$1,428
- − Depreciation
- −$3,491
- Taxable income
- $10,049
- Est. tax owed @ 24.0%
- −$2,412
- After-tax cash flow
- $8,824/yr
For passive investors: Depreciation is non-cash, so a rental often shows a tax loss while cash-flowing — sheltering income. Rental losses are passive: they offset passive income freely, and up to $25,000/yr can offset ordinary (W-2) income if you actively participate and your MAGI is under $100k (phasing out to $0 by $150k); unused losses carry forward. On sale, claimed depreciation is recaptured at up to 25%, and gains may owe capital-gains tax (a 1031 exchange can defer both). Figures are a year-1 estimate at your 24.0% rate — not tax advice; consult a CPA.
Schools (NCES district)
- District
- Collier
- NCES district ID
- 1200330
- Math proficiency
- 60% ▼ -4.00%
- Reading proficiency
- 56% ▼ -2.00%
- Median HH income
- $58,275
- Composite
- 50.23/100
- National rank
- #1892
- State rank
- #16 of 73 in FL
Livability — Naples
- Score
- 80/100
- State rank
- #126
- US rank
- #1903
Category grades
Schools grade is shown separately in the Schools card above.
Census & demographics
- County
- Collier County · 396,295 people
- City population
- 344,941
- Metro
- Naples-Marco Island, FL
- Population (ZIP)
- 27,193
- Household income
- $69,842
- Rent vs Own
- Severe rent burden
- 980.0
Population outlook (Collier County) Hauer SSP2
- Today (2025)
- 420,858 people
- By 2030
- 450,054 · +6.9%
- By 2040
- 502,232 · +19.3%
- By 2050
- 544,932 · +29.5%
- By 2075
- 627,203 · +49.0%
- By 2100
- 659,015 · +56.6%
Race, ethnicity, and origin ACS 2023
- Neighborhood character
- Predominantly White (74%)
- Race & ethnicity
- White 74% Hispanic / Latino 18% Two or more races 9% Black 6% Native American 2% Asian 1%
- Hispanic origin (detail)
- Mexican 7% Puerto Rican 2% Cuban 4% Dominican 1%
- Common ancestry
- Hispanic 4% Romanian 3% Portuguese 2%
- Foreign-born
- 19% · Canada, Jamaica
- Languages at home
- 75% English-only · Spanish 17% French/Haitian/Cajun 4% German/W. Germanic 1%
Political lean MEDSL · Collier
- 2024 margin
- Solid R (+33.1) · D 33.1% · R 66.2%
- 2008→2024 swing
- -10.6pp toward R · 2008: -22.5pp · 2024: -33.1pp
- All cycles
- 2024: R+33.1 2020: R+24.7 2016: R+26.0 2012: R+30.1 2008: R+22.5
Not yet ingested
- Civics
- —
Market trends
- HPI YoY
- ▼ -235.10%
- Current HPI
- 256.9182
- Rent YoY
- ▼ -1.69%
- Metro
- Naples-Marco Island, FL
- State GDP YoY
- ▲ 3.28%
- F500 in state
- 36
Industry mix (Fortune 500 HQ in FL)
| Industry | F500 HQs | Revenue |
|---|---|---|
| Industrial Technology | 2 | $29B |
|
||
| Insurance | 2 | $17B |
|
||
| Retail | 1 | $60B |
|
||
| Technology Distribution | 1 | $58B |
|
||
| Homebuilding | 1 | $35B |
|
||
| Technology Manufacturing | 1 | $35B |
|
||
Price history
+182.4% since first listed17 events — show timeline
- 2026-02-15 Price Changed $120,000 NAPLESMLS
- 2025-09-05 Price Changed $167,990 NAPLESMLS
- 2025-07-17 Listed $174,990 NAPLESMLS
- 2025-02-20 Listing Removed — NAPLESMLS
- 2024-11-13 Price Changed $175,000 NAPLESMLS
- 2024-10-22 Listed $189,000 NAPLESMLS
- 2022-12-27 Sold (Public Records) $159,900 Public Records
- 2022-12-21 Sold (MLS) $159,900 FORTMLS
- 2022-11-21 Pending — FORTMLS
- 2022-11-05 Price Changed $159,900 FORTMLS
- 2022-10-08 Listed $179,900 FORTMLS
- 2022-10-03 Sold (Public Records) $75,000 Public Records
- 2020-05-31 Listing Removed — NAPLESMLS
- 2019-09-26 Listed $122,000 NAPLESMLS
- 2006-03-30 Sold (Public Records) $127,000 Public Records
- 1994-12-30 Sold (Public Records) $50,000 Public Records
- 1993-10-05 Sold (Public Records) $42,500 Public Records
Property tax history
+21.9%/yrLatest (2025): $1,696 · +4.6% YoY. Source: county tax records.
Cash-flow waterfall
monthlySold comps — $/sqft
last 12 mo · ≤1 miLoading sold comps…