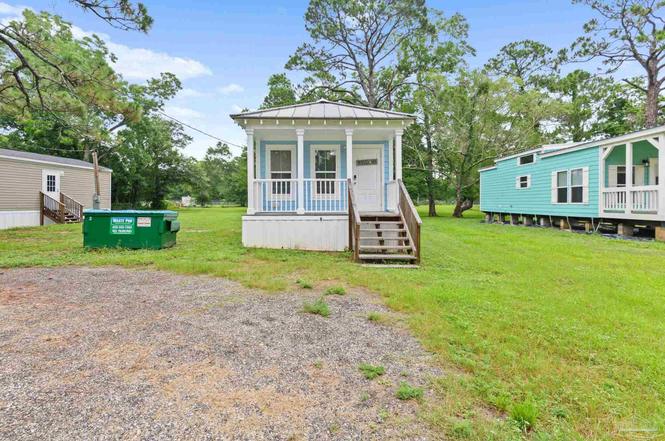
9433 Gulf Beach Hwy · Pensacola Station, FL
Flood risk No data
- FEMA flood zone
- —
- Chance of flooding over 30 yrs
- —
- Est. flood insurance / yr
- —
Fire risk No data
- Est. fire insurance / yr
- —
Heat risk No data
- Hot days now (above threshold)
- —
- Hot days in 30 yrs
- —
Wind risk No data
- Chance of severe wind over 30 yrs
- —
Air-quality risk No data
- Unhealthy air days now
- —
- Unhealthy air days in 30 yrs
- —
Risk factors via First Street. Map © Google.
Why this score? — see what drove the D grade
The composite is a weighted blend of 9 inputs, each scored 0–100. Each bar is that input's sub-score; the figure is the points it added to the 100-point composite (weight × sub-score).
- Cash flow +14.7/30.0
- ARV discount +7.5/15.0
- DSCR +4.5/10.0
- Schools +3.6/10.0
- 1% rule +3.0/10.0
- Rent growth +2.8/5.0
- Livability +2.5/5.0
- Condition / age +2.5/5.0
- Appreciation +0.0/10.0
$185,000
🖨 Deal sheet (PDF) 📄 Offer letter ✓ Due diligence
Listing remarks
Well-maintained 2-bedroom, 2-bath modular home offering 840 SF of comfortable living space in a convenient Pensacola location off Gulf Beach Highway. Situated right next to a similar neighboring property, this home backs up to vacant land, providing a peaceful setting with added privacy and natural views. Inside, you’ll find a functional floor plan with an open living area, abundant natural light, and a layout designed for comfortable everyday living. The spacious primary suite includes a private bath, while the second bedroom and bath provide flexibility for guests, roommates, or a home office. Located just minutes from Big Lagoon, Perdido Key beaches, boat launches, shopping, and di
Key facts
- Modular home
- Natural views
- Private bath
Tags
Property features AI
Finance
- Other: Lot roughly 0.23 acre (approx. 171 x 60); Directions: From Pensacola on 292, turn left onto Gulf Beach Highway; travel about half a mile and property will be on the left
- HOA & community: No association
Exterior
- Parking: Driveway with open parking
- Utilities: Public water; Septic tank
- Home design: Mobile/Manufactured or Modular home; Single-story; Resale property
- Construction: Off-grade foundation
- Exterior features: Front porch; Metal roof; Paved public road access
Interior
- Kitchen: Microwave; Refrigerator
- Bedrooms: Master bedroom on the first floor (approximately 10' x 12'); Additional bedroom on the first floor (approximately 10' x 12')
- Flooring: Vinyl flooring; Carpet flooring
- Bathrooms: Two full bathrooms
- Heating & cooling: Central heating; Central air conditioning
- Interior features: Living/dining combination; Vinyl and carpet flooring
- Laundry & utility: Washer; Dryer; Electric water heater
Neighborhood map
What this means for you Summary
Snapshot
- This is a 2-bed/2.0-bath manufactured listed at $185k.
Deal economics
- At list price, monthly cash flow is $48 ($577/yr) — positive.
- The deal already cash-flows at list — no discount required.
- To meet the 1% rule (rent ≥ 1% of price), the offer needs to be $148k (20.0% below list).
- Recommended offer: $148k (20.0% below list) — sets the bar for 1% rule.
- Cap rate 6.6% vs local median 2.1% in Pensacola Station — top-decile yield for the area; either an underpriced asset or a hidden risk that comps aren't pricing in. Stress-test before assuming the spread holds.
Location & tenants
- Location reads: area grade D — affects rentability + tenant quality, not the cash-flow math above.
- Escambia (suburban): math 40% / reading 45% proficiency, ranked #56 of 73 in FL (top 77%) — families likely to look elsewhere, expect single-tenant / working-renter base with shorter leases.
- Zoned schools: Pleasant Grove Elementary School (math 60% / reading 53%, grade C+, #816 of 2,144 statewide, top 39%, 534 students, 66% FRL); Jim C. Bailey Middle School (math 38% / reading 39%, grade F, #384 of 571 statewide, top 68%, 1,159 students, 57% FRL); Escambia High School (math 19% / reading 29%, grade F, #529 of 667 statewide, top 80%, 1,655 students, 62% FRL) — zoned schools at 62% FRL track the district average.
- Market conditions: Rents rising (+1.2%/yr); 701 active listings in the ZIP; 1 comparable units currently listed for rent nearby; 1,479 units permitted in Escambia County in 2024 (0 in 5+ unit buildings).
Forward outlook
- Local home prices are declining (-3.0%/yr); year-one equity from $1k of loan paydown is wiped out by about $6k of value loss. Plan a longer hold.
- Escambia County population projected at +13% by 2050 — modest demand growth; plan on rents tracking national, not racing it.
Negotiation context
- Only 2 days on market — expect competitive offers; lowballing is unlikely to land.
- 2 sale attempts with the ask held roughly flat each time — persistent listings suggest the price (not the market) is what's stuck; bring a comps-based counter.
Questions for the listing agent
- Is there a deadline driving the sale (1031 exchange, divorce, estate, relocation)? That informs how much negotiation room exists.
- The area grade is low — what's the realistic commute time and amenity access for the typical tenant pool here? Any planned neighborhood developments (good or bad) we should know about?
- What's the average days-on-market for RENTAL listings here right now (not sales)? A rising rental-DOM trend means longer vacancies and softer asking-rent achievability than the comps imply.
- What's the recent tenant-quality profile in this submarket — average credit score on applications, eviction rate, late-payment / NSF rate, and stable-employment percentage? A property-management company in the area should have these aggregated.
- How much new for-sale + rental construction is in the pipeline within 1–3 miles? Heavy new supply typically softens prices + rents 12–24 months out; constrained supply supports both.
Investment metrics
- 1% rule
- 0.80% ✗
- Cap rate
- 6.60%
- Cash-on-cash
- 1.11%
- DSCR
- 1.05
- GRM
- 10.4
CMA / ARV
- ARV (median comp)
- $100,000
- List price
- $185,000
- Delta
- 90.00%
- Verdict
- OVERPRICED
- Comps
- 3 within 2.0 mi
Projected returns pro-forma
-3.0% appreciation · 1.22% rent growth · sell at horizon
- IRR
- -16.4%
- Equity multiple
- 0.43×
- Total profit
- $-29,594
- Equity at exit
- $27,584
- IRR
- -11.2%
- Equity multiple
- 0.37×
- Total profit
- $-32,440
- Equity at exit
- $15,995
Cash invested: $51,800 (down + closing). Projections, not guarantees.
Landlord ↔ Tenant lean methodology
- Overall (STATE)
- 87 Strongly Landlord-Friendly
- State Florida
- 87 Strongly Landlord-Friendly · R+3
- County
- — inherits STATE
- City
- — inherits STATE
ZIP-level market 32507
- Home prices YoY
- -4.6%
- Rents YoY
- 1.2%
- Active inventory
- 701
- Price-to-rent
- 10.4×
Monthly cashflow live
- Estimated rent
- $1,480 medium interval (Pro) →
- Mortgage (P&I)
- −$970
- Tax from tax record
- −$74 /mo · $884/yr
- Insurance
- −$77
- HOA
- −$0
- Vacancy / Maint / Mgmt
- −$311
- Net cashflow
- $48
Break-even live
Sensitivity live
| Price | -10% $153 | -5% $100 | +0% $48 | +5% $-4 | +10% $-57 |
|---|---|---|---|---|---|
| Rent | -10% $-69 | -5% $-10 | +0% $48 | +5% $107 | +10% $165 |
| Rate | -1.0pp $141 | -0.5pp $95 | base $48 | +0.5pp $0 | +1.0pp $-49 |
UW: 25.0% down · 7.5% · 30yr · 1.5% tax · 5.0% vac · 8.0% maint · 8.0% mgmt
Financing live
Cash to close
- Down payment
- $46,250
- Closing costs
- $5,550
- Reserves months
- —
- Total cash needed
- —
Loan-product check · same deal, 3 products live
Conventional
25% down · 7.5% · 30yr
- Down + closing
- —
- Monthly P&I
- —
- Monthly cashflow
- —
- DSCR
- —
- Eligible?
- —
Personal DTI + credit; lowest rate.
DSCR
20% down · 8.5% · 30yr
- Down + closing
- —
- Monthly P&I
- —
- Monthly cashflow
- —
- DSCR
- —
- Eligible?
- —
No personal income docs; deal must DSCR.
Hard money
10% down · 12.0% · 12mo
- Down + closing
- —
- Monthly P&I
- —
- Monthly cashflow
- —
- DSCR
- —
- Eligible?
- —
Short-term bridge; refi at stabilization.
Rent comps 1 comps
| Address | Beds | Baths | Sqft | Rent | $/sqft | DOM | Units | Dist |
|---|---|---|---|---|---|---|---|---|
| 9775 N Loop Rd #1 Pensacola, FL | 1.0 | 1.0 | 600 | $1,200 | $2.00 | 25d | 1 | 0.44mi |
Listing history 4 events
-
2026-06-21remarks 693-char remark
-
2026-06-21pricedays on market $185,000 Active 2 DOM
-
2026-04-01price $190,000 1922-char remark
-
2026-02-23$295,000 Active 1922-char remark
ⓘ Source: listings_history table (triggers on properties + properties_extension) + one-shot
backfill from property_details.listing_events for pre-trigger history.
Tax reassessment forecast FL · Resets to sale price
- Current annual tax
- $884 · $74/mo
- Projected year-2 tax
- $1,536 · $128/mo
- Expected delta
- +$651/yr (+$54/mo · 73.7%)
ⓘ Screening estimate from a state-policy table — verify with the county assessor before closing.
Nearby sold comps map
Loading sold comps map…
Walkable amenities ~0.75 mi
Loading nearby amenities…
Taxation est. · year 1
- Rental income
- $17,757
- − Mortgage interest
- −$10,363
- − Property taxes
- −$884
- − Insurance
- −$925
- − Repairs & maintenance
- −$1,421
- − Management
- −$1,421
- − Depreciation
- −$5,382
- Taxable loss
- −$2,638
- Est. tax savings @ 24.0%
- +$633
- After-tax cash flow
- $1,210/yr
For passive investors: Depreciation is non-cash, so a rental often shows a tax loss while cash-flowing — sheltering income. Rental losses are passive: they offset passive income freely, and up to $25,000/yr can offset ordinary (W-2) income if you actively participate and your MAGI is under $100k (phasing out to $0 by $150k); unused losses carry forward. On sale, claimed depreciation is recaptured at up to 25%, and gains may owe capital-gains tax (a 1031 exchange can defer both). Figures are a year-1 estimate at your 24.0% rate — not tax advice; consult a CPA.
Schools (NCES district)
- District
- Escambia
- NCES district ID
- 1200510
- Math proficiency
- 40% ▼ -9.00%
- Reading proficiency
- 45% ▼ -4.00%
- Median HH income
- $44,649
- Composite
- 36.04/100
- National rank
- #4773
- State rank
- #56 of 73 in FL
Livability — Pensacola Station
No livability data for this city. (Only ~50 U.S. cities are tracked.)
Census & demographics
- County
- Escambia County · 301,722 people
- City population
- 4,993
- Metro
- Pensacola-Ferry Pass-Brent, FL
- Population (ZIP)
- 32,226
- Household income
- $73,540
- Rent vs Own
- Severe rent burden
- 1175.0
Population outlook (Escambia County) Hauer SSP2
- Today (2025)
- 334,637 people
- By 2030
- 345,779 · +3.3%
- By 2040
- 364,828 · +9.0%
- By 2050
- 378,514 · +13.1%
- By 2075
- 403,220 · +20.5%
- By 2100
- 386,125 · +15.4%
Race, ethnicity, and origin ACS 2023
- Neighborhood character
- Predominantly White (73%)
- Race & ethnicity
- White 73% Black 10% Two or more races 10% Hispanic / Latino 7% Asian 2%
- Hispanic origin (detail)
- Mexican 3% Puerto Rican 2%
- Common ancestry
- Slovak 3% Lithuanian 2% Romanian 2%
- Foreign-born
- 5% · Canada, Vietnam
- Languages at home
- 92% English-only · Spanish 4% Other Asian/Pacific 1% French/Haitian/Cajun 1%
Political lean MEDSL · Escambia
- 2024 margin
- R (+19.5) · D 39.7% · R 59.2% · Other 1.1%
- 2008→2024 swing
- -0.2pp no change · 2008: -19.3pp · 2024: -19.5pp
- All cycles
- 2024: R+19.5 2020: R+15.1 2016: R+20.6 2012: R+20.6 2008: R+19.3
Not yet ingested
- Civics
- —
Market trends
- HPI YoY
- ▼ -26.23%
- Current HPI
- 548.03
- Rent YoY
- ▲ 1.22%
- Metro
- Pensacola-Ferry Pass-Brent, FL
- State GDP YoY
- ▲ 3.28%
- F500 in state
- 36
Industry mix (Fortune 500 HQ in FL)
| Industry | F500 HQs | Revenue |
|---|---|---|
| Industrial Technology | 2 | $29B |
|
||
| Insurance | 2 | $17B |
|
||
| Retail | 1 | $60B |
|
||
| Technology Distribution | 1 | $58B |
|
||
| Homebuilding | 1 | $35B |
|
||
| Technology Manufacturing | 1 | $35B |
|
||
Price history
-37.3% since first listed4 events — show timeline
- 2026-06-19 Listed $185,000 PARMLS
- 2026-05-26 Listing Removed — PARMLS
- 2026-04-01 Price Changed $190,000 PARMLS
- 2026-02-23 Listed $295,000 PARMLS
Property tax history
+1086.3%/yrLatest (2025): $884 · +1086.3% YoY. Source: county tax records.
Cash-flow waterfall
monthlySold comps — $/sqft
last 12 mo · ≤1 miLoading sold comps…